Visual Analytics
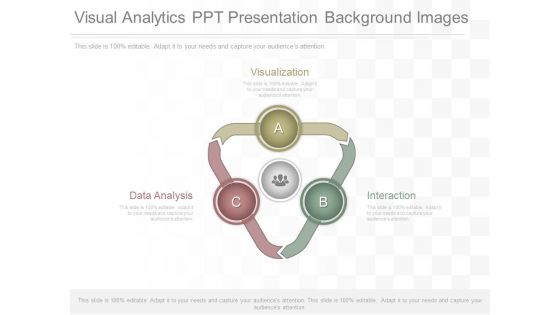
Visual Analytics Ppt Presentation Background Images
This is a visual analytics ppt presentation background images. This is a three stage process. The stages in this process are visualization, interaction, data analysis.
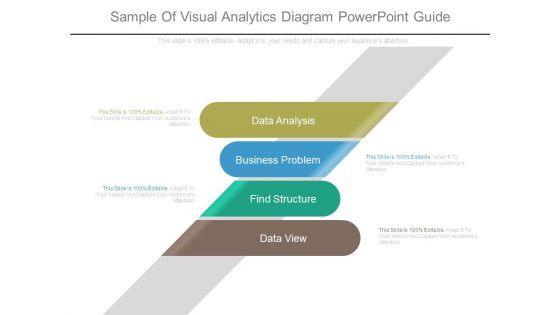
Sample Of Visual Analytics Diagram Powerpoint Guide
This is a sample of visual analytics diagram powerpoint guide. This is a four stage process. The stages in this process are data analysis, business problem, find structure, data view.
Visual Analytics Vector Icon Ppt PowerPoint Presentation Visual Aids Show
Presenting this set of slides with name visual analytics vector icon ppt powerpoint presentation visual aids show. This is a three stage process. The stages in this process are data visualization icon, research analysis, business focus. This is a completely editable PowerPoint presentation and is available for immediate download. Download now and impress your audience.

Graphical Representation Of Research IT Visual Analytics Branch Background PDF
This slide shows visual analytics, the last branch of visualization research, which emerged from the advancements in the other two branches and mainly focused on analytical reasoning. This is a graphical representation of research it visual analytics branch background pdf template with various stages. Focus and dispense information on five stages using this creative set, that comes with editable features. It contains large content boxes to add your information on topics like visual analytics branch of visualization research. You can also showcase facts, figures, and other relevant content using this PPT layout. Grab it now.
Visual Analytics Vector Icon Ppt Powerpoint Presentation Infographics Show
This is a visual analytics vector icon ppt powerpoint presentation infographics show. This is a three stage process. The stages in this process are data visualization icon, data management icon.
Visual Analytics Tools Ppt PowerPoint Presentation Inspiration Format Cpb
Presenting this set of slides with name visual analytics tools ppt powerpoint presentation inspiration format cpb. This is an editable Powerpoint three stages graphic that deals with topics like visual analytics tools to help convey your message better graphically. This product is a premium product available for immediate download and is 100 percent editable in Powerpoint. Download this now and use it in your presentations to impress your audience.
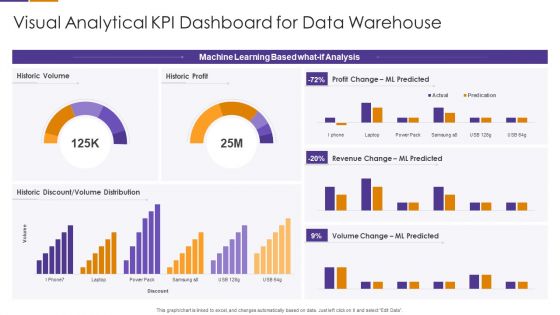
Visual Analytical KPI Dashboard For Data Warehouse Template PDF
Pitch your topic with ease and precision using this Visual Analytical KPI Dashboard For Data Warehouse Template PDF This layout presents information on Machine Learning Based, Volume Change, Revenue Change It is also available for immediate download and adjustment. So, changes can be made in the color, design, graphics or any other component to create a unique layout.
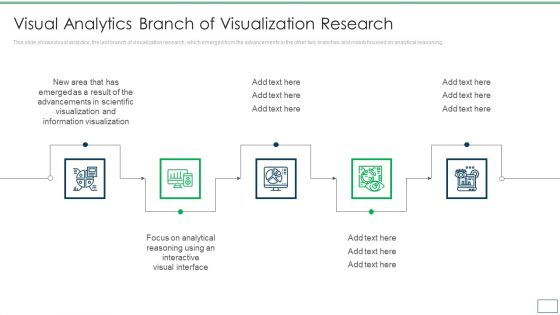
Departments Of Visualization Research Visual Analytics Branch Of Visualization Research Information PDF
This slide shows visual analytics, the last branch of visualization research, which emerged from the advancements in the other two branches and mainly focused on analytical reasoning.Presenting Departments Of Visualization Research Visual Analytics Branch Of Visualization Research Information PDF to provide visual cues and insights. Share and navigate important information on five stages that need your due attention. This template can be used to pitch topics like Information Visualization, Advancements In Scientific, Interactive Visual Interface In addtion, this PPT design contains high resolution images, graphics, etc, that are easily editable and available for immediate download.

Data And Information Visualization Visual Analytics Branch Of Visualization Research Designs PDF
This slide shows visual analytics, the last branch of visualization research, which emerged from the advancements in the other two branches and mainly focused on analytical reasoning. Make sure to capture your audiences attention in your business displays with our gratis customizable Data And Information Visualization Visual Analytics Branch Of Visualization Research Designs PDF. These are great for business strategies, office conferences, capital raising or task suggestions. If you desire to acquire more customers for your tech business and ensure they stay satisfied, create your own sales presentation with these plain slides.

Branches For Visual Analytics Branch Of Visualization Research And Development Slides PDF
This slide shows visual analytics, the last branch of visualization research, which emerged from the advancements in the other two branches and mainly focused on analytical reasoning. Want to ace your presentation in front of a live audience Our Branches For Visual Analytics Branch Of Visualization Research And Development Slides PDF can help you do that by engaging all the users towards you. Slidegeeks experts have put their efforts and expertise into creating these impeccable powerpoint presentations so that you can communicate your ideas clearly. Moreover, all the templates are customizable, and easy-to-edit and downloadable. Use these for both personal and commercial use.
Business Visual Analytics Vector Icon Ppt PowerPoint Presentation Pictures Background PDF
Presenting this set of slides with name business visual analytics vector icon ppt powerpoint presentation pictures background pdf. This is a three stage process. The stages in this process are business visual analytics vector icon. This is a completely editable PowerPoint presentation and is available for immediate download. Download now and impress your audience.

Statistical Tools For Evidence Dashboard For Data Visualization And Analytics
This slide represents the dashboard to track statistical data analysis process. The purpose of this slide is to provide a graphical representation of total sessions, bounce rate, goal completions, goal completion rate, top channels over time, etc. Are you in need of a template that can accommodate all of your creative concepts This one is crafted professionally and can be altered to fit any style. Use it with Google Slides or PowerPoint. Include striking photographs, symbols, depictions, and other visuals. Fill, move around, or remove text boxes as desired. Test out color palettes and font mixtures. Edit and save your work, or work with colleagues. Download Statistical Tools For Evidence Dashboard For Data Visualization And Analytics and observe how to make your presentation outstanding. Give an impeccable presentation to your group and make your presentation unforgettable.
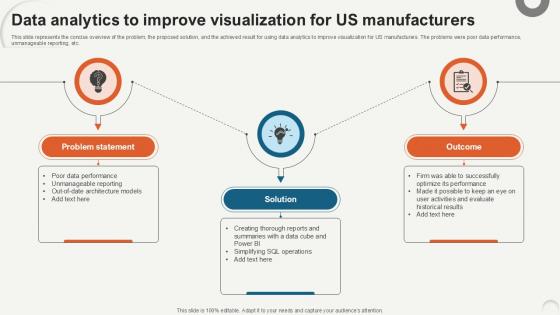
Data Analytics To Improve Visualization Data Analytics For Informed Decision Ppt PowerPoint
This slide represents the concise overview of the problem, the proposed solution, and the achieved result for using data analytics to improve visualization for US manufacturers. The problems were poor data performance, unmanageable reporting, etc. Whether you have daily or monthly meetings, a brilliant presentation is necessary. Data Analytics To Improve Visualization Data Analytics For Informed Decision Ppt PowerPoint can be your best option for delivering a presentation. Represent everything in detail using Data Analytics To Improve Visualization Data Analytics For Informed Decision Ppt PowerPoint and make yourself stand out in meetings. The template is versatile and follows a structure that will cater to your requirements. All the templates prepared by Slidegeeks are easy to download and edit. Our research experts have taken care of the corporate themes as well. So, give it a try and see the results.
Data Analytics Visualization Ppt PowerPoint Presentation Visual Aids Portfolio Cpb
This is a data analytics visualization ppt powerpoint presentation visual aids portfolio cpb. This is a five stage process. The stages in this process are data analytics visualization.

Visual Aid Web Analytics Presentations Ppt PowerPoint Presentation Infographics Elements
This is a visual aid web analytics presentations ppt powerpoint presentation infographics elements. This is a four stage process. The stages in this process are visual aids, communication, business.
Analytics Visualization Ppt PowerPoint Presentation Slides Background Designs Cpb
This is a analytics visualization ppt powerpoint presentation slides background designs cpb. This is a four stage process. The stages in this process are analytics visualization.
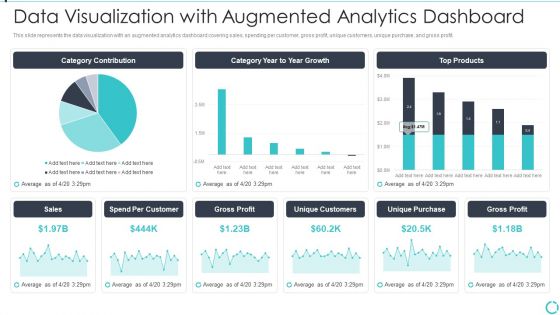
Augmented Analytics Implementation IT Data Visualization With Augmented Analytics Microsoft PDF
This slide represents the data visualization with an augmented analytics dashboard covering sales, spending per customer, gross profit, unique customers, unique purchase, and gross profit. Deliver an awe inspiring pitch with this creative Augmented Analytics Implementation IT Data Visualization With Augmented Analytics Microsoft PDF bundle. Topics like Category Contribution, Category Year To Year Growth, Top Products, Sales, Gross Profit can be discussed with this completely editable template. It is available for immediate download depending on the needs and requirements of the user.

Dashboard For Data Visualization Data Analytics For Informed Decision Ppt Sample
This slide represents the dashboard to track statistical data analysis process. The purpose of this slide is to provide a graphical representation of total sessions, bounce rate, goal completions, goal completion rate, top channels over time, etc. Do you have an important presentation coming up Are you looking for something that will make your presentation stand out from the rest Look no further than Dashboard For Data Visualization Data Analytics For Informed Decision Ppt Sample. With our professional designs, you can trust that your presentation will pop and make delivering it a smooth process. And with Slidegeeks, you can trust that your presentation will be unique and memorable. So why wait Grab Dashboard For Data Visualization Data Analytics For Informed Decision Ppt Sample today and make your presentation stand out from the rest
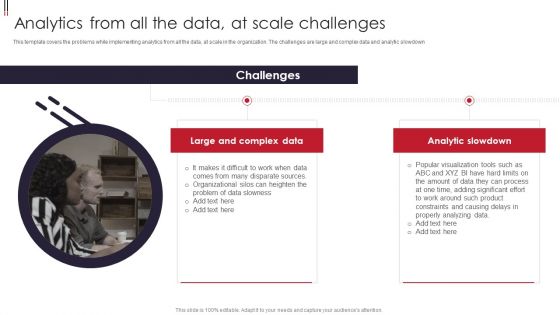
Information Visualizations Playbook Analytics From All The Data At Scale Challenges Structure PDF
This template covers the problems while implementing analytics from all the data, at scale in the organization. The challenges are large and complex data and analytic slowdown. Presenting Information Visualizations Playbook Analytics From All The Data At Scale Challenges Structure PDF to provide visual cues and insights. Share and navigate important information on two stages that need your due attention. This template can be used to pitch topics like Complex Data, Analytic Slowdown. In addtion, this PPT design contains high resolution images, graphics, etc, that are easily editable and available for immediate download.

You Tube Analytics Ppt PowerPoint Presentation Visuals
This is a you tube analytics ppt powerpoint presentation visuals. This is a two stage process. The stages in this process are finance, business, marketing, investment, analysis.
Key Driver Analytics Ppt PowerPoint Presentation Visuals
This is a key driver analytics ppt powerpoint presentation visuals. This is a four stage process. The stages in this process are icons, management, currency, technology, business.
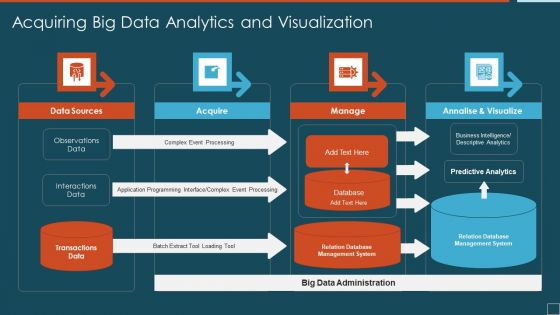
Acquiring Big Data Analytics And Visualization Ideas PDF
Presenting acquiring big data analytics and visualization ideas pdf to dispense important information. This template comprises four stages. It also presents valuable insights into the topics including data sources, acquire, manage. This is a completely customizable PowerPoint theme that can be put to use immediately. So, download it and address the topic impactfully.
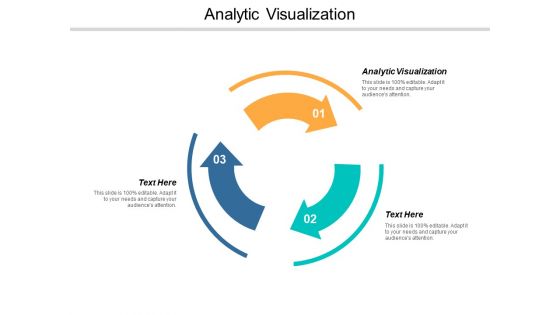
Analytic Visualization Ppt PowerPoint Presentation Portfolio Vector Cpb
This is a analytic visualization ppt powerpoint presentation portfolio vector cpb. This is a three stage process. The stages in this process are analytic visualization.
Duty List Visual Of Predictive Analytics Promotions Ppt PowerPoint Presentation Outline Layout Ideas PDF
Presenting duty list visual of predictive analytics promotions ppt powerpoint presentation outline layout ideas pdf to dispense important information. This template comprises three stages. It also presents valuable insights into the topics including duty list visual of predictive analytics promotions. This is a completely customizable PowerPoint theme that can be put to use immediately. So, download it and address the topic impactfully.

Cognitive Visualizations Computing Strategy Addressing Cognitive Analytics Contd Introduction PDF
This slide provides information regarding cognitive analytics architecture representing different layers such as physical data layer, physical hardware layer, hardware abstraction layer, low - level data services layer. Deliver and pitch your topic in the best possible manner with this Cognitive Visualizations Computing Strategy Addressing Cognitive Analytics Contd Introduction PDF. Use them to share invaluable insights on Physical Data Layer, Physical Hardware, Hardware Abstraction and impress your audience. This template can be altered and modified as per your expectations. So, grab it now.
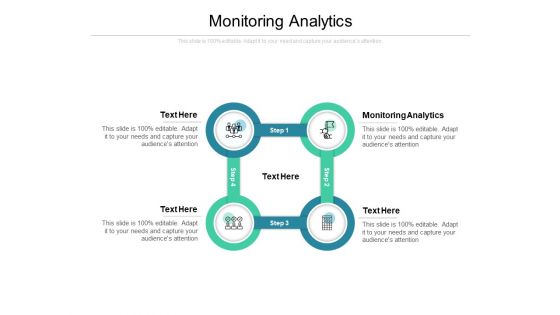
Monitoring Analytics Ppt PowerPoint Presentation Visual Aids Inspiration Cpb
Presenting this set of slides with name monitoring analytics ppt powerpoint presentation visual aids inspiration cpb. This is an editable Powerpoint four stages graphic that deals with topics like monitoring analytics to help convey your message better graphically. This product is a premium product available for immediate download and is 100 percent editable in Powerpoint. Download this now and use it in your presentations to impress your audience.
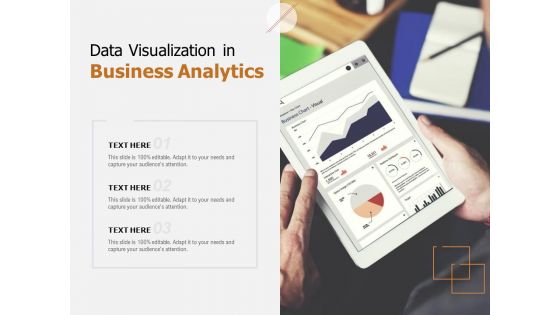
Data Visualization In Business Analytics Ppt PowerPoint Presentation Portfolio File Formats
Presenting this set of slides with name data visualization in business analytics ppt powerpoint presentation portfolio file formats. This is a three stage process. The stages in this process are data visualization, business analytics. This is a completely editable PowerPoint presentation and is available for immediate download. Download now and impress your audience.
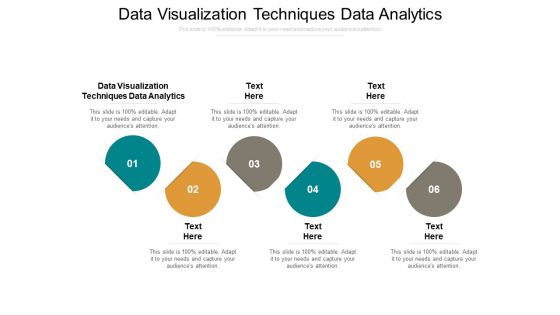
Data Visualization Techniques Data Analytics Ppt PowerPoint Presentation Outline Clipart Images Cpb
Presenting this set of slides with name data visualization techniques data analytics ppt powerpoint presentation outline clipart images cpb. This is an editable Powerpoint six stages graphic that deals with topics like data visualization techniques data analytics to help convey your message better graphically. This product is a premium product available for immediate download and is 100 percent editable in Powerpoint. Download this now and use it in your presentations to impress your audience.
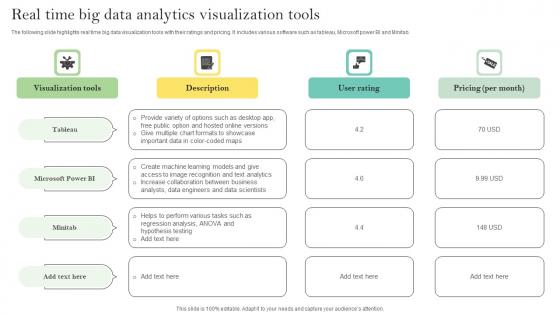
Real Time Big Data Analytics Visualization Tools Ppt Portfolio Example Pdf
The following slide highlights real time big data visualization tools with their ratings and pricing. It includes various software such as tableau, Microsoft power BI and Minitab. Pitch your topic with ease and precision using this Real Time Big Data Analytics Visualization Tools Ppt Portfolio Example Pdf. This layout presents information on Visualization Tools, User Rating, Pricing Per Month. It is also available for immediate download and adjustment. So, changes can be made in the color, design, graphics or any other component to create a unique layout.

Data Analytics Strategy Ppt PowerPoint Presentation Visual Aids Layouts Cpb
Presenting this set of slides with name data analytics strategy ppt powerpoint presentation visual aids layouts cpb. This is a six stage process. The stages in this process are data analytics strategy. This is a completely editable PowerPoint presentation and is available for immediate download. Download now and impress your audience.
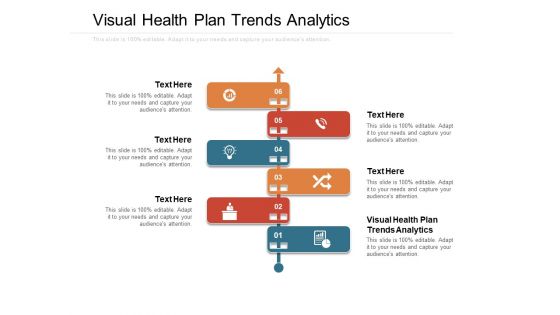
Visual Health Plan Trends Analytics Ppt PowerPoint Presentation Inspiration Slideshow Cpb Pdf
Presenting this set of slides with name visual health plan trends analytics ppt powerpoint presentation inspiration slideshow cpb pdf. This is an editable Powerpoint six stages graphic that deals with topics like visual health plan trends analytics to help convey your message better graphically. This product is a premium product available for immediate download and is 100 percent editable in Powerpoint. Download this now and use it in your presentations to impress your audience.
Data Analytics Process Ppt PowerPoint Presentation Ideas Visual Aids Cpb
This is a data analytics process ppt powerpoint presentation ideas visual aids cpb. This is a four stage process. The stages in this process are data analytics process.
Demographic Analytics Ppt PowerPoint Presentation Show Visuals Cpb
This is a demographic analytics ppt powerpoint presentation show visuals cpb. This is a five stage process. The stages in this process are demographic analytics.
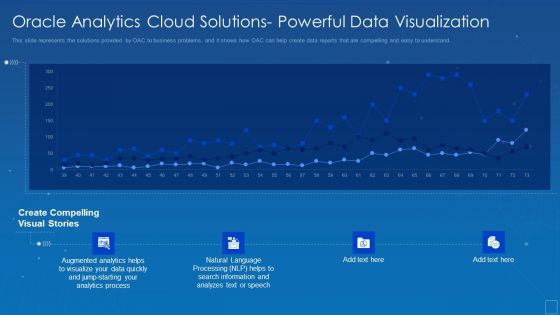
Oracle Analytics Cloud Solutions Powerful Data Visualization Template PDF
This slide represents the predictive analytics solution of the oracle analytics cloud and how it is helpful to predict outputs and display quickly with the help of ML. Deliver an awe inspiring pitch with this creative oracle analytics cloud solutions powerful data visualization template pdf bundle. Topics like oracle analytics cloud solutions powerful data visualization can be discussed with this completely editable template. It is available for immediate download depending on the needs and requirements of the user.
3 Overlapping Circles Visual For Accounts Receivable Data Analytics Ppt PowerPoint Presentation Gallery Background PDF
Presenting 3 overlapping circles visual for accounts receivable data analytics ppt powerpoint presentation gallery background pdf to dispense important information. This template comprises three stages. It also presents valuable insights into the topics including 3 overlapping circles visual for accounts receivable data analytics. This is a completely customizable PowerPoint theme that can be put to use immediately. So, download it and address the topic impactfully.
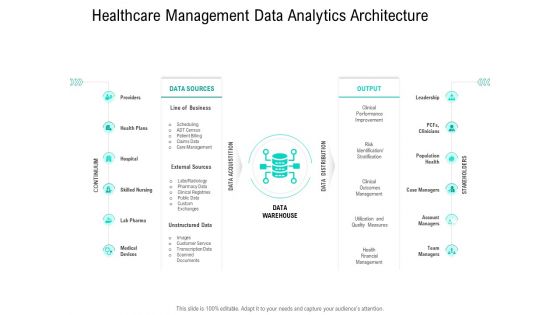
Nursing Administration Healthcare Management Data Analytics Architecture Ppt Visual Aids Pictures PDF
This is a nursing administration healthcare management data analytics architecture ppt visual aids pictures pdf template with various stages. Focus and dispense information on two stages using this creative set, that comes with editable features. It contains large content boxes to add your information on topics like line of business, external sources, management, performance improvement, financial management. You can also showcase facts, figures, and other relevant content using this PPT layout. Grab it now.

Sales Analytics Resources Ppt PowerPoint Presentation Gallery Visuals Cpb
Presenting this set of slides with name sales analytics resources ppt powerpoint presentation gallery visuals cpb. This is an editable Powerpoint four stages graphic that deals with topics like sales analytics resources to help convey your message better graphically. This product is a premium product available for immediate download and is 100 percent editable in Powerpoint. Download this now and use it in your presentations to impress your audience.

Statistical Tools For Evidence Data Analytics To Improve Visualization For Us Manufacturers
This slide represents the concise overview of the problem, the proposed solution, and the achieved result for using data analytics to improve visualization for US manufacturers. The problems were poor data performance, unmanageable reporting, etc. Crafting an eye-catching presentation has never been more straightforward. Let your presentation shine with this tasteful yet straightforward Statistical Tools For Evidence Data Analytics To Improve Visualization For Us Manufacturers template. It offers a minimalistic and classy look that is great for making a statement. The colors have been employed intelligently to add a bit of playfulness while still remaining professional. Construct the ideal Statistical Tools For Evidence Data Analytics To Improve Visualization For Us Manufacturers that effortlessly grabs the attention of your audience Begin now and be certain to wow your customers
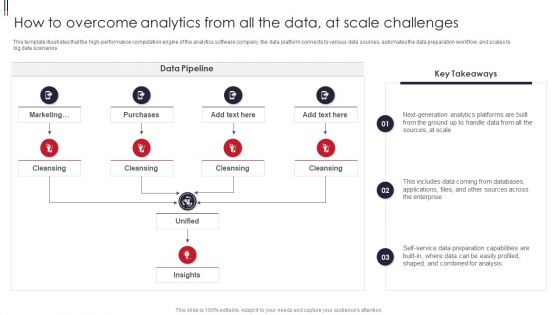
Information Visualizations Playbook How To Overcome Analytics From All The Data At Scale Challenges Mockup PDF
This template illustrates that the high performance computation engine of the analytics software company, the data platform connects to various data sources, automates the data preparation workflow, and scales to big data scenarios. Deliver an awe inspiring pitch with this creative Information Visualizations Playbook How To Overcome Analytics From All The Data At Scale Challenges Mockup PDF bundle. Topics like Purchases, Marketing, Data Pipeline can be discussed with this completely editable template. It is available for immediate download depending on the needs and requirements of the user.
Competitive Intelligence Web Analytics Ppt PowerPoint Presentation Slides Visual Aids Cpb
Presenting this set of slides with name competitive intelligence web analytics ppt powerpoint presentation slides visual aids cpb. The topics discussed in these slides are competitive intelligence web analytics. This is a completely editable PowerPoint presentation and is available for immediate download. Download now and impress your audience.
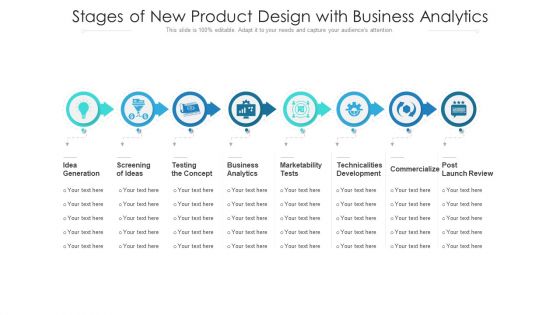
Stages Of New Product Design With Business Analytics Ppt PowerPoint Presentation File Visual Aids PDF
Presenting stages of new product design with business analytics ppt powerpoint presentation file visual aids pdf to dispense important information. This template comprises eight stages. It also presents valuable insights into the topics including idea generation, screening of ideas, testing the concept. This is a completely customizable PowerPoint theme that can be put to use immediately. So, download it and address the topic impactfully.
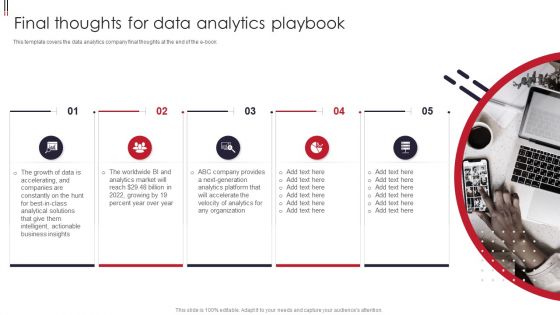
Information Visualizations Playbook Final Thoughts For Data Analytics Playbook Pictures PDF
This template covers the data analytics company final thoughts at the end of the e book. Presenting Information Visualizations Playbook Final Thoughts For Data Analytics Playbook Pictures PDF to provide visual cues and insights. Share and navigate important information on five stages that need your due attention. This template can be used to pitch topics like Organization, Business Insights, Growth. In addtion, this PPT design contains high resolution images, graphics, etc, that are easily editable and available for immediate download.
Information Visualizations Playbook Business Intelligence And Predictive Analytics Challenges Icons PDF
This template covers the problems while implementing BI and predictive analytics in the organization. The challenges are undefined KPIs and metrics, and unable to hire right data science talent. Presenting Information Visualizations Playbook Business Intelligence And Predictive Analytics Challenges Icons PDF to provide visual cues and insights. Share and navigate important information on two stages that need your due attention. This template can be used to pitch topics like Raw Data Organized, Security Vulnerabilities, Perform Analysis. In addtion, this PPT design contains high resolution images, graphics, etc, that are easily editable and available for immediate download.

Healthcare Management Healthcare Management Data Analytics Architecture Ppt File Visuals PDF
This is a healthcare management healthcare management data analytics architecture ppt file visuals pdf template with various stages. Focus and dispense information on two stages using this creative set, that comes with editable features. It contains large content boxes to add your information on topics like line of business, external sources, management, performance improvement, financial management. You can also showcase facts, figures, and other relevant content using this PPT layout. Grab it now.

Web Analytics Trends Ppt PowerPoint Presentation Layouts Visual Aids Cpb Pdf
Presenting this set of slides with name web analytics trends ppt powerpoint presentation layouts visual aids cpb pdf. This is an editable Powerpoint six stages graphic that deals with topics like web analytics trends to help convey your message better graphically. This product is a premium product available for immediate download and is 100 percent editable in Powerpoint. Download this now and use it in your presentations to impress your audience.

Checklist For Effective Data Analytics Integration In Business Resources Ppt Visual Aids PDF
This slide defines the checklist for effective data science integration in business, and it includes an understanding of business requirements, compelling communication, and so on. Presenting checklist for effective data analytics integration in business resources ppt visual aids pdf to provide visual cues and insights. Share and navigate important information on six stages that need your due attention. This template can be used to pitch topics like resources, analysis. In addtion, this PPT design contains high resolution images, graphics, etc, that are easily editable and available for immediate download.

Oracle Cloud Data Analytics Administration IT Oracle Data Visualization Cloud Service DVCS Inspiration PDF
This slide depicts the data visualization service provided by the oracle analytics cloud and how it allows users to experiment with data easily to visualize data from different perspectives. Deliver an awe inspiring pitch with this creative oracle cloud data analytics administration it oracle data visualization cloud service dvcs inspiration pdf bundle. Topics like experiments, representations, sources, visualizations can be discussed with this completely editable template. It is available for immediate download depending on the needs and requirements of the user.
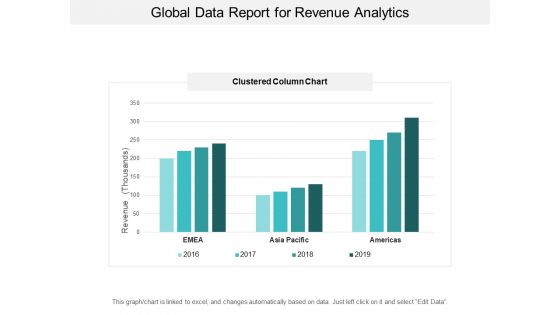
Global Data Report For Revenue Analytics Ppt PowerPoint Presentation Inspiration Visuals
This is a global data report for revenue analytics ppt powerpoint presentation inspiration visuals. This is a four stage process. The stages in this process are financial analysis, quantitative, statistical modelling.
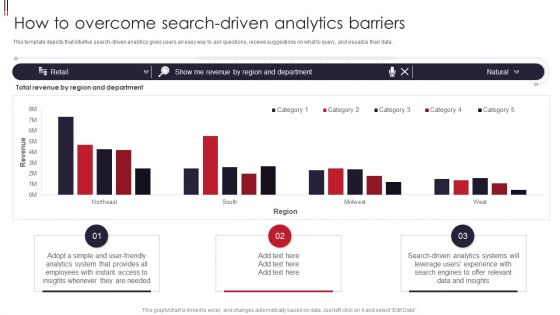
Information Visualizations Playbook How To Overcome Search Driven Analytics Barriers Guidelines PDF
This template depicts that intuitive search-driven analytics gives users an easy way to ask questions, receive suggestions on what to query, and visualize their data. Deliver an awe inspiring pitch with this creative Information Visualizations Playbook How To Overcome Search Driven Analytics Barriers Guidelines PDF bundle. Topics like Analytics System, Data And Insights, Search Driven Analytics can be discussed with this completely editable template. It is available for immediate download depending on the needs and requirements of the user.
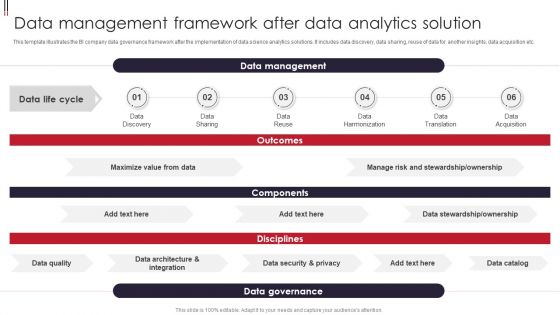
Information Visualizations Playbook Data Management Framework After Data Analytics Solution Formats PDF
Deliver an awe inspiring pitch with this creative Information Visualizations Playbook Data Management Framework After Data Analytics Solution Formats PDF bundle. Topics like Data Discovery, Data Sharing, Data Harmonization can be discussed with this completely editable template. It is available for immediate download depending on the needs and requirements of the user.

Operational Analytics Use Cases Ppt PowerPoint Presentation Professional Visual Aids Cpb Pdf
Presenting this set of slides with name operational analytics use cases ppt powerpoint presentation professional visual aids cpb pdf. This is an editable Powerpoint one stages graphic that deals with topics like operational analytics use cases to help convey your message better graphically. This product is a premium product available for immediate download and is 100 percent editable in Powerpoint. Download this now and use it in your presentations to impress your audience.
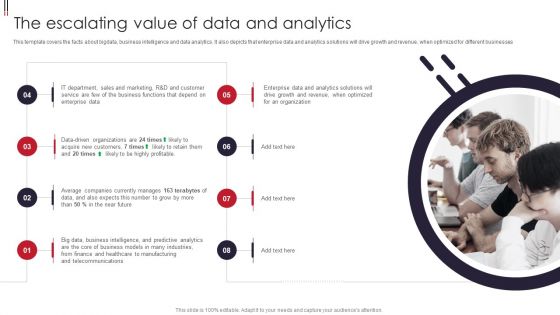
Information Visualizations Playbook The Escalating Value Of Data And Analytics Portrait PDF
This template covers the facts about bigdata, business intelligence and data analytics. It also depicts that enterprise data and analytics solutions will drive growth and revenue, when optimized for different businesses. This is a Information Visualizations Playbook The Escalating Value Of Data And Analytics Portrait PDF template with various stages. Focus and dispense information on eight stages using this creative set, that comes with editable features. It contains large content boxes to add your information on topics like Data Driven Organizations, Acquire New Customers, Profitable. You can also showcase facts, figures, and other relevant content using this PPT layout. Grab it now.
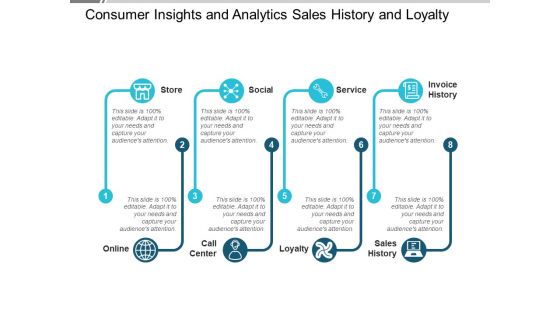
Consumer Insights And Analytics Sales History And Loyalty Ppt PowerPoint Presentation Visual Aids Ideas
This is a consumer insights and analytics sales history and loyalty ppt powerpoint presentation visual aids ideas. This is a eight stage process. The stages in this process are customer experience, customer insight, consumer insight.
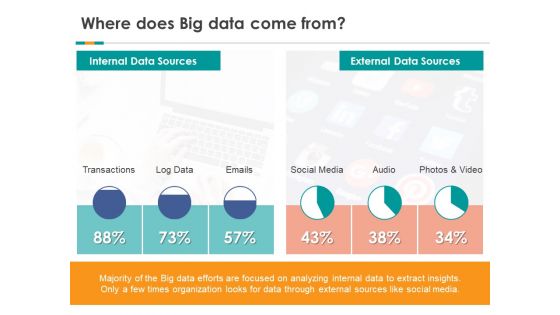
Analytics Where Does Big Data Come From Ppt Visual Aids Styles PDF
Deliver an awe inspiring pitch with this creative analytics where does big data come from ppt visual aids styles pdf bundle. Topics like transactions, log data, social media can be discussed with this completely editable template. It is available for immediate download depending on the needs and requirements of the user.

Data Analytics Tasks And Skills Of Database Administrator Ppt Visual Aids PDF
This slide depicts the tasks performed by a Database Administrator and skills that he should possess, such as backup and recovery, data modeling and design, and distributive computing. Presenting data analytics tasks and skills of database administrator ppt visual aids pdf to provide visual cues and insights. Share and navigate important information on six stages that need your due attention. This template can be used to pitch topics like data security, database systems, distributive computing, information. In addtion, this PPT design contains high resolution images, graphics, etc, that are easily editable and available for immediate download.
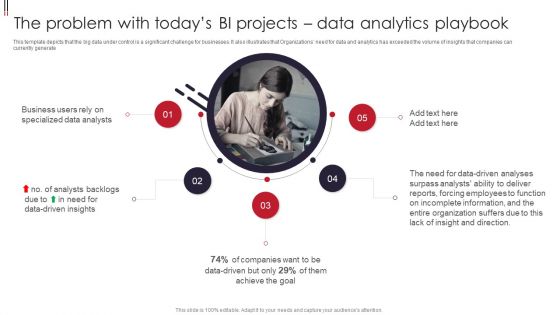
Information Visualizations Playbook The Problem With Todays BI Projects Data Analytics Playbook Portrait PDF
This template depicts that the big data under control is a significant challenge for businesses. It also illustrates that Organizations need for data and analytics has exceeded the volume of insights that companies can currently generate. Presenting Information Visualizations Playbook The Problem With Todays BI Projects Data Analytics Playbook Portrait PDF to provide visual cues and insights. Share and navigate important information on five stages that need your due attention. This template can be used to pitch topics like Business Users, Specialized Data Analysts, Data Driven Insights. In addtion, this PPT design contains high resolution images, graphics, etc, that are easily editable and available for immediate download.
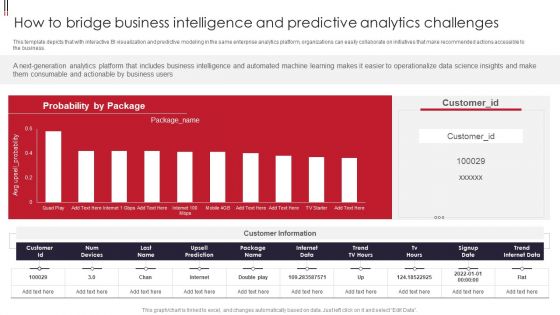
Information Visualizations Playbook How To Bridge Business Intelligence And Predictive Analytics Challenges Themes PDF
This template depicts that with interactive BI visualization and predictive modeling in the same enterprise analytics platform, organizations can easily collaborate on initiatives that make recommended actions accessible to the business. Deliver and pitch your topic in the best possible manner with this Information Visualizations Playbook How To Bridge Business Intelligence And Predictive Analytics Challenges Themes PDF. Use them to share invaluable insights on Business Users, Operationalize Data Science, Num Devices and impress your audience. This template can be altered and modified as per your expectations. So, grab it now.
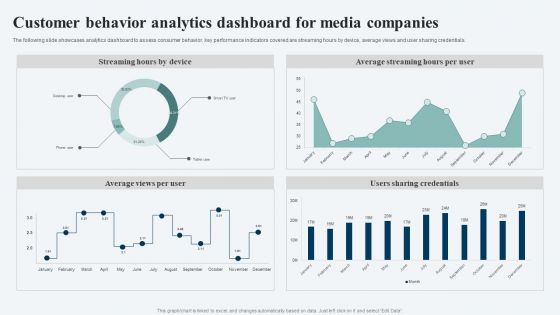
Customer Behavior Analytics Dashboard For Media Companies Ppt Ideas Visuals PDF
The following slide showcases analytics dashboard to assess consumer behavior. key performance indicators covered are streaming hours by device, average views and user sharing credentials. Showcasing this set of slides titled Customer Behavior Analytics Dashboard For Media Companies Ppt Ideas Visuals PDF. The topics addressed in these templates are Streaming Hours Device, Average Streaming Hours, Per User, Users Sharing Credentials. All the content presented in this PPT design is completely editable. Download it and make adjustments in color, background, font etc. as per your unique business setting.

Information Visualizations Playbook How To Fix The Business Intelligence Problem Data Analytics Playbook Guidelines PDF
This template covers the solution for BI problems such as analytics transformation and business intelligence program. It also depicts that switching to next generation analytics platform that gives business users data driven insights. This is a Information Visualizations Playbook How To Fix The Business Intelligence Problem Data Analytics Playbook Guidelines PDF template with various stages. Focus and dispense information on five stages using this creative set, that comes with editable features. It contains large content boxes to add your information on topics like Search Driven Analytics, Bridging Business Intelligence, Predictive Analytics. You can also showcase facts, figures, and other relevant content using this PPT layout. Grab it now.
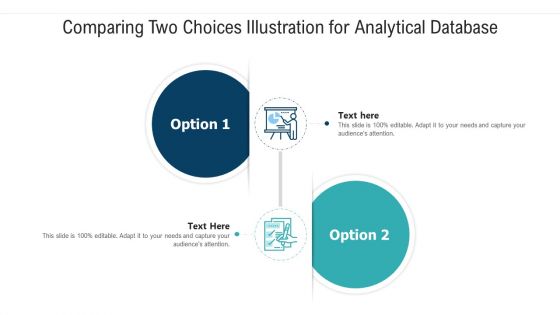
Comparing Two Choices Illustration For Analytical Database Ppt PowerPoint Presentation File Visual Aids PDF
Presenting comparing two choices illustration for analytical database ppt powerpoint presentation file visual aids pdf to dispense important information. This template comprises two stages. It also presents valuable insights into the topics including comparing two choices illustration for analytical database. This is a completely customizable PowerPoint theme that can be put to use immediately. So, download it and address the topic impactfully.
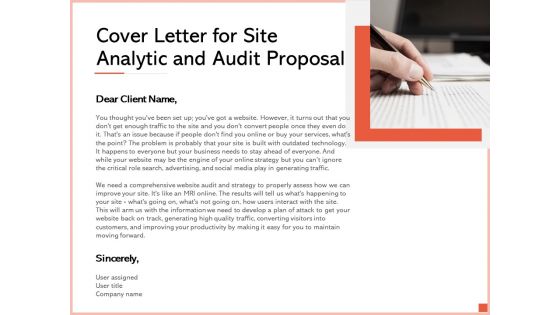
Cover Letter For Site Analytic And Audit Proposal Ppt Slides Visual Aids PDF
Presenting cover letter for site analytic and audit proposal ppt slides visual aids pdf to provide visual cues and insights. Share and navigate important information on one stages that need your due attention. This template can be used to pitch topics like cover letter. In addtion, this PPT design contains high resolution images, graphics, etc, that are easily editable and available for immediate download.

Timeframe For Site Analytic And Audit Proposal Template Ppt Infographic Template Visuals PDF
Deliver an awe inspiring pitch with this creative timeframe for site analytic and audit proposal template ppt infographic template visuals pdf bundle. Topics like discovery or kick off meeting, research and audit, present strategy can be discussed with this completely editable template. It is available for immediate download depending on the needs and requirements of the user.

Business Analytics Dashboard Diagram
This is a business analytics dashboard diagram. This is a one stage process. The stages in this process are analytics, decision, data, business, statistics.
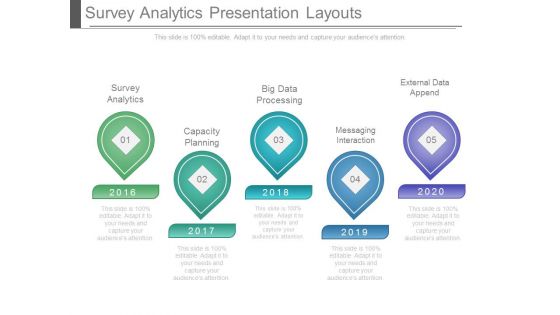
Survey Analytics Presentation Layouts
This is a survey analytics presentation layouts. This is a five stage process. The stages in this process are survey analytics, capacity planning, big data processing, messaging interaction, external data append.

Customer Behavioral Data And Analytics Website Behavior Analytics Elements PDF
Presenting customer behavioral data and analytics website behavior analytics elements pdf to provide visual cues and insights. Share and navigate important information on four stages that need your due attention. This template can be used to pitch topics like customer acquisition channels, website behavior website visits and sources, website behavior products browsed, customer lifecycle statistics. In addtion, this PPT design contains high resolution images, graphics, etc, that are easily editable and available for immediate download.
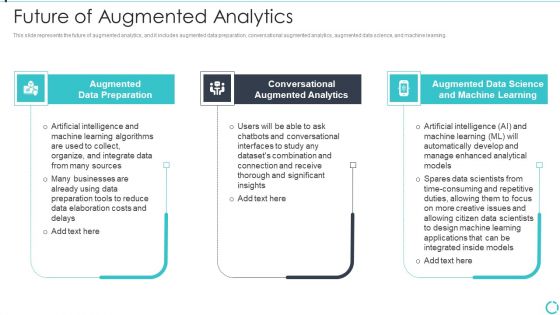
Augmented Analytics Implementation IT Future Of Augmented Analytics Brochure PDF
This slide represents the future of augmented analytics, and it includes augmented data preparation, conversational augmented analytics, augmented data science, and machine learning. Presenting Augmented Analytics Implementation IT Future Of Augmented Analytics Brochure PDF to provide visual cues and insights. Share and navigate important information on three stages that need your due attention. This template can be used to pitch topics like Augmented Data Preparation, Conversational Augmented Analytics, Augmented Data Science, Machine Learning. In addtion, this PPT design contains high resolution images, graphics, etc, that are easily editable and available for immediate download.
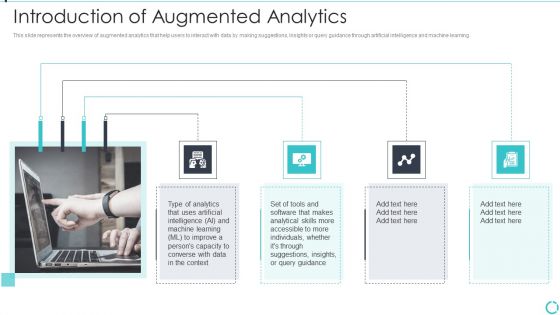
Augmented Analytics Implementation IT Introduction Of Augmented Analytics Portrait PDF
This slide represents the overview of augmented analytics that help users to interact with data by making suggestions, insights or query guidance through artificial intelligence and machine learning. Presenting Augmented Analytics Implementation IT Introduction Of Augmented Analytics Portrait PDF to provide visual cues and insights. Share and navigate important information on four stages that need your due attention. This template can be used to pitch topics like Analytics, Converse Data, Analytical Skills. In addtion, this PPT design contains high resolution images, graphics, etc, that are easily editable and available for immediate download.
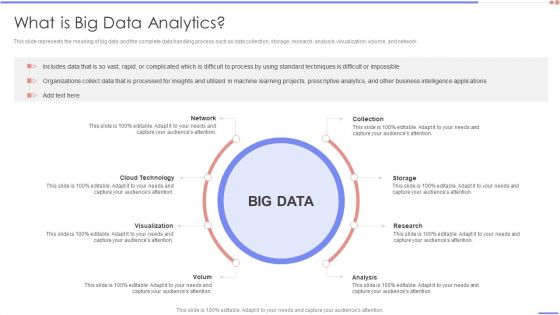
Data Analytics Management What Is Big Data Analytics Slides PDF
This slide represents the meaning of big data and the complete data handling process such as data collection, storage, research, analysis, visualization, volume, and network.This is a Data Analytics Management What Is Big Data Analytics Slides PDF template with various stages. Focus and dispense information on one stage using this creative set, that comes with editable features. It contains large content boxes to add your information on topics like Standard Techniques, Difficult Impossible, Intelligence. You can also showcase facts, figures, and other relevant content using this PPT layout. Grab it now.
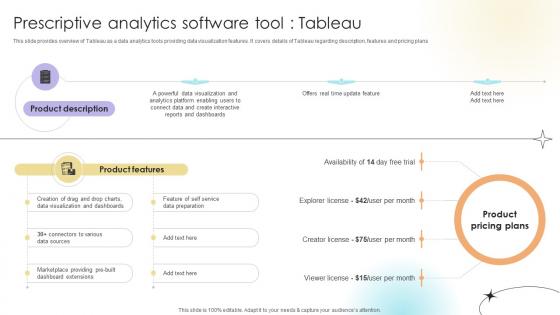
Prescriptive Analytics Software Tool Tableau Data Analytics SS V
This slide provides overview of Tableau as a data analytics tools providing data visualization features. It covers details of Tableau regarding description, features and pricing plans.Retrieve professionally designed Prescriptive Analytics Software Tool Tableau Data Analytics SS V to effectively convey your message and captivate your listeners. Save time by selecting pre-made slideshows that are appropriate for various topics, from business to educational purposes. These themes come in many different styles, from creative to corporate, and all of them are easily adjustable and can be edited quickly. Access them as PowerPoint templates or as Google Slides themes. You do not have to go on a hunt for the perfect presentation because Slidegeeks got you covered from everywhere.

Predictive Analytics Methods Predictive Analytics Model Development Budget Background PDF
This slide describes the budget for developing predictive analytics model by covering details of project cost summary, amount, project details such as company name, project name, project lead, and project start date. The best PPT templates are a great way to save time, energy, and resources. Slidegeeks have 100 percent editable powerpoint slides making them incredibly versatile. With these quality presentation templates, you can create a captivating and memorable presentation by combining visually appealing slides and effectively communicating your message. Download Predictive Analytics Methods Predictive Analytics Model Development Budget Background PDF from Slidegeeks and deliver a wonderful presentation.
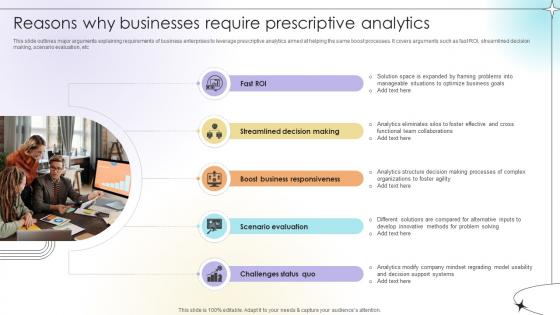
Reasons Why Businesses Require Prescriptive Analytics Data Analytics SS V
This slide outlines major arguments explaining requirements of business enterprises to leverage prescriptive analytics aimed at helping the same boost processes. It covers arguments such as fast ROI, streamlined decision making, scenario evaluation, etc.Here you can discover an assortment of the finest PowerPoint and Google Slides templates. With these templates, you can create presentations for a variety of purposes while simultaneously providing your audience with an eye-catching visual experience. Download Reasons Why Businesses Require Prescriptive Analytics Data Analytics SS V to deliver an impeccable presentation. These templates will make your job of preparing presentations much quicker, yet still, maintain a high level of quality. Slidegeeks has experienced researchers who prepare these templates and write high-quality content for you. Later on, you can personalize the content by editing the Reasons Why Businesses Require Prescriptive Analytics Data Analytics SS V.
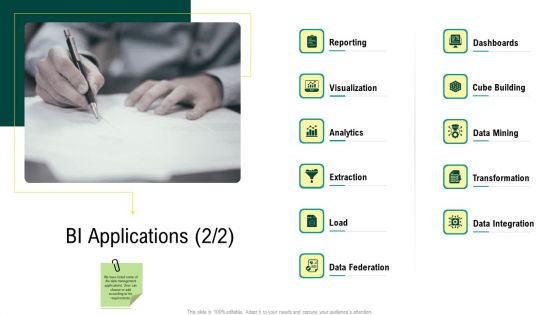
Expert Systems BI Applications Analytics Sample PDF
Presenting expert systems bi applications analytics sample pdf to provide visual cues and insights. Share and navigate important information on elven stages that need your due attention. This template can be used to pitch topics like reporting, visualization, analytics, extraction, data mining, cube building, transformation. In addtion, this PPT design contains high-resolution images, graphics, etc, that are easily editable and available for immediate download.
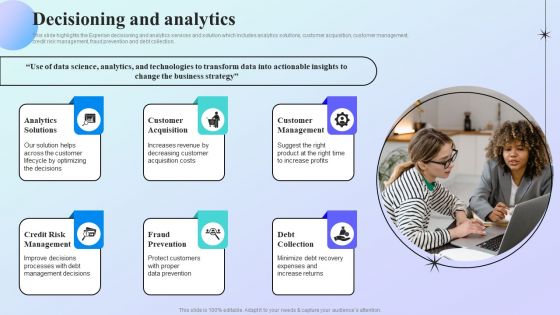
Information Analytics Company Outline Decisioning And Analytics Professional PDF
This slide highlights the Experian decisioning and analytics services and solution which includes analytics solutions, customer acquisition, customer management, credit risk management, fraud prevention and debt collection. There are so many reasons you need a Information Analytics Company Outline Decisioning And Analytics Professional PDF. The first reason is you cannot spend time making everything from scratch, Thus, Slidegeeks has made presentation templates for you too. You can easily download these templates from our website easily.

Predictive Analytics Methods Tools Used For Predictive Analytics Formats PDF
This slide depicts the tools used for predictive analytics to perform operations in predictive models. These tools include SPSS statistics, SAS advanced analytics, SAP predictive analytics, TIBCO Statistica, H2O, and Q research. From laying roadmaps to briefing everything in detail, our templates are perfect for you. You can set the stage with your presentation slides. All you have to do is download these easy to edit and customizable templates. Predictive Analytics Methods Tools Used For Predictive Analytics Formats PDF will help you deliver an outstanding performance that everyone would remember and praise you for. Do download this presentation today.

Predictive Analytics Methods Uses Of Predictive Analytics Underwriting Infographics PDF
This slide represents the application of predictive analytics in underwriting by insurance companies. Predictive analytics help them identify future claims by analyzing policyholders historical data patterns and existing risk collection. Do you have an important presentation coming up Are you looking for something that will make your presentation stand out from the rest Look no further than Predictive Analytics Methods Uses Of Predictive Analytics Underwriting Infographics PDF. With our professional designs, you can trust that your presentation will pop and make delivering it a smooth process. And with Slidegeeks, you can trust that your presentation will be unique and memorable. So why wait Grab Predictive Analytics Methods Uses Of Predictive Analytics Underwriting Infographics PDF today and make your presentation stand out from the rest.

Customer Behavioral Data And Analytics Purchasing Behavior Analytics Brochure PDF
This is a customer behavioral data and analytics purchasing behavior analytics brochure pdf template with various stages. Focus and dispense information on two stages using this creative set, that comes with editable features. It contains large content boxes to add your information on topics like purchasing behavior analytics. You can also showcase facts, figures, and other relevant content using this PPT layout. Grab it now.
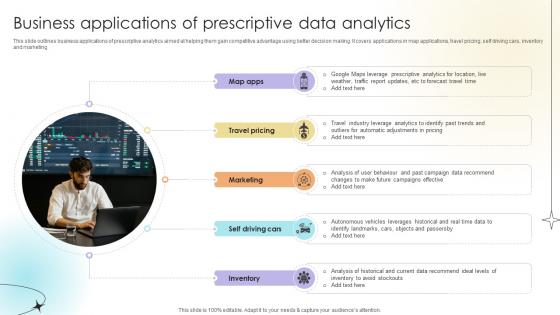
Business Applications Of Prescriptive Data Analytics Data Analytics SS V
This slide outlines business applications of prescriptive analytics aimed at helping them gain competitive advantage using better decision making. It covers applications in map applications, travel pricing, self driving cars, inventory and marketing.The best PPT templates are a great way to save time, energy, and resources. Slidegeeks have 100 percent editable powerpoint slides making them incredibly versatile. With these quality presentation templates, you can create a captivating and memorable presentation by combining visually appealing slides and effectively communicating your message. Download Business Applications Of Prescriptive Data Analytics Data Analytics SS V from Slidegeeks and deliver a wonderful presentation.

Predictive Analytics Methods Why Is Predictive Analytics Important Ideas PDF
This slide depicts the importance of predictive analytics in different industries. It includes the rise of big data, using cutting-edge technologies for big data and machine learning to extract meaningful insights and increasing competition. Whether you have daily or monthly meetings, a brilliant presentation is necessary. Predictive Analytics Methods Why Is Predictive Analytics Important Ideas PDF can be your best option for delivering a presentation. Represent everything in detail using Predictive Analytics Methods Why Is Predictive Analytics Important Ideas PDF and make yourself stand out in meetings. The template is versatile and follows a structure that will cater to your requirements. All the templates prepared by Slidegeeks are easy to download and edit. Our research experts have taken care of the corporate themes as well. So, give it a try and see the results.
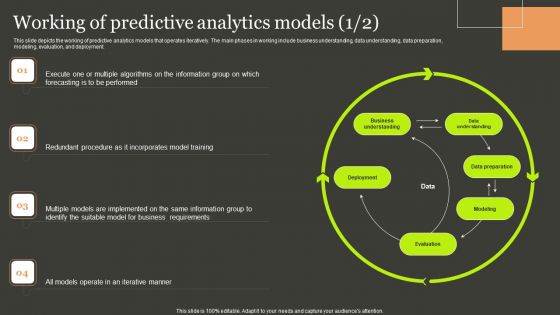
Predictive Analytics Methods Working Of Predictive Analytics Models Summary PDF
This slide depicts the working of predictive analytics models that operates iteratively. The main phases in working include business understanding, data understanding, data preparation, modeling, evaluation, and deployment. Find highly impressive Predictive Analytics Methods Working Of Predictive Analytics Models Summary PDF on Slidegeeks to deliver a meaningful presentation. You can save an ample amount of time using these presentation templates. No need to worry to prepare everything from scratch because Slidegeeks experts have already done a huge research and work for you. You need to download Predictive Analytics Methods Working Of Predictive Analytics Models Summary PDF for your upcoming presentation. All the presentation templates are 100 percent editable and you can change the color and personalize the content accordingly. Download now.
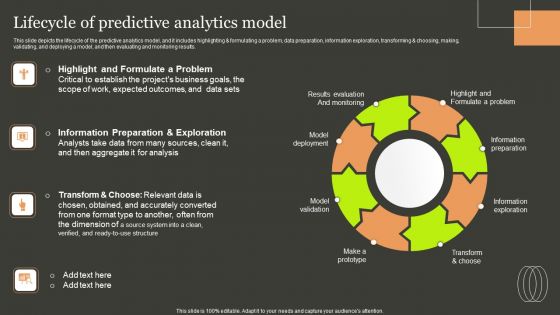
Predictive Analytics Methods Lifecycle Of Predictive Analytics Model Portrait PDF
This slide depicts the lifecycle of the predictive analytics model, and it includes highlighting and formulating a problem, data preparation, information exploration, transforming and choosing, making, validating, and deploying a model, and then evaluating and monitoring results. Crafting an eye catching presentation has never been more straightforward. Let your presentation shine with this tasteful yet straightforward Predictive Analytics Methods Lifecycle Of Predictive Analytics Model Portrait PDF template. It offers a minimalistic and classy look that is great for making a statement. The colors have been employed intelligently to add a bit of playfulness while still remaining professional. Construct the ideal Predictive Analytics Methods Lifecycle Of Predictive Analytics Model Portrait PDF that effortlessly grabs the attention of your audience Begin now and be certain to wow your customers.

Predictive Analytics Methods Predictive Analytics Classification Model Introduction Designs PDF
This slide describes the overview of the classification model used in predictive analytics, including the questions it answers. It also contains algorithms used in this model, such as random forest, gradient boosted model, convolution neural network, bagging, and stacking. Do you have an important presentation coming up Are you looking for something that will make your presentation stand out from the rest Look no further than Predictive Analytics Methods Predictive Analytics Classification Model Introduction Designs PDF. With our professional designs, you can trust that your presentation will pop and make delivering it a smooth process. And with Slidegeeks, you can trust that your presentation will be unique and memorable. So why wait Grab Predictive Analytics Methods Predictive Analytics Classification Model Introduction Designs PDF today and make your presentation stand out from the rest.
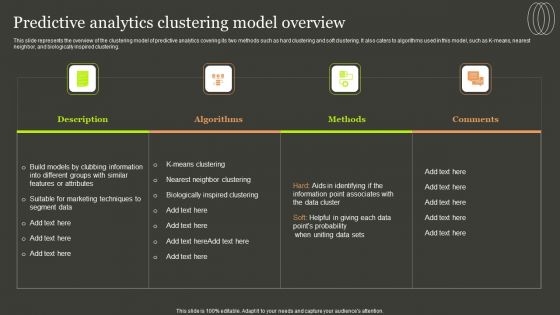
Predictive Analytics Methods Predictive Analytics Clustering Model Overview Template PDF
This slide represents the overview of the clustering model of predictive analytics covering its two methods such as hard clustering and soft clustering. It also caters to algorithms used in this model, such as K-means, nearest neighbor, and biologically inspired clustering. Whether you have daily or monthly meetings, a brilliant presentation is necessary. Predictive Analytics Methods Predictive Analytics Clustering Model Overview Template PDF can be your best option for delivering a presentation. Represent everything in detail using Predictive Analytics Methods Predictive Analytics Clustering Model Overview Template PDF and make yourself stand out in meetings. The template is versatile and follows a structure that will cater to your requirements. All the templates prepared by Slidegeeks are easy to download and edit. Our research experts have taken care of the corporate themes as well. So, give it a try and see the results.
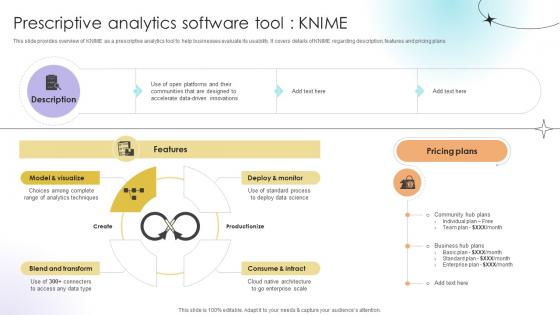
Prescriptive Analytics Software Tool Knime Data Analytics SS V
This slide provides overview of KNIME as a prescriptive analytics tool to help businesses evaluate its usability. It covers details of KNIME regarding description, features and pricing plans.The Prescriptive Analytics Software Tool Knime Data Analytics SS V is a compilation of the most recent design trends as a series of slides. It is suitable for any subject or industry presentation, containing attractive visuals and photo spots for businesses to clearly express their messages. This template contains a variety of slides for the user to input data, such as structures to contrast two elements, bullet points, and slides for written information. Slidegeeks is prepared to create an impression.

Augmented Analytics Implementation IT Workflow Of Augmented Analytics Demonstration PDF
This slide depicts the workflow of augmented analytics, including data preparation and management, automated business intelligence, and augmented DSML. This is a Augmented Analytics Implementation IT Workflow Of Augmented Analytics Demonstration PDF template with various stages. Focus and dispense information on four stages using this creative set, that comes with editable features. It contains large content boxes to add your information on topics like Data Preparation And Management, Automated BI, Augmented Data Science And Machine Learning. You can also showcase facts, figures, and other relevant content using this PPT layout. Grab it now.
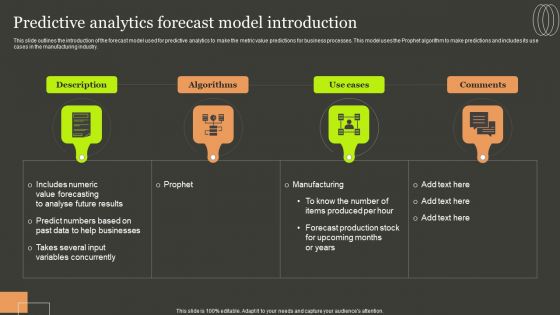
Predictive Analytics Methods Predictive Analytics Forecast Model Introduction Rules PDF
This slide outlines the introduction of the forecast model used for predictive analytics to make the metric value predictions for business processes. This model uses the Prophet algorithm to make predictions and includes its use cases in the manufacturing industry. Make sure to capture your audiences attention in your business displays with our gratis customizable Predictive Analytics Methods Predictive Analytics Forecast Model Introduction Rules PDF. These are great for business strategies, office conferences, capital raising or task suggestions. If you desire to acquire more customers for your tech business and ensure they stay satisfied, create your own sales presentation with these plain slides.

Predictive Analytics Methods Introduction To Predictive Analytics Workflow Slides PDF
This slide represents the predictive analytics workflow that is widely used in managing energy loads in electric grids. It includes accessing and exploring information, pre-processing data, developing predictive models, and integrating analytics with systems. Are you in need of a template that can accommodate all of your creative concepts This one is crafted professionally and can be altered to fit any style. Use it with Google Slides or PowerPoint. Include striking photographs, symbols, depictions, and other visuals. Fill, move around, or remove text boxes as desired. Test out color palettes and font mixtures. Edit and save your work, or work with colleagues. Download Predictive Analytics Methods Introduction To Predictive Analytics Workflow Slides PDF and observe how to make your presentation outstanding. Give an impeccable presentation to your group and make your presentation unforgettable.
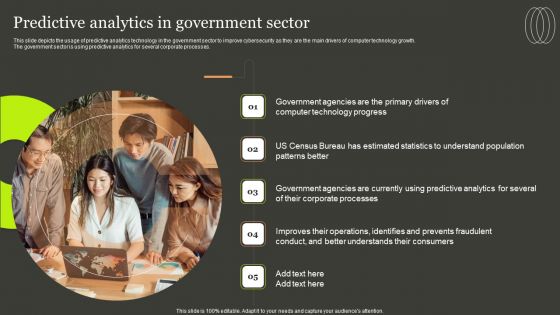
Predictive Analytics Methods Predictive Analytics In Government Sector Information PDF
This slide depicts the usage of predictive analytics technology in the government sector to improve cybersecurity as they are the main drivers of computer technology growth. The government sector is using predictive analytics for several corporate processes. This modern and well arranged Predictive Analytics Methods Predictive Analytics In Government Sector Information PDF provides lots of creative possibilities. It is very simple to customize and edit with the Powerpoint Software. Just drag and drop your pictures into the shapes. All facets of this template can be edited with Powerpoint no extra software is necessary. Add your own material, put your images in the places assigned for them, adjust the colors, and then you can show your slides to the world, with an animated slide included.

Overview Of Prescriptive Analytics Software Tools Data Analytics SS V
This slide provides an overview of software tools used in prescriptive analytics to derive best course of action. It covers the overview of tools as well as name of major tools used.Formulating a presentation can take up a lot of effort and time, so the content and message should always be the primary focus. The visuals of the PowerPoint can enhance the presenters message, so our Overview Of Prescriptive Analytics Software Tools Data Analytics SS V was created to help save time. Instead of worrying about the design, the presenter can concentrate on the message while our designers work on creating the ideal templates for whatever situation is needed. Slidegeeks has experts for everything from amazing designs to valuable content, we have put everything into Overview Of Prescriptive Analytics Software Tools Data Analytics SS V.

Predictive Analytics Methods How Businesses Use Predictive Analytics Background PDF
This slide depicts the importance of predictive analytics that covers detecting fraud, improving operations, optimizing marketing campaigns, and reducing risks. Predictive analytics is being used by businesses to fix complex challenges and identify new possibilities. Do you know about Slidesgeeks Predictive Analytics Methods How Businesses Use Predictive Analytics Background PDF These are perfect for delivering any kind od presentation. Using it, create PowerPoint presentations that communicate your ideas and engage audiences. Save time and effort by using our pre designed presentation templates that are perfect for a wide range of topic. Our vast selection of designs covers a range of styles, from creative to business, and are all highly customizable and easy to edit. Download as a PowerPoint template or use them as Google Slides themes.

Introduction Seo Analytics Major Promotional Analytics Future Trends Background Pdf
This slide covers an overview of search engine optimization analytics. It also includes steps to perform website SEO analytics, such as checking the speed of your website, identifying your key competitors, analyzing best performing pages, performing a competition backlink profile analysis, etc. Coming up with a presentation necessitates that the majority of the effort goes into the content and the message you intend to convey. The visuals of a PowerPoint presentation can only be effective if it supplements and supports the story that is being told. Keeping this in mind our experts created Introduction Seo Analytics Major Promotional Analytics Future Trends Background Pdf to reduce the time that goes into designing the presentation. This way, you can concentrate on the message while our designers take care of providing you with the right template for the situation.

Predictive Analytics Methods Uses Of Predictive Analytics Credit Diagrams PDF
This slide describes the usage of predictive analytics in banking and other financial institutions for credit purposes. It is used to calculate the credit score of a person or organization and to ensure that borrower doesnt fail to return the loan. Slidegeeks is here to make your presentations a breeze with Predictive Analytics Methods Uses Of Predictive Analytics Credit Diagrams PDF With our easy to use and customizable templates, you can focus on delivering your ideas rather than worrying about formatting. With a variety of designs to choose from, you are sure to find one that suits your needs. And with animations and unique photos, illustrations, and fonts, you can make your presentation pop. So whether you are giving a sales pitch or presenting to the board, make sure to check out Slidegeeks first.
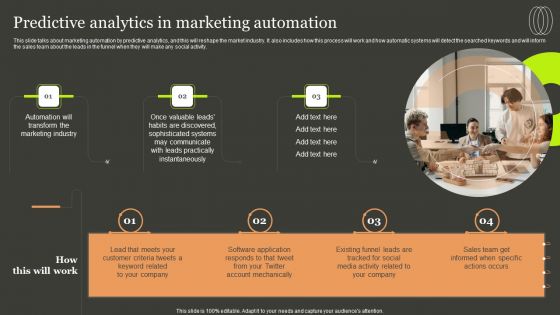
Predictive Analytics Methods Predictive Analytics In Marketing Automation Topics PDF

Predictive Analytics Methods Regression Model For Predictive Analytics Template PDF
This slide represents the regression model of predictive analytics that is most commonly used in statistical analysis. This model is used to identify patterns in large amounts of data and works by calculating a formula. Retrieve professionally designed Predictive Analytics Methods Regression Model For Predictive Analytics Template PDF to effectively convey your message and captivate your listeners. Save time by selecting pre made slideshows that are appropriate for various topics, from business to educational purposes. These themes come in many different styles, from creative to corporate, and all of them are easily adjustable and can be edited quickly. Access them as PowerPoint templates or as Google Slides themes. You do not have to go on a hunt for the perfect presentation because Slidegeeks got you covered from everywhere.
Product Analytics Implementation For Enhanced Business Insights Data Analytics V

Predictive Analytics For Empowering Predictive Analytics Classification Model Information Pdf
This slide describes the overview of the classification model used in predictive analytics, including the questions it answers. It also contains algorithms used in this model, such as random forest, gradient boosted model, convolution neural network, bagging, and stacking. If you are looking for a format to display your unique thoughts, then the professionally designed Predictive Analytics For Empowering Predictive Analytics Classification Model Information Pdf is the one for you. You can use it as a Google Slides template or a PowerPoint template. Incorporate impressive visuals, symbols, images, and other charts. Modify or reorganize the text boxes as you desire. Experiment with shade schemes and font pairings. Alter, share or cooperate with other people on your work. Download Predictive Analytics For Empowering Predictive Analytics Classification Model Information Pdf and find out how to give a successful presentation. Present a perfect display to your team and make your presentation unforgettable.

Implementing Promotional Analytics Major Promotional Analytics Future Trends Rules Pdf
This slide covers various types of marketing channel analytics, such as landing page website, SEO, email, paid search, social media, and blog analytics. Are you in need of a template that can accommodate all of your creative concepts This one is crafted professionally and can be altered to fit any style. Use it with Google Slides or PowerPoint. Include striking photographs, symbols, depictions, and other visuals. Fill, move around, or remove text boxes as desired. Test out color palettes and font mixtures. Edit and save your work, or work with colleagues. Download Implementing Promotional Analytics Major Promotional Analytics Future Trends Rules Pdf and observe how to make your presentation outstanding. Give an impeccable presentation to your group and make your presentation unforgettable.
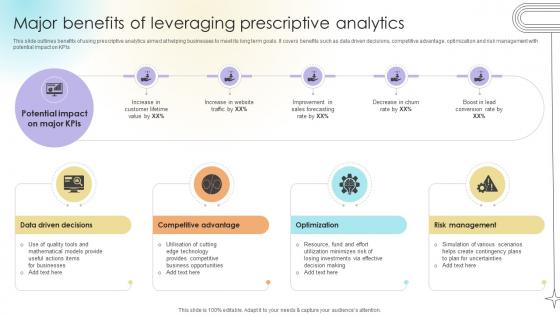
Major Benefits Of Leveraging Prescriptive Analytics Data Analytics SS V
This slide outlines benefits of using prescriptive analytics aimed at helping businesses to meet its long term goals. It covers benefits such as data driven decisions, competitive advantage, optimization and risk management with potential impact on KPIs.Are you in need of a template that can accommodate all of your creative concepts This one is crafted professionally and can be altered to fit any style. Use it with Google Slides or PowerPoint. Include striking photographs, symbols, depictions, and other visuals. Fill, move around, or remove text boxes as desired. Test out color palettes and font mixtures. Edit and save your work, or work with colleagues. Download Major Benefits Of Leveraging Prescriptive Analytics Data Analytics SS V and observe how to make your presentation outstanding. Give an impeccable presentation to your group and make your presentation unforgettable.

Flowchart Explaining Working Of Prescriptive Analytics Data Analytics SS V
This slide provides a flowchart that illustrates working of prescriptive analytics aimed at helping businesses reach recommended actions via what if scenarios. It covers journey of datasets towards actions and decisions via use of machine learning.This Flowchart Explaining Working Of Prescriptive Analytics Data Analytics SS V from Slidegeeks makes it easy to present information on your topic with precision. It provides customization options, so you can make changes to the colors, design, graphics, or any other component to create a unique layout. It is also available for immediate download, so you can begin using it right away. Slidegeeks has done good research to ensure that you have everything you need to make your presentation stand out. Make a name out there for a brilliant performance.
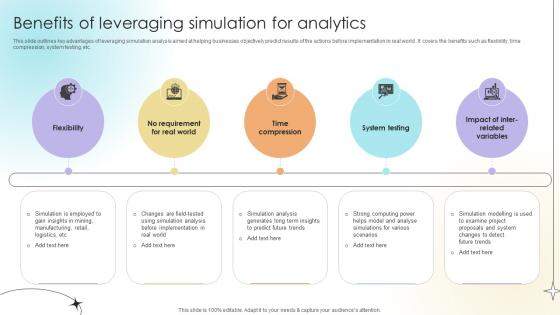
Benefits Of Leveraging Simulation For Analytics Data Analytics SS V
This slide outlines key advantages of leveraging simulation analysis aimed at helping businesses objectively predict results of the actions before implementation in real world . It covers the benefits such as flexibility, time compression, system testing, etc. This modern and well-arranged Benefits Of Leveraging Simulation For Analytics Data Analytics SS V provides lots of creative possibilities. It is very simple to customize and edit with the Powerpoint Software. Just drag and drop your pictures into the shapes. All facets of this template can be edited with Powerpoint, no extra software is necessary. Add your own material, put your images in the places assigned for them, adjust the colors, and then you can show your slides to the world, with an animated slide included.
Half Yearly Business Analytics Roadmap With Data Analytics Icons
Presenting our jaw-dropping half yearly business analytics roadmap with data analytics icons. You can alternate the color, font size, font type, and shapes of this PPT layout according to your strategic process. This PPT presentation is compatible with Google Slides and is available in both standard screen and widescreen aspect ratios. You can also download this well-researched PowerPoint template design in different formats like PDF, JPG, and PNG. So utilize this visually-appealing design by clicking the download button given below.
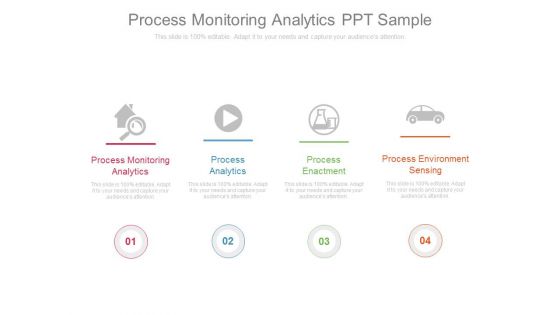
Process Monitoring Analytics Ppt Sample
This is a process monitoring analytics ppt sample. This is a four stage process. The stages in this process are process monitoring analytics, process analytics, process enactment, process environment sensing.

Web Analytics Presentation Powerpoint Templates
This is a web analytics presentation powerpoint templates. This is a four stage process. The stages in this process are measure, report, analyze, optimize, web analytics.

Advertising Analytics Example Of Ppt
This is a advertising analytics example of ppt. This is a three stage process. The stages in this process are media spend, traffic, sales, offline, online.
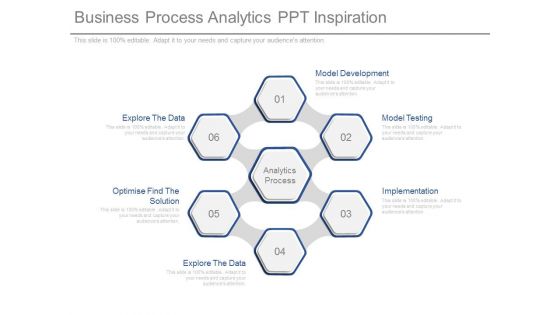
Business Process Analytics Ppt Inspiration
This is a business process analytics ppt inspiration. This is a six stage process. The stages in this process are model development, model testing, implementation, explore the data, optimise find the solution, explore the data, analytics process.
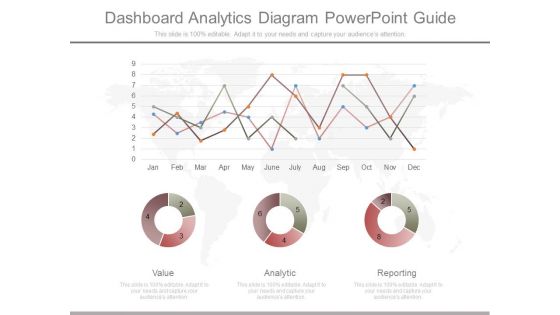
Dashboard Analytics Diagram Powerpoint Guide
This is a dashboard analytics diagram powerpoint guide. This is a three stage process. The stages in this process are value, analytic, reporting.
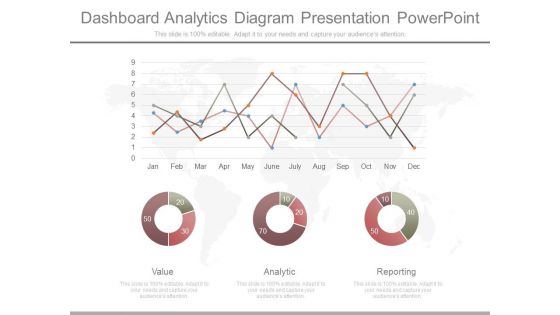
Dashboard Analytics Diagram Presentation Powerpoint
This is a dashboard analytics diagram presentation powerpoint. This is a three stage process. The stages in this process are value, analytic, reporting.
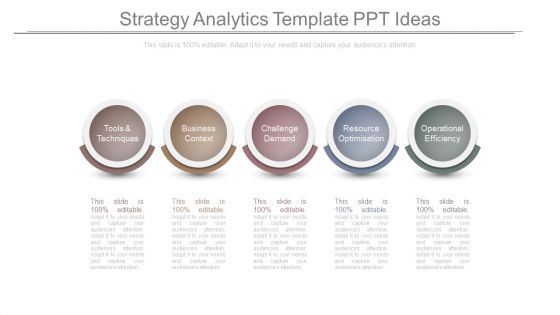
Strategy Analytics Template Ppt Ideas
This is a strategy analytics template ppt ideas. This is a five stage process. The stages in this process are tools and techniques, business context, challenge demand, resource optimisation, operational efficiency.

Market Analytics Template Ppt Summary
This is a market analytics template ppt summary. This is a five stage process. The stages in this process are action plan, research and discovery, strategic planning, implementation, analysis.
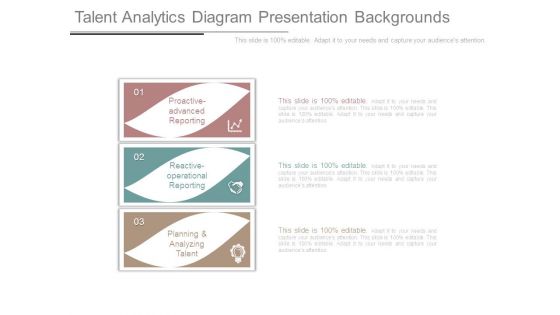
Talent Analytics Diagram Presentation Backgrounds
This is a talent analytics diagram presentation backgrounds. This is a three stage process. The stages in this process are proactive advanced reporting, reactive operational reporting, planning and analyzing talent.
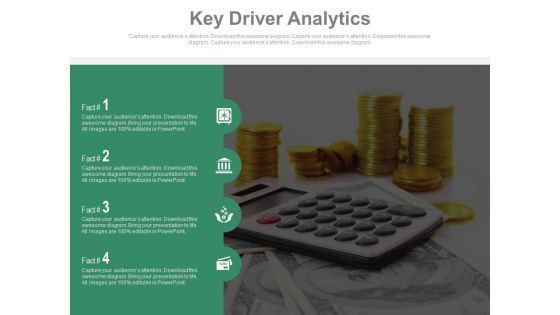
Key Driver Analytics Ppt Slides
This is a key driver analytics ppt slides. This is a four stage process. The stages in this process are business, success, events.

Loyalty Analytics Presentation Powerpoint Templates
This is a loyalty analytics presentation powerpoint templates. This is a four stage process. The stages in this process are customers, sales, social acuity, redemptions.
Working Capital Analytics Template PDF
Presenting Working Capital Analytics Template PDF to dispense important information. This template comprises two stages. It also presents valuable insights into the topics including Working Capital Analytics This is a completely customizable PowerPoint theme that can be put to use immediately. So, download it and address the topic impactfully.

Marketing Predictive Analytics Ppt Example
This is a marketing predictive analytics ppt example. This is a six stage process. The stages in this process are marketing data, explore, transform, model, validate, implement.
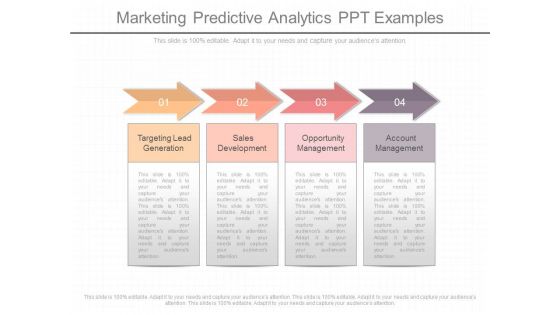
Marketing Predictive Analytics Ppt Examples
This is a marketing predictive analytics ppt examples. This is a four stage process. The stages in this process are targeting lead generation, sales development, opportunity management, account management.

Customer Retention Analytics Presentation Graphics
This is a customer retention analytics presentation graphics. This is a five stage process. The stages in this process are increase customer loyalty, reduce churn, increase share of wallet, meet customer needs, minimize retention costs.
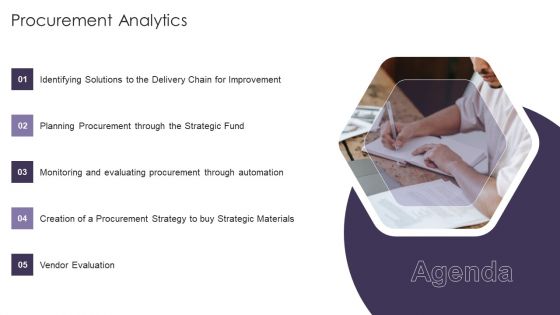
Agenda Procurement Analytics Ideas PDF
This is a Agenda Procurement Analytics Ideas PDF template with various stages. Focus and dispense information on five stages using this creative set, that comes with editable features. It contains large content boxes to add your information on topics like Agenda. You can also showcase facts, figures, and other relevant content using this PPT layout. Grab it now.
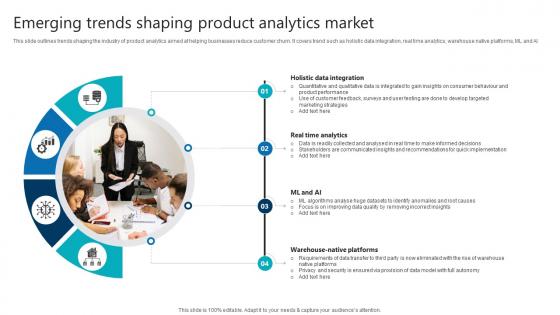
Emerging Trends Shaping Product Analytics Market Product Analytics Implementation Data Analytics V
This slide outlines trends shaping the industry of product analytics aimed at helping businesses reduce customer churn. It covers trend such as holistic data integration, real time analytics, warehouse native platforms, ML and AI Formulating a presentation can take up a lot of effort and time, so the content and message should always be the primary focus. The visuals of the PowerPoint can enhance the presenters message, so our Emerging Trends Shaping Product Analytics Market Product Analytics Implementation Data Analytics V was created to help save time. Instead of worrying about the design, the presenter can concentrate on the message while our designers work on creating the ideal templates for whatever situation is needed. Slidegeeks has experts for everything from amazing designs to valuable content, we have put everything into Emerging Trends Shaping Product Analytics Market Product Analytics Implementation Data Analytics V.
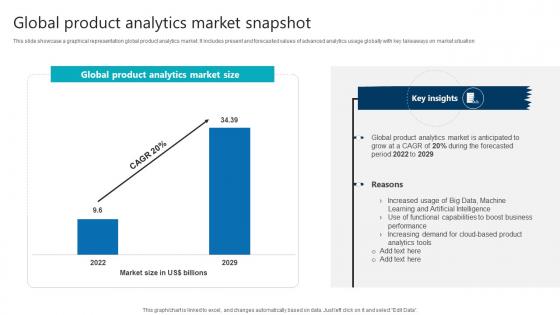
Global Product Analytics Market Snapshot Product Analytics Implementation Data Analytics V
This slide showcase a graphical representation global product analytics market. It includes present and forecasted values of advanced analytics usage globally with key takeaways on market situationComing up with a presentation necessitates that the majority of the effort goes into the content and the message you intend to convey. The visuals of a PowerPoint presentation can only be effective if it supplements and supports the story that is being told. Keeping this in mind our experts created Global Product Analytics Market Snapshot Product Analytics Implementation Data Analytics V to reduce the time that goes into designing the presentation. This way, you can concentrate on the message while our designers take care of providing you with the right template for the situation.
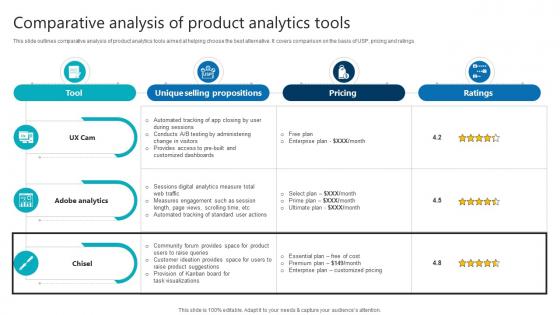
Comparative Analysis Of Product Analytics Tools Product Analytics Implementation Data Analytics V
This slide outlines comparative analysis of product analytics tools aimed at helping choose the best alternative. It covers comparison on the basis of USP, pricing and ratings If your project calls for a presentation, then Slidegeeks is your go-to partner because we have professionally designed, easy-to-edit templates that are perfect for any presentation. After downloading, you can easily edit Comparative Analysis Of Product Analytics Tools Product Analytics Implementation Data Analytics V and make the changes accordingly. You can rearrange slides or fill them with different images. Check out all the handy templates
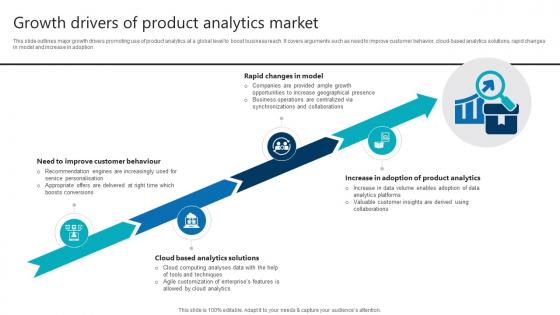
Growth Drivers Of Product Analytics Market Product Analytics Implementation Data Analytics V
This slide outlines major growth drivers promoting use of product analytics at a global level to boost business reach. It covers arguments such as need to improve customer behavior, cloud-based analytics solutions, rapid changes in model and increase in adoption This modern and well-arranged Growth Drivers Of Product Analytics Market Product Analytics Implementation Data Analytics V provides lots of creative possibilities. It is very simple to customize and edit with the Powerpoint Software. Just drag and drop your pictures into the shapes. All facets of this template can be edited with Powerpoint, no extra software is necessary. Add your own material, put your images in the places assigned for them, adjust the colors, and then you can show your slides to the world, with an animated slide included.
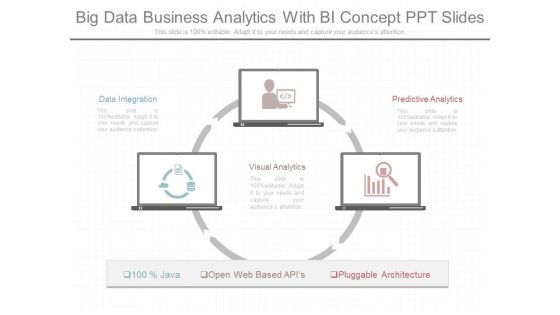
Big Data Business Analytics With Bi Concept Ppt Slides
This is a big data business analytics with bi concept ppt slides. This is a three stage process. The stages in this process are data integration, visual analytics, predictive analytics, open web based apis, pluggable architecture, java.
Expert Systems Advanced Analytics Techniques Icons PDF
Presenting expert systems advanced analytics techniques icons pdf to provide visual cues and insights. Share and navigate important information on three stages that need your due attention. This template can be used to pitch topics like business intelligence, clickstream, analytics, data mining, planning. In addtion, this PPT design contains high-resolution images, graphics, etc, that are easily editable and available for immediate download.
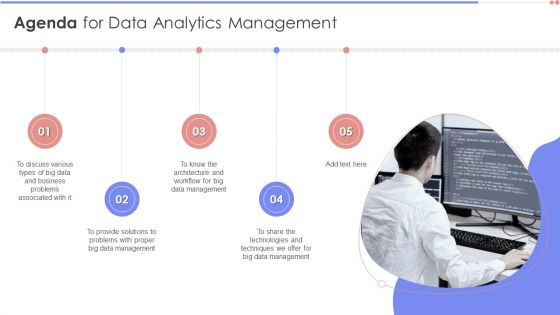
Agenda For Data Analytics Management Diagrams PDF
Presenting Agenda For Data Analytics Management Diagrams PDF to provide visual cues and insights. Share and navigate important information on five stages that need your due attention. This template can be used to pitch topics like Agenda. In addtion, this PPT design contains high resolution images, graphics, etc, that are easily editable and available for immediate download.
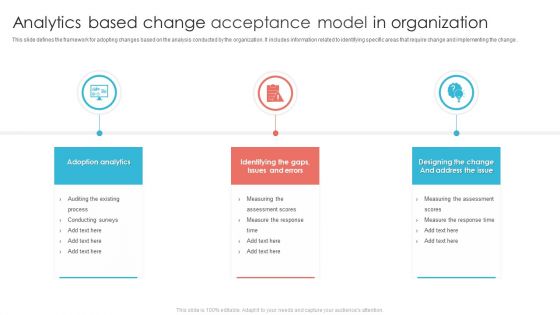
Analytics Based Change Acceptance Model In Organization Ppt PowerPoint Presentation Infographics Visual Aids PDF
This slide defines the framework for adopting changes based on the analysis conducted by the organization. It includes information related to identifying specific areas that require change and implementing the change .Presenting Analytics Based Change Acceptance Model In Organization Ppt PowerPoint Presentation Infographics Visual Aids PDF to dispense important information. This template comprises three stages. It also presents valuable insights into the topics including Adoption Analytics, Designing Change, Measuring Assessment. This is a completely customizable PowerPoint theme that can be put to use immediately. So, download it and address the topic impactfully.

Data Analytics IT Tasks And Skills Of Machine Learning Engineer Ppt Gallery Visual Aids PDF
This slide represents the machine learning engineers tasks and skills, including a deep knowledge of machine learning, ML algorithms, and Python and C. This is a data analytics it tasks and skills of machine learning engineer ppt gallery visual aids pdf template with various stages. Focus and dispense information on six stages using this creative set, that comes with editable features. It contains large content boxes to add your information on topics like knowledge of machine learning, python, c plus, ml algorithms. You can also showcase facts, figures, and other relevant content using this PPT layout. Grab it now.
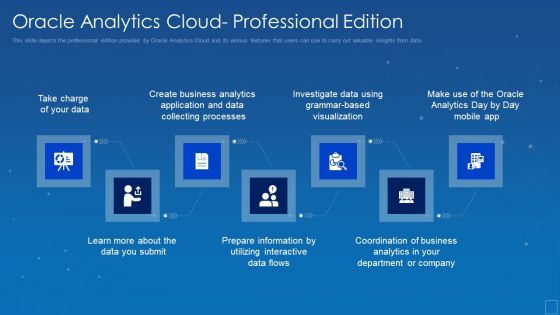
Oracle Analytics Cloud Professional Edition Graphics PDF
This slide defines the collaboration and publishing cloud solution of Oracle Analytics and how it encourages teamwork in the organizations. Presenting oracle analytics cloud professional edition graphics pdf to provide visual cues and insights. Share and navigate important information on seven stages that need your due attention. This template can be used to pitch topics like oracle analytics cloud solutions collaboration and publishing. In addtion, this PPT design contains high resolution images, graphics, etc, that are easily editable and available for immediate download.
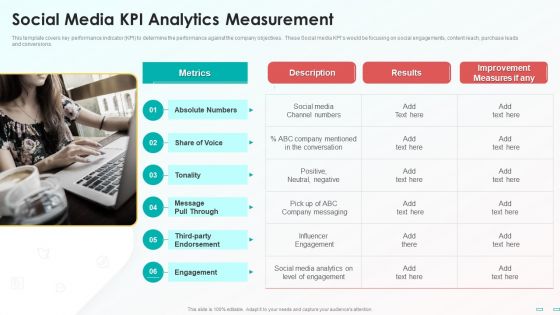
Social Media Kpi Analytics Measurement Demonstration PDF
This template covers key performance indicator KPI to determine the performance against the company objectives. These Social media KPIs would be focusing on social engagements, content reach, purchase leads and conversions. Presenting Social Media Kpi Analytics Measurement Demonstration PDF to provide visual cues and insights. Share and navigate important information on one stages that need your due attention. This template can be used to pitch topics like Metrics, Social Media, Improvement Measures. In addtion, this PPT design contains high resolution images, graphics, etc, that are easily editable and available for immediate download.
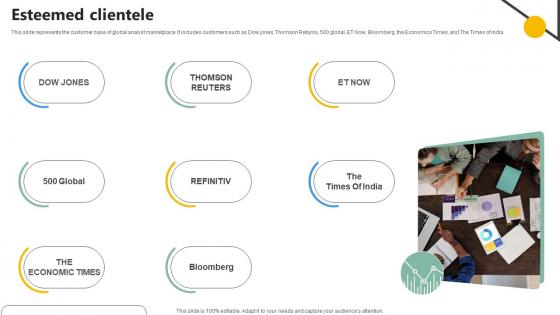
Esteemed Clientele Analytics Company Investor Funding Elevator
This slide represents the customer base of global analyst marketplace. It includes customers such as Dow jones, Thomson Returns, 500 global, ET Now, Bloomberg, the Economics Times, and The Times of India.The best PPT templates are a great way to save time, energy, and resources. Slidegeeks have 100 percent editable powerpoint slides making them incredibly versatile. With these quality presentation templates, you can create a captivating and memorable presentation by combining visually appealing slides and effectively communicating your message. Download Esteemed Clientele Analytics Company Investor Funding Elevator from Slidegeeks and deliver a wonderful presentation.

Big Data Analytics Framework Layers Formats PDF
This slide illustrate four different layer of big data pipeline architecture to support activities related to data management. It includes layers such as data ingestion, processing, storage and visualization Persuade your audience using this Benefits Of Big Data And Analytics Framework For Organization Development Guidelines PDF. This PPT design covers four stages, thus making it a great tool to use. It also caters to a variety of topics including Data Ingestion, Data Processing, Data Storage. Download this PPT design now to present a convincing pitch that not only emphasizes the topic but also showcases your presentation skills.

Data Service Analytics Diagram Ppt Inspiration
This is a data service analytics diagram ppt inspiration. This is a eight stage process. The stages in this process are traffic demand estimation, policy control analytics, data processing, device analytics, service quality analytics, charging verification, productivity, statistical research.
Customer Analytics Ppt PowerPoint Presentation Information
This is a customer analytics ppt powerpoint presentation information. This is a four stage process. The stages in this process are customer analytics.

Analytics Solutions Diagram Sample Of Ppt Presentation
This is a analytics solutions diagram sample of ppt presentation. This is a four stage process. The stages in this process are analytic applications, analytics, data sources, business intelligence.

Analytics Insights Planning Template Ppt Slides
This is a analytics insights planning template ppt slides. This is a nine stage process. The stages in this process are buy, explore, discover, public relations, advertising, customer analytics, customer communication, customer experiences, marketing, analytics insights planning.
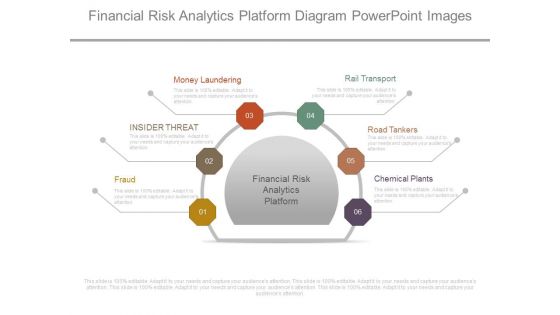
Financial Risk Analytics Platform Diagram Powerpoint Images
This is a financial risk analytics platform diagram powerpoint images. This is a six stage process. The stages in this process are money laundering, insider threat, fraud, rail transport, road tankers, chemical plants, financial risk analytics platform.
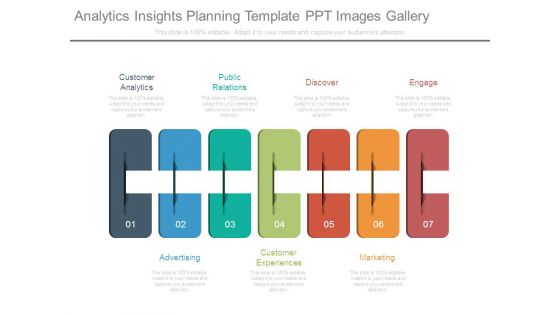
Analytics Insights Planning Template Ppt Images Gallery
This is a analytics insights planning template ppt images gallery. This is a seven stage process. The stages in this process are customer analytics, public relations, discover, engage, marketing, customer experiences, advertising.

Analytics Maturity Ppt Powerpoint Slide Background Designs
This is a analytics maturity ppt powerpoint slide background designs. This is a four stage process. The stages in this process are competitive advantage, analytics maturity, sense and respond, predict and analysis.
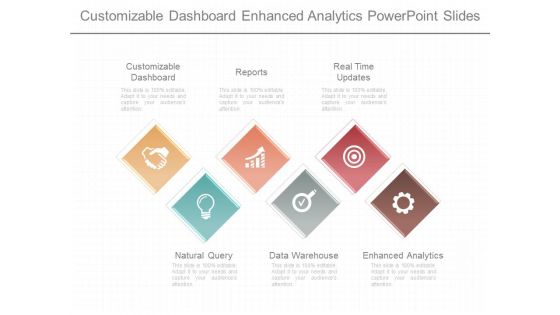
Customizable Dashboard Enhanced Analytics Powerpoint Slides
This is a customizable dashboard enhanced analytics powerpoint slides. This is a six stage process. The stages in this process are customizable dashboard, reports, real time updates, natural query, data warehouse, enhanced analytics.

Data Modeling And Analytics Example Ppt Presentation
This is a data modeling and analytics example ppt presentation. This is a four stage process. The stages in this process are data modeling, data migration, balance data, explore data, data modeling and analytics.

Analytics Support Powerpoint Slide Background Designs
This is a analytics support powerpoint slide background designs. This is a three stage process. The stages in this process are supplemental plans, benefit coding, analytics support.

Business Environment Video Analytics Diagram Powerpoint Ideas
This is a business environment video analytics diagram powerpoint ideas. This is a four stage process. The stages in this process are camera, nvr, analytic server, remote client.

Centralized Data Analytics Team Structure Clipart PDF
This slide shows the model representing the structure of the centralized data analytics team. It includes key stakeholders such as vice president, centralized data analytics team, and analysts of units A,B and C.Persuade your audience using this Centralized Data Analytics Team Structure Clipart PDF. This PPT design coversone stage, thus making it a great tool to use. It also caters to a variety of topics including Vice President, Data Analytics, Analytics Team. Download this PPT design now to present a convincing pitch that not only emphasizes the topic but also showcases your presentation skills.

Process Of Retail Site Analytics Ppt Model
This is a process of retail site analytics ppt model. This is a four stage process. The stages in this process are visualization, customer info, salesperson, shopper.
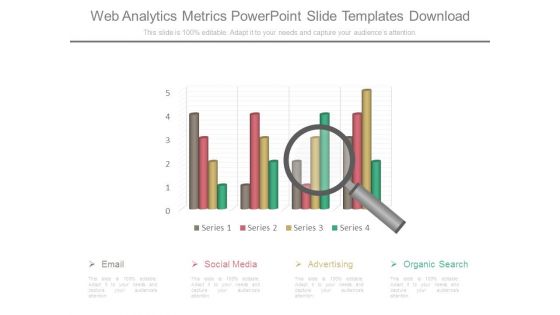
Web Analytics Metrics Powerpoint Slide Templates Download
This is a web analytics metrics powerpoint slide templates download. This is a one stage process. The stages in this process are email, social media, advertising, organic search.

Organization Production Analytics Diagram Powerpoint Images
This is a organization production analytics diagram powerpoint images. This is a four stage process. The stages in this process are brand definition, creative platform, communication strategy, activation.

Marketing Analytics Powerpoint Slide Background Designs
This is a marketing analytics powerpoint slide background designs. This is a four stage process. The stages in this process are email marketing, social media marketing.

Pricing Analytics Diagram Sample Of Ppt Presentation
This is a pricing analytics diagram sample of ppt presentation. This is a three stage process. The stages in this process are internet marketing, marketing plans, seo.
Cloud Analytics Strategy Sample Diagram Powerpoint Guide
This is a cloud analytics strategy sample diagram powerpoint guide. This is a one stage process. The stages in this process are business, marketing, thought, presentation, strategy.
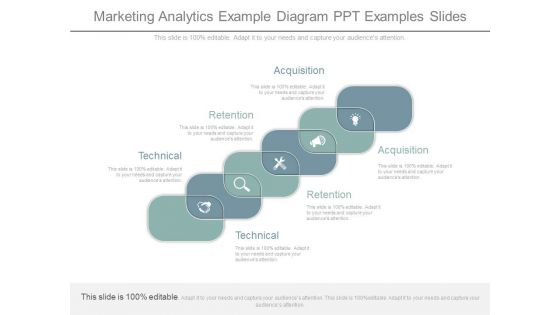
Marketing Analytics Example Diagram Ppt Examples Slides
This is a marketing analytics example diagram ppt examples slides. This is a six stage process. The stages in this process are acquisition, retention, technical.
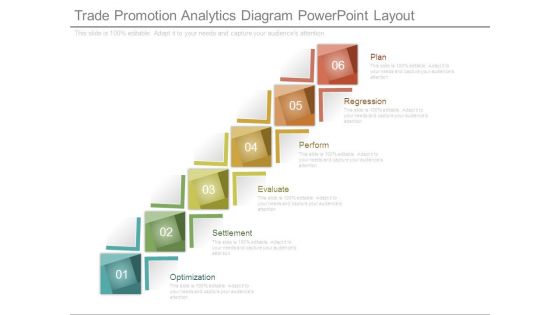
Trade Promotion Analytics Diagram Powerpoint Layout
This is a trade promotion analytics diagram powerpoint layout. This is a six stage process. The stages in this process are plan, regression, perform, evaluate, settlement, optimization.
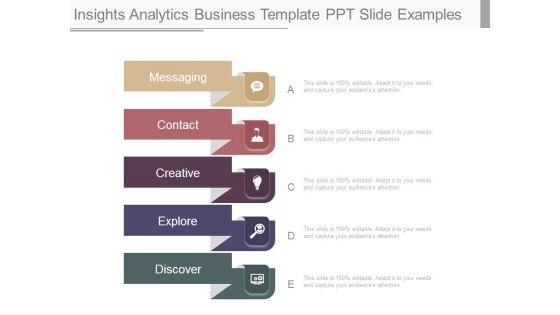
Insights Analytics Business Template Ppt Slide Examples
This is a insights analytics business template ppt slide examples. This is a five stage process. The stages in this process are messaging, contact, creative, explore, discover.

Marketing Analytics Technology Template Ppt Sample Download
This is a marketing analytics technology template ppt sample download. This is a six stage process. The stages in this process are strategy, technology, traffic, marketing, volume, shares.
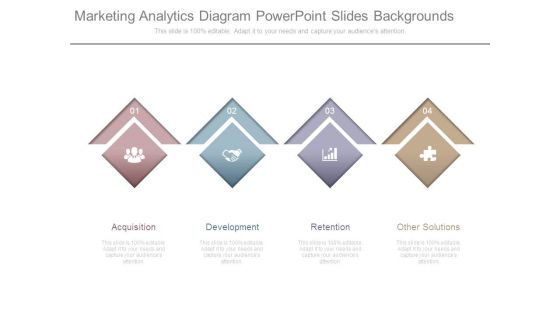
Marketing Analytics Diagram Powerpoint Slides Backgrounds
This is a marketing analytics diagram powerpoint slides backgrounds. This is a four stage process. The stages in this process are acquisition, development, retention, other solutions.

Strategy Analytics Ppt Layout Powerpoint Slide
This is a strategy analytics ppt layout powerpoint slide. This is a four stage process. The stages in this process are team, data, processes, data analysis.
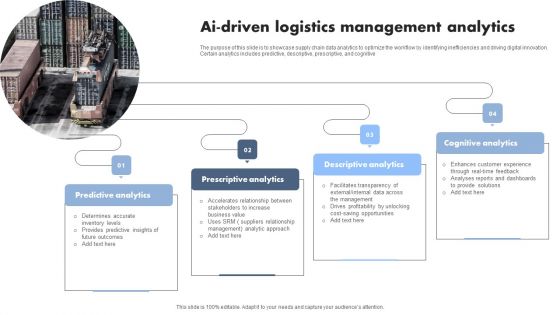
AI Driven Logistics Management Analytics Professional PDF
The purpose of this slide is to showcase supply chain data analytics to optimize the workflow by identifying inefficiencies and driving digital innovation. Certain analytics includes predictive, descriptive, prescriptive, and cognitive. Presenting AI Driven Logistics Management Analytics Professional PDF to dispense important information. This template comprises four stages. It also presents valuable insights into the topics including Predictive Analytics, Prescriptive Analytics, Descriptive Analytics. This is a completely customizable PowerPoint theme that can be put to use immediately. So, download it and address the topic impactfully.
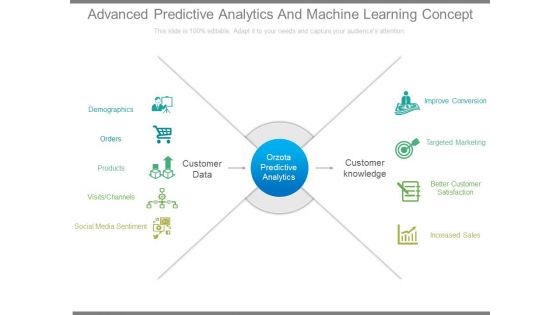
Advanced Predictive Analytics And Machine Learning Concept
This is a advanced predictive analytics and machine learning concept. This is a nine stage process. The stages in this process are demographics, orders, products, visits channels, social media sentiment, customer data, orzota predictive analytics, customer knowledge, improve conversion, targeted marketing, better customer satisfaction, increased sales.

Analytics Solutions Sample Of Ppt Presentation
This is a analytics solutions sample of ppt presentation. This is a eight stage process. The stages in this process are information sources, analytics solutions, system infrastructure, social network, big data, data discovery, data analysis, reports and dashboards.
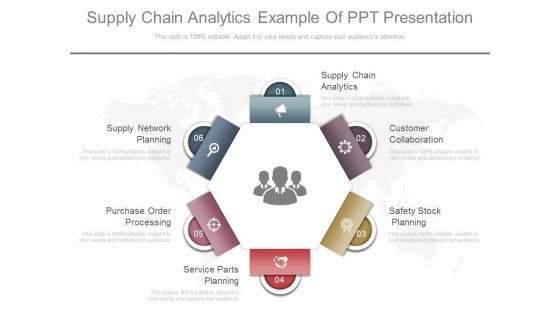
Supply Chain Analytics Example Of Ppt Presentation
This is a supply chain analytics example of ppt presentation. This is a six stage process. The stages in this process are supply chain analytics, customer collaboration, safety stock planning, purchase order processing, supply network planning, safety stock planning.

Unified Customer Experience Analytics Ppt Design
This is a unified customer experience analytics ppt design. This is a four stage process. The stages in this process are cross channel customer experience, unified customer experience analytics, sales, performance, key business result area.

Business Analytics Lab Example Of Ppt
This is a business analytics lab example of ppt. This is a four stage process. The stages in this process are managerial and organizational economics, business analytics, sustainable, interdisciplinary management factory.
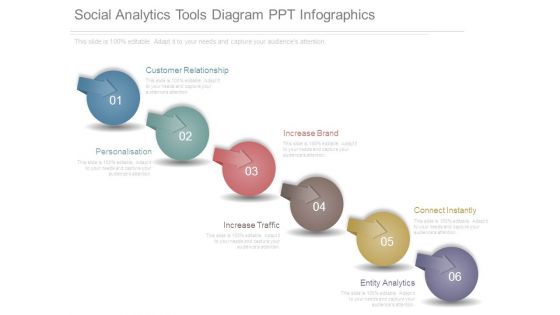
Social Analytics Tools Diagram Ppt Infographics
This is a social analytics tools diagram ppt infographics. This is a six stage process. The stages in this process are customer relationship, personalisation, increase brand, increase traffic, connect instantly, entity analytics.

Marketing Analytics Example Diagram Ppt Inspiration
This is a marketing analytics example diagram ppt inspiration. This is a six stage process. The stages in this process are marketing analytics, development, analysis, strategy, acquisition, retention, other solutions.

Analytics Strategy For Organizational Goals Clipart PDF
Presenting analytics strategy for organizational goals clipart pdf. to dispense important information. This template comprises six stages. It also presents valuable insights into the topics including business context, organization, analytics platform, analytics goals. This is a completely customizable PowerPoint theme that can be put to use immediately. So, download it and address the topic impactfully.
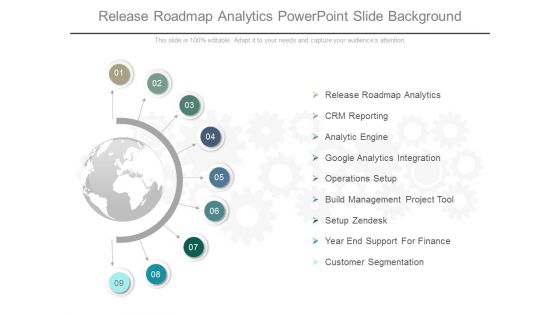
Release Roadmap Analytics Powerpoint Slide Background
This is a release roadmap analytics powerpoint slide background. This is a nine stage process. The stages in this process are release roadmap analytics, crm reporting, analytic engine, google analytics integration, operations setup, build management project tool, setup zendesk, year end support for finance, customer segmentation.
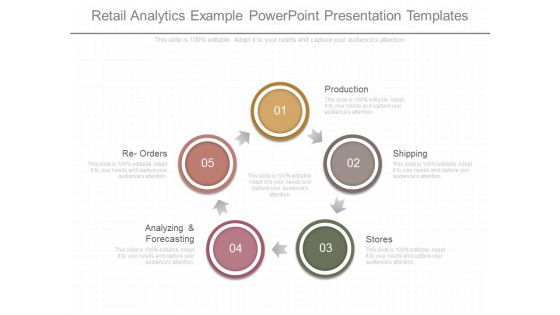
Retail Analytics Example Powerpoint Presentation Templates
This is a retail analytics example powerpoint presentation templates. This is a five stage process. The stages in this process are production, shipping, stores, analyzing and forecasting, re orders.

Social Media Management Analytics Dashboards Powerpoint Slides
This is a social media management analytics dashboards powerpoint slides. This is a four stage process. The stages in this process are reach and engagement, audience profile, traffic, audience size, sentiment analysis, content analysis, competitive benchmarking, community responsiveness.\n\n\n\n\n\n

Event Marketing Analytics Example Powerpoint Shapes
This is a event marketing analytics example powerpoint shapes. This is a seven stage process. The stages in this process are growing fans, engaging users, going viral, driving roi, advertising, promotions, cross functional.

Sample Of Internet Analytics Template Powerpoint Themes
This is a sample of internet analytics template powerpoint themes. This is a six stage process. The stages in this process are improve or eliminate, analyze, action, define, measure, reinforce clarity.

Sales Analytics Business Template Ppt Design
This is a sales analytics business template ppt design. This is a six stage process. The stages in this process are identify customer, create brand identify, develop pricing strategy, relate to customers, case management, assurance.

Customer Experience Analytics Example Ppt Infographic Template
This is a customer experience analytics example ppt infographic template. This is a six stage process. The stages in this process are resource fluidity, measurement, priorities, process, leadership edge, enterprise culture.
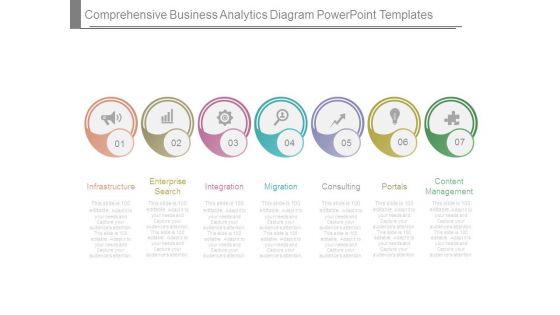
Comprehensive Business Analytics Diagram Powerpoint Templates
This is a comprehensive business analytics diagram powerpoint templates. This is a seven stage process. The stages in this process are infrastructure, enterprise search, integration, migration, consulting, portals, content management.
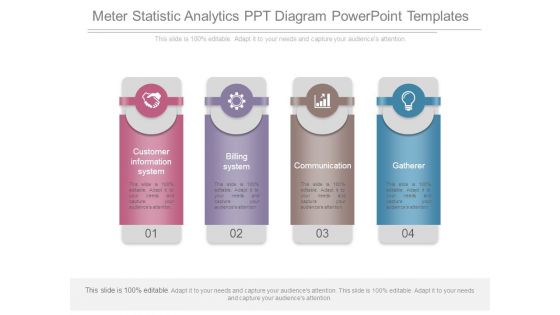
Meter Statistic Analytics Ppt Diagram Powerpoint Templates
This is a meter statistic analytics ppt diagram powerpoint templates. This is a four stage process. The stages in this process are customer information system, billing system, communication, gatherer.
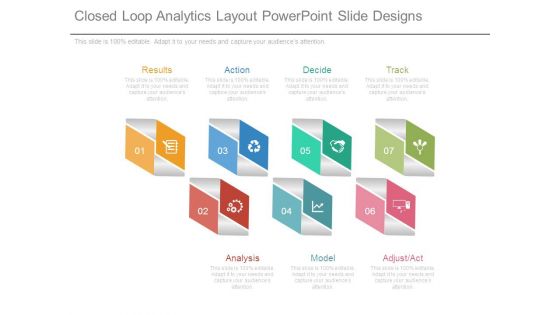
Closed Loop Analytics Layout Powerpoint Slide Designs
This is a closed loop analytics layout powerpoint slide designs. This is a seven stage process. The stages in this process are results, action, decide, track, analysis, model, adjust act.

Marketing Analytics Ppt Template Powerpoint Slide Introduction
This is a marketing analytics ppt template powerpoint slide introduction. This is a six stage process. The stages in this process are reporting intelligence, acquisition, development, pricing strategy, product design, other solution.

Marketing Analytics Technology Template Ppt Sample File
This is a marketing analytics technology template ppt sample file. This is a five stage process. The stages in this process are profile, associate, product design, marketing roi, predict.
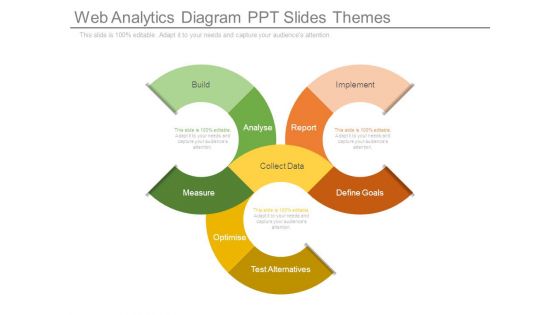
Web Analytics Diagram Ppt Slides Themes
This is a web analytics diagram ppt slides themes. This is a three stage process. The stages in this process are build, analyse, measure, test alternatives, optimise, collect data, define goals, report, implement.
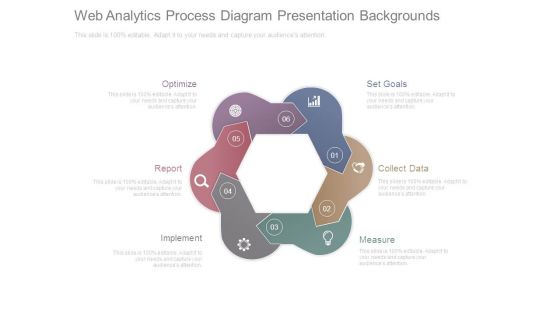
Web Analytics Process Diagram Presentation Backgrounds
This is a web analytics process diagram presentation backgrounds. This is a six stage process. The stages in this process are optimize, report, implement, measure, collect data, set goals.
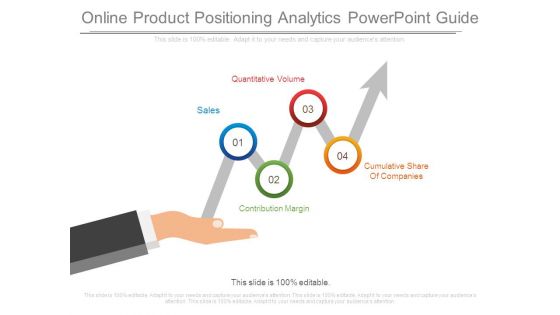
Online Product Positioning Analytics Powerpoint Guide
This is a online product positioning analytics powerpoint guide. This is a four stage process. The stages in this process are sales, quantitative volume, contribution margin, cumulative share of companies.

Effective Marketing Analytics Layout Ppt Slide Design
This is a effective marketing analytics layout ppt slide design. This is a three stage process. The stages in this process are checks and balances, fundamental analysis, trend analysis.

Mapping Analytics Template Ppt Examples Professional
This is a mapping analytics template ppt examples professional. This is a four stage process. The stages in this process are omni channel distribution and fulfillment, sourcing and supplier collaboration, planning and execution, retail execution.
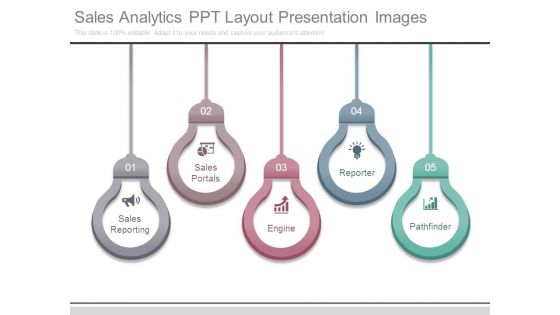
Sales Analytics Ppt Layout Presentation Images
This is a sales analytics ppt layout presentation images. This is a five stage process. The stages in this process are sales reporting, sales portals, engine, reporter, pathfinder.

 Home
Home