Visual Analytics

Iot And Data Analytics Applications For In Agricultural Industry Value Chain Ppt Icon Shapes PDF
This slide covers applications for internet of things and predictive data analytics to improve quality of farming techniques and value chain. It includes elements such as technologies used comprising of big data, IOT, cloud computing, GPS system, remote sensing , etc. along with information required. Pitch your topic with ease and precision using this Iot And Data Analytics Applications For In Agricultural Industry Value Chain Ppt Icon Shapes PDF. This layout presents information on Technologies, Big Data Analytics, Cloud Computing. It is also available for immediate download and adjustment. So, changes can be made in the color, design, graphics or any other component to create a unique layout.

Big Latest Facts About Data Analytics In Manufacturing Industry Infographics PDF
This slide covers big data analytics and trends in manufacturing industry. It involves details such as expected market size, key drivers and impact on market. Pitch your topic with ease and precision using this Big Latest Facts About Data Analytics In Manufacturing Industry Infographics PDF. This layout presents information on Big Latest Facts, About Data Analytics, Manufacturing Industry. It is also available for immediate download and adjustment. So, changes can be made in the color, design, graphics or any other component to create a unique layout.

Famous Technology Trends Charts With Multichannel Analytics Ppt PowerPoint Presentation Ideas Graphics Tutorials PDF
Pitch your topic with ease and precision using this famous technology trends charts with multichannel analytics ppt powerpoint presentation ideas graphics tutorials pdf. This layout presents information on multichannel analytics, content marketing, paid media, social media marketing, email marketing . It is also available for immediate download and adjustment. So, changes can be made in the color, design, graphics or any other component to create a unique layout.

Business Diagram Technology Predictive Data Analytics Networking Social Icons Ppt Slide
This technology diagram slide has been designed with graphic of data icons. These icons may be used to displays the data analytics and social media networking. Use this PPT slide for networking and technology related presentations.

Data Evaluation And Processing Toolkit Data Analytics Change Management Gantt Chart Elements PDF
The slide shows the timeline for assessing and implementing the change in data analytics project. If your project calls for a presentation, then Slidegeeks is your go-to partner because we have professionally designed, easy-to-edit templates that are perfect for any presentation. After downloading, you can easily edit Data Evaluation And Processing Toolkit Data Analytics Change Management Gantt Chart Elements PDF and make the changes accordingly. You can rearrange slides or fill them with different images. Check out all the handy templates.

Table Of Contents For Guide For Marketing Analytics To Improve Decisions Demonstration PDF
If your project calls for a presentation, then Slidegeeks is your go to partner because we have professionally designed, easy to edit templates that are perfect for any presentation. After downloading, you can easily edit XXXXXXXXXXXXXXXXXXXXXXXXXXXXXXXXXXXXXXXXXXXXXXX and make the changes accordingly. You can rearrange slides or fill them with different images. Check out all the handy templates
HR Services Icon With Analytics Technology And Charts Ppt PowerPoint Presentation Inspiration Format Ideas PDF
Pitch your topic with ease and precision using this hr services icon with analytics technology and charts ppt powerpoint presentation inspiration format ideas pdf. This layout presents information on hr services icon with analytics technology and charts. It is also available for immediate download and adjustment. So, changes can be made in the color, design, graphics or any other component to create a unique layout.
Icon For Customer Relation Management Lifecycle Process Data Analytics In CRM Portrait PDF
Pitch your topic with ease and precision using this Icon For Customer Relation Management Lifecycle Process Data Analytics In CRM Portrait PDF. This layout presents information on Icon For Customer Relation Management Lifecycle Process Data Analytics In CRM. It is also available for immediate download and adjustment. So, changes can be made in the color, design, graphics or any other component to create a unique layout.

Customer Relationship Management Lifecycle Analytics Dashboard With Sales Record Brochure PDF
This slide signifies the customer relationship management analytics dashboard. It covers information about sales record by different representative, total products sold, sales by different month, etc.Pitch your topic with ease and precision using this Customer Relationship Management Lifecycle Analytics Dashboard With Sales Record Brochure PDF. This layout presents information on Sales Record, Representative, Total Items. It is also available for immediate download and adjustment. So, changes can be made in the color, design, graphics or any other component to create a unique layout.

Data Evaluation And Processing Toolkit Steps To Accomplish Data Analytics Project Structure PDF
The slide illustrates the key fundamental steps of a data analytics project that helps to realize business value from data insights. It starts from raw data preparation to building a machine learning model. If you are looking for a format to display your unique thoughts, then the professionally designed Data Evaluation And Processing Toolkit Steps To Accomplish Data Analytics Project Structure PDF is the one for you. You can use it as a Google Slides template or a PowerPoint template. Incorporate impressive visuals, symbols, images, and other charts. Modify or reorganize the text boxes as you desire. Experiment with shade schemes and font pairings. Alter, share or cooperate with other people on your work. Download Data Evaluation And Processing Toolkit Steps To Accomplish Data Analytics Project Structure PDF and find out how to give a successful presentation. Present a perfect display to your team and make your presentation unforgettable.
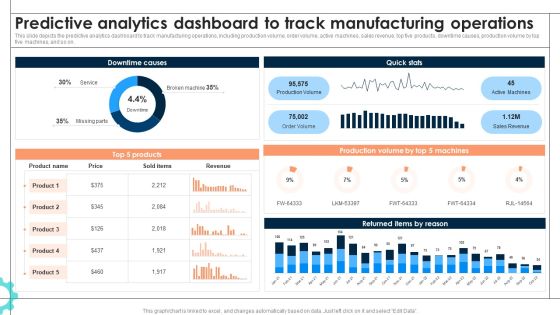
Intelligent Manufacturing Predictive Analytics Dashboard To Track Manufacturing Operations Information PDF
This slide depicts the predictive analytics dashboard to track manufacturing operations, including production volume, order volume, active machines, sales revenue, top five products, downtime causes, production volume by top five machines, and so on. If you are looking for a format to display your unique thoughts, then the professionally designed Intelligent Manufacturing Predictive Analytics Dashboard To Track Manufacturing Operations Information PDF is the one for you. You can use it as a Google Slides template or a PowerPoint template. Incorporate impressive visuals, symbols, images, and other charts. Modify or reorganize the text boxes as you desire. Experiment with shade schemes and font pairings. Alter, share or cooperate with other people on your work. Download Intelligent Manufacturing Predictive Analytics Dashboard To Track Manufacturing Operations Information PDF and find out how to give a successful presentation. Present a perfect display to your team and make your presentation unforgettable.

Website Analytics Dashboard For Consumer Data Insights Ppt PowerPoint Presentation File Slides PDF
This slide showcases dashboard for website analytics that can help organization to gather data about visitors and formulate targeted marketing campaigns. It can also help to make individual and group buyer personas. If you are looking for a format to display your unique thoughts, then the professionally designed Website Analytics Dashboard For Consumer Data Insights Ppt PowerPoint Presentation File Slides PDF is the one for you. You can use it as a Google Slides template or a PowerPoint template. Incorporate impressive visuals, symbols, images, and other charts. Modify or reorganize the text boxes as you desire. Experiment with shade schemes and font pairings. Alter, share or cooperate with other people on your work. Download Website Analytics Dashboard For Consumer Data Insights Ppt PowerPoint Presentation File Slides PDF and find out how to give a successful presentation. Present a perfect display to your team and make your presentation unforgettable.

Guide For Marketing Analytics To Improve Decisions Adequate Resource Allocation For Maximum Utilization Download PDF
The following slide showcases resource allocation chart to clearly mention, track and distribute workload by leveraging analytics tools. It includes elements such as resource name, availability, allocation, completion, specified date etc. If you are looking for a format to display your unique thoughts, then the professionally designed Guide For Marketing Analytics To Improve Decisions Adequate Resource Allocation For Maximum Utilization Download PDF is the one for you. You can use it as a Google Slides template or a PowerPoint template. Incorporate impressive visuals, symbols, images, and other charts. Modify or reorganize the text boxes as you desire. Experiment with shade schemes and font pairings. Alter, share or cooperate with other people on your work. Download Guide For Marketing Analytics To Improve Decisions Adequate Resource Allocation For Maximum Utilization Download PDF and find out how to give a successful presentation. Present a perfect display to your team and make your presentation unforgettable.

Iot Integration In Manufacturing Predictive Analytics Dashboard To Track Manufacturing Operations Background PDF
This slide depicts the predictive analytics dashboard to track manufacturing operations, including production volume, order volume, active machines, sales revenue, top five products, downtime causes, production volume by top five machines, and so on. If you are looking for a format to display your unique thoughts, then the professionally designed Iot Integration In Manufacturing Predictive Analytics Dashboard To Track Manufacturing Operations Background PDF is the one for you. You can use it as a Google Slides template or a PowerPoint template. Incorporate impressive visuals, symbols, images, and other charts. Modify or reorganize the text boxes as you desire. Experiment with shade schemes and font pairings. Alter, share or cooperate with other people on your work. Download Iot Integration In Manufacturing Predictive Analytics Dashboard To Track Manufacturing Operations Background PDF and find out how to give a successful presentation. Present a perfect display to your team and make your presentation unforgettable.

BI Technique For Data Informed Decisions Global Market Landscape Of Sap Analytics Cloud Suite Icons PDF
The purpose of this slide is to showcase the global market landscape of SAP analytics cloud as BI tool. It also contains information regarding the business intelligence BI software market share and SAP analytics cloud customers by industry. Are you in need of a template that can accommodate all of your creative concepts This one is crafted professionally and can be altered to fit any style. Use it with Google Slides or PowerPoint. Include striking photographs, symbols, depictions, and other visuals. Fill, move around, or remove text boxes as desired. Test out color palettes and font mixtures. Edit and save your work, or work with colleagues. Download BI Technique For Data Informed Decisions Global Market Landscape Of Sap Analytics Cloud Suite Icons PDF and observe how to make your presentation outstanding. Give an impeccable presentation to your group and make your presentation unforgettable.

Marketing Performance Dashboard With Analytics Campaign Ppt Infographics Background Images PDF
This slide represents dashboard for campaign performance analytics report. It covers total clicks, CTR, impressions , view-through conversions , total conversion, lead generation, activity per click etc to track campaign progress. Showcasing this set of slides titled Marketing Performance Dashboard With Analytics Campaign Ppt Infographics Background Images PDF. The topics addressed in these templates are Total Clicks, Total Impressions, Total Conversions, Activity Per Click. All the content presented in this PPT design is completely editable. Download it and make adjustments in color, background, font etc. as per your unique business setting.

Data Evaluation And Processing Toolkit Mini Charter For Data Analytics Project Graphics PDF
In this slide, we are highlighting the scope of work for data analytics project. It describes the process, roles and key tasks required to interpret and present the data for a wide range of business applications. Do you have to make sure that everyone on your team knows about any specific topic I yes, then you should give Data Evaluation And Processing Toolkit Mini Charter For Data Analytics Project Graphics PDF a try. Our experts have put a lot of knowledge and effort into creating this impeccable Data Evaluation And Processing Toolkit Mini Charter For Data Analytics Project Graphics PDF. You can use this template for your upcoming presentations, as the slides are perfect to represent even the tiniest detail. You can download these templates from the Slidegeeks website and these are easy to edit. So grab these today.
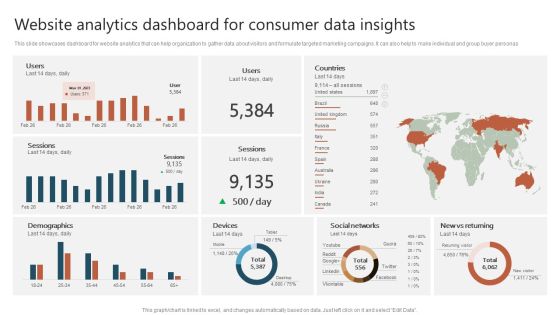
Website Analytics Dashboard For Consumer Data Insights Ppt Show Graphics Download PDF
This slide showcases dashboard for website analytics that can help organization to gather data about visitors and formulate targeted marketing campaigns. It can also help to make individual and group buyer personas. Crafting an eye catching presentation has never been more straightforward. Let your presentation shine with this tasteful yet straightforward Website Analytics Dashboard For Consumer Data Insights Ppt Show Graphics Download PDF template. It offers a minimalistic and classy look that is great for making a statement. The colors have been employed intelligently to add a bit of playfulness while still remaining professional. Construct the ideal Website Analytics Dashboard For Consumer Data Insights Ppt Show Graphics Download PDF that effortlessly grabs the attention of your audience Begin now and be certain to wow your customers.

Go Viral Campaign Strategies To Increase Engagement Social Media Analytics Dashboard Track Viral Graphics PDF
This slides showcases social media analytics dashboard to track viral keywords. It provides details about daily volume, keyword searches, keyword volume, etc. which can effectively guide digital marketers to craft potential campaigns Are you searching for a Go Viral Campaign Strategies To Increase Engagement Social Media Analytics Dashboard Track Viral Graphics PDF that is uncluttered, straightforward, and original Its easy to edit, and you can change the colors to suit your personal or business branding. For a presentation that expresses how much effort you have put in, this template is ideal. With all of its features, including tables, diagrams, statistics, and lists, its perfect for a business plan presentation. Make your ideas more appealing with these professional slides. Download Go Viral Campaign Strategies To Increase Engagement Social Media Analytics Dashboard Track Viral Graphics PDF from Slidegeeks today.

Talent Management Optimization With Workforce Staffing Talent Acquisition Analytics Framework Graphics PDF
This slide represents talent acquisition analytics framework. It includes talent outcomes, candidate quality, hiring volume, source, talent acquisition data etc. This modern and well arranged Talent Management Optimization With Workforce Staffing Talent Acquisition Analytics Framework Graphics PDF provides lots of creative possibilities. It is very simple to customize and edit with the Powerpoint Software. Just drag and drop your pictures into the shapes. All facets of this template can be edited with Powerpoint no extra software is necessary. Add your own material, put your images in the places assigned for them, adjust the colors, and then you can show your slides to the world, with an animated slide included.

Cyber Security Incident Analytics Dashboard With Level Of Security Ppt Ideas Graphics Tutorials PDF
The given slide depicts the cyber threat analytics to track the attacks. It includes the no. of incidents, open and solved tickets, category wise no. of incidents along with malware type etc. Pitch your topic with ease and precision using this Cyber Security Incident Analytics Dashboard With Level Of Security Ppt Ideas Graphics Tutorials PDF. This layout presents information on Power Security Team, Open Incidents, Incidents Solved, Open Tickets. It is also available for immediate download and adjustment. So, changes can be made in the color, design, graphics or any other component to create a unique layout.

Icons Slide Tools For HR Business Analytics Application In HR Ppt Professional Images PDF
Presenting our innovatively structured Icons Slide Tools For HR Business Analytics Application In HR Ppt Professional Images PDF set of slides. The slides contain a hundred percent editable icons. You can replace these icons without any inconvenience. Therefore, pick this set of slides and create a striking presentation.

Five Years Data Analytics Career Roadmap With Live Industry Projects Portrait
Presenting our jaw-dropping five years data analytics career roadmap with live industry projects portrait. You can alternate the color, font size, font type, and shapes of this PPT layout according to your strategic process. This PPT presentation is compatible with Google Slides and is available in both standard screen and widescreen aspect ratios. You can also download this well-researched PowerPoint template design in different formats like PDF, JPG, and PNG. So utilize this visually-appealing design by clicking the download button given below.
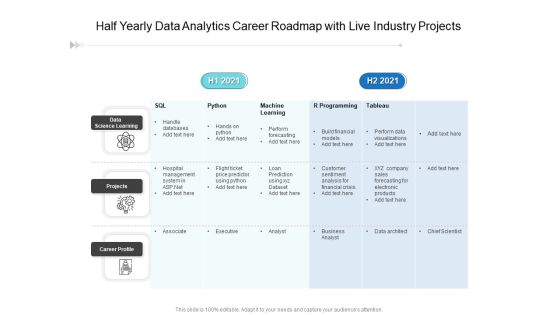
Half Yearly Data Analytics Career Roadmap With Live Industry Projects Formats
Presenting our jaw-dropping half yearly data analytics career roadmap with live industry projects formats You can alternate the color, font size, font type, and shapes of this PPT layout according to your strategic process. This PPT presentation is compatible with Google Slides and is available in both standard screen and widescreen aspect ratios. You can also download this well-researched PowerPoint template design in different formats like PDF, JPG, and PNG. So utilize this visually-appealing design by clicking the download button given below.

Six Months Data Analytics Career Roadmap With Live Industry Projects Demonstration
Presenting our jaw-dropping six months data analytics career roadmap with live industry projects demonstration. You can alternate the color, font size, font type, and shapes of this PPT layout according to your strategic process. This PPT presentation is compatible with Google Slides and is available in both standard screen and widescreen aspect ratios. You can also download this well-researched PowerPoint template design in different formats like PDF, JPG, and PNG. So utilize this visually-appealing design by clicking the download button given below.

Three Months Data Analytics Career Roadmap With Live Industry Projects Elements
Presenting our jaw-dropping three months data analytics career roadmap with live industry projects elements. You can alternate the color, font size, font type, and shapes of this PPT layout according to your strategic process. This PPT presentation is compatible with Google Slides and is available in both standard screen and widescreen aspect ratios. You can also download this well-researched PowerPoint template design in different formats like PDF, JPG, and PNG. So utilize this visually-appealing design by clicking the download button given below.

Information Transformation Process Toolkit Employee Training Plan For Data Analytics Program Information PDF
This slide shows the cross training employee assessment chart based on the key skill levels with respective responsibilities. Deliver and pitch your topic in the best possible manner with this Information Transformation Process Toolkit Employee Training Plan For Data Analytics Program Information PDF. Use them to share invaluable insights on Data Visualization, Employee, Communication Skill and impress your audience. This template can be altered and modified as per your expectations. So, grab it now.

Overview Of Predictive Analytics Framework Forward Looking Analysis IT Topics PDF
This slide outlines the overview of the predictive analytics framework and its components, including wide area network, OpenFlow, forecasting, software-defined networking controller, predictive models, elastic cluster, data acquisition and application servers.If your project calls for a presentation, then Slidegeeks is your go-to partner because we have professionally designed, easy-to-edit templates that are perfect for any presentation. After downloading, you can easily edit Overview Of Predictive Analytics Framework Forward Looking Analysis IT Topics PDF and make the changes accordingly. You can rearrange slides or fill them with different images. Check out all the handy templates

Landing Page Leads And Revenue Generation Analytics For User Experience Optimization Dashboard Formats PDF
This slide covers website analytics based on revenue earned. It also included leads generated, bounce rates, customer churn stats, annual and monthly recurring revenue, etc. Pitch your topic with ease and precision using this Landing Page Leads And Revenue Generation Analytics For User Experience Optimization Dashboard Formats PDF. This layout presents information on Monthly Recurring Revenue, Bounce Rate, Gross Volume. It is also available for immediate download and adjustment. So, changes can be made in the color, design, graphics or any other component to create a unique layout.
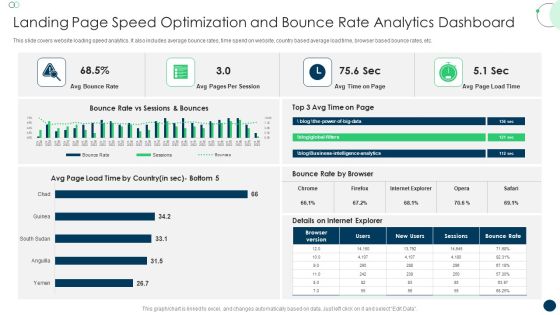
Landing Page Speed Optimization And Bounce Rate Analytics Dashboard Topics PDF
This slide covers website loading speed analytics. It also includes average bounce rates, time spend on website, country based average load time, browser based bounce rates, etc. Pitch your topic with ease and precision using this Landing Page Speed Optimization And Bounce Rate Analytics Dashboard Topics PDF. This layout presents information on Avg Bounce Rate, Avg Pages, Per Session. It is also available for immediate download and adjustment. So, changes can be made in the color, design, graphics or any other component to create a unique layout.

Integrating Iiot To Improve Operational Efficiency Analytics Solution Architecture Designs PDF
This slide covers architectural diagram depicting core subsystems forming an iiot analytics solution. It includes components such as industrial devices sending data, cloud gateway, rules and calculations engine, micro services etc. Pitch your topic with ease and precision using this Integrating Iiot To Improve Operational Efficiency Analytics Solution Architecture Designs PDF. This layout presents information on Field Gateway, Business Process Integration, Machine Learning. It is also available for immediate download and adjustment. So, changes can be made in the color, design, graphics or any other component to create a unique layout.
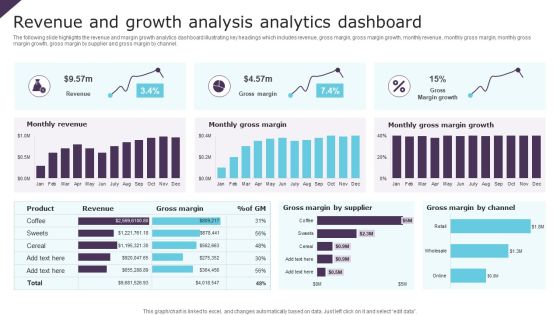
Revenue And Growth Analysis Analytics Dashboard Ppt Infographic Template Brochure PDF
The following slide highlights the revenue and margin growth analytics dashboard illustrating key headings which includes revenue, gross margin, gross margin growth, monthly revenue, monthly gross margin, monthly gross margin growth, gross margin by supplier and gross margin by channel. Pitch your topic with ease and precision using this Revenue And Growth Analysis Analytics Dashboard Ppt Infographic Template Brochure PDF. This layout presents information on Monthly Revenue, Monthly Gross Margin, Gross Margin Growth. It is also available for immediate download and adjustment. So, changes can be made in the color, design, graphics or any other component to create a unique layout.

Bar Graph Showing Spend Analytics Ppt PowerPoint Presentation Infographics Graphics Pictures
Presenting this set of slides with name bar graph showing spend analytics ppt powerpoint presentation infographics graphics pictures. The topics discussed in these slide is total spend, expense reports approved, spend categories. This is a completely editable PowerPoint presentation and is available for immediate download. Download now and impress your audience.

data analytics for customer activity details ppt powerpoint presentation show graphics template pdf
Presenting this set of slides with name data analytics for customer activity details ppt powerpoint presentation show graphics template pdf. The topics discussed in these slides are time period, total activity, avg per user, avg per active user. This is a completely editable PowerPoint presentation and is available for immediate download. Download now and impress your audience.
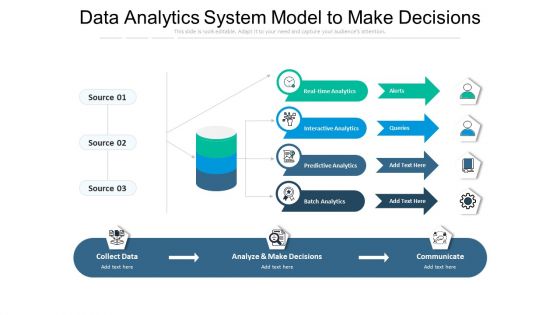
Data Analytics System Model To Make Decisions Ppt PowerPoint Presentation Summary Graphics PDF
Showcasing this set of slides titled data analytics system model to make decisions ppt powerpoint presentation summary graphics pdf. The topics addressed in these templates are collect data, analyze make decisions, communicate. All the content presented in this PPT design is completely editable. Download it and make adjustments in color, background, font etc. as per your unique business setting.
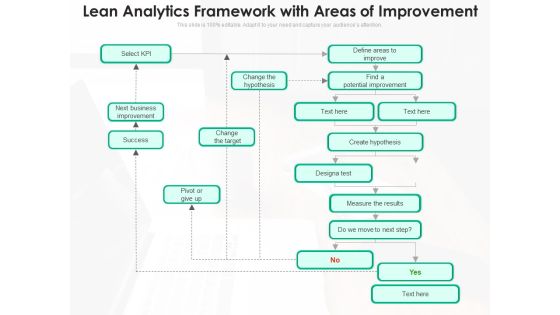
Lean Analytics Framework With Areas Of Improvement Ppt PowerPoint Presentation Model Graphics PDF
Showcasing this set of slides titled lean analytics framework with areas of improvement ppt powerpoint presentation model graphics pdf. The topics addressed in these templates are next business improvement, potential improvement, create hypothesis. All the content presented in this PPT design is completely editable. Download it and make adjustments in color, background, font etc. as per your unique business setting.

Business Intelligence BI With Data Analytics Ppt Infographic Template Graphics PDF
Deliver an awe inspiring pitch with this creative business intelligence bi with data analytics ppt infographic template graphics pdf bundle. Topics like information, analyzes, business, microstrategy can be discussed with this completely editable template. It is available for immediate download depending on the needs and requirements of the user.

Big Data Analytics Industrial Process Technology For Industrial Development Graphics PDF
Showcasing this set of slides titled Big Data Analytics Industrial Process Technology For Industrial Development Graphics PDF. The topics addressed in these templates are Industrial Process Technology, Industrial Development . All the content presented in this PPT design is completely editable. Download it and make adjustments in color, background, font etc. as per your unique business setting.

Social Media Kpi Analytics Measurement Business Social Strategy Guide Infographics PDF
This template covers key performance indicator KPI to determine the performance against the company objectives. These Social media KPIs would be focusing on social engagements, content reach, purchase leads and conversions. If you are looking for a format to display your unique thoughts, then the professionally designed Social Media Kpi Analytics Measurement Business Social Strategy Guide Infographics PDF is the one for you. You can use it as a Google Slides template or a PowerPoint template. Incorporate impressive visuals, symbols, images, and other charts. Modify or reorganize the text boxes as you desire. Experiment with shade schemes and font pairings. Alter, share or cooperate with other people on your work. Download Social Media Kpi Analytics Measurement Business Social Strategy Guide Infographics PDF and find out how to give a successful presentation. Present a perfect display to your team and make your presentation unforgettable.

Human Resource Analytics Data Warehouse And Data Marts Business Intelligence Introduction PDF
This slide represents the data warehouse and data marts architecture of business intelligence. It includes key recommendations such as utilized for distributing required information to each department etc. If you are looking for a format to display your unique thoughts, then the professionally designed Human Resource Analytics Data Warehouse And Data Marts Business Intelligence Introduction PDF is the one for you. You can use it as a Google Slides template or a PowerPoint template. Incorporate impressive visuals, symbols, images, and other charts. Modify or reorganize the text boxes as you desire. Experiment with shade schemes and font pairings. Alter, share or cooperate with other people on your work. Download Human Resource Analytics Data Warehouse And Data Marts Business Intelligence Introduction PDF and find out how to give a successful presentation. Present a perfect display to your team and make your presentation unforgettable.

Cost Effectiveness Analysis To Evaluate Impact Of Implementing Marketing Analytics Structure PDF
This slide covers the cost-effectiveness analysis to identify the best-performing and worst-performing marketing channels. It includes cost and conversion analysis of channels such as landing page or website, SEO, paid search, social media, blogging, etc. If you are looking for a format to display your unique thoughts, then the professionally designed Cost Effectiveness Analysis To Evaluate Impact Of Implementing Marketing Analytics Structure PDF is the one for you. You can use it as a Google Slides template or a PowerPoint template. Incorporate impressive visuals, symbols, images, and other charts. Modify or reorganize the text boxes as you desire. Experiment with shade schemes and font pairings. Alter, share or cooperate with other people on your work. Download Cost Effectiveness Analysis To Evaluate Impact Of Implementing Marketing Analytics Structure PDF and find out how to give a successful presentation. Present a perfect display to your team and make your presentation unforgettable.

Tools For HR Business Analytics Comparison Between Reporting Type Flow Inspiration PDF
This slide represents the difference between the types of data reporting flow. It includes comparison between traditional BI and self-service BI on the basis of IT setup, agility, data governance, kind of reporting and data. If you are looking for a format to display your unique thoughts, then the professionally designed Tools For HR Business Analytics Comparison Between Reporting Type Flow Inspiration PDF is the one for you. You can use it as a Google Slides template or a PowerPoint template. Incorporate impressive visuals, symbols, images, and other charts. Modify or reorganize the text boxes as you desire. Experiment with shade schemes and font pairings. Alter, share or cooperate with other people on your work. Download Tools For HR Business Analytics Comparison Between Reporting Type Flow Inspiration PDF and find out how to give a successful presentation. Present a perfect display to your team and make your presentation unforgettable.

Predictive Analytics In The Age Of Big Data Overview Of Regression Model Types Diagrams PDF
This slide represents the types of the regression model, including its overview, examples, and usage percentage. The main types of regression include linear, multiple linear, stepwise regression modelling, and non-linear regression. If you are looking for a format to display your unique thoughts, then the professionally designed Predictive Analytics In The Age Of Big Data Overview Of Regression Model Types Diagrams PDF is the one for you. You can use it as a Google Slides template or a PowerPoint template. Incorporate impressive visuals, symbols, images, and other charts. Modify or reorganize the text boxes as you desire. Experiment with shade schemes and font pairings. Alter, share or cooperate with other people on your work. Download Predictive Analytics In The Age Of Big Data Overview Of Regression Model Types Diagrams PDF and find out how to give a successful presentation. Present a perfect display to your team and make your presentation unforgettable.
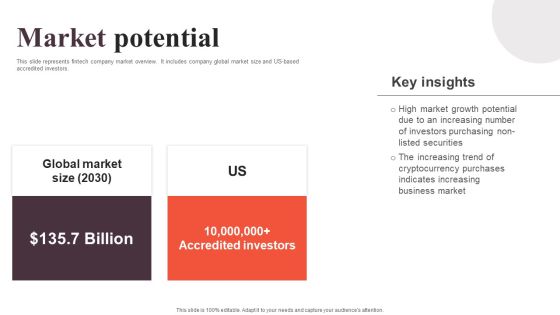
Financial Analytics Solution Investor Funding Elevator Pitch Deck Market Potential Information PDF
This slide represents fintech company market overview. It includes company global market size and US-based accredited investors. If you are looking for a format to display your unique thoughts, then the professionally designed Financial Analytics Solution Investor Funding Elevator Pitch Deck Market Potential Information PDF is the one for you. You can use it as a Google Slides template or a PowerPoint template. Incorporate impressive visuals, symbols, images, and other charts. Modify or reorganize the text boxes as you desire. Experiment with shade schemes and font pairings. Alter, share or cooperate with other people on your work. Download Financial Analytics Solution Investor Funding Elevator Pitch Deck Market Potential Information PDF and find out how to give a successful presentation. Present a perfect display to your team and make your presentation unforgettable.

Data Analytics Change Management Gantt Chart Transformation Toolkit Competitive Intelligence Rules PDF
The slide shows the timeline for assessing and implementing the change in data analytics project. Are you in need of a template that can accommodate all of your creative concepts This one is crafted professionally and can be altered to fit any style. Use it with Google Slides or PowerPoint. Include striking photographs, symbols, depictions, and other visuals. Fill, move around, or remove text boxes as desired. Test out color palettes and font mixtures. Edit and save your work, or work with colleagues. Download Data Analytics Change Management Gantt Chart Transformation Toolkit Competitive Intelligence Rules PDF and observe how to make your presentation outstanding. Give an impeccable presentation to your group and make your presentation unforgettable.

Developing Promotional Strategic Plan For Online Marketing Website Analytics Dashboard For Consumer Summary PDF
This slide showcases dashboard for website analytics that can help organization to gather data about visitors and formulate targeted marketing campaigns. It can also help to make individual and group buyer personas. Are you in need of a template that can accommodate all of your creative concepts This one is crafted professionally and can be altered to fit any style. Use it with Google Slides or PowerPoint. Include striking photographs, symbols, depictions, and other visuals. Fill, move around, or remove text boxes as desired. Test out color palettes and font mixtures. Edit and save your work, or work with colleagues. Download Developing Promotional Strategic Plan For Online Marketing Website Analytics Dashboard For Consumer Summary PDF and observe how to make your presentation outstanding. Give an impeccable presentation to your group and make your presentation unforgettable.

Predictive Data Model Methods Of Data Clustering In Predictive Analytics Rules PDF
This slide outlines the two primary information clustering methods used in the predictive analytics clustering model. The methods include K-means and K-nearest neighbor clustering, including the working of both approaches. Are you in need of a template that can accommodate all of your creative concepts This one is crafted professionally and can be altered to fit any style. Use it with Google Slides or PowerPoint. Include striking photographs, symbols, depictions, and other visuals. Fill, move around, or remove text boxes as desired. Test out color palettes and font mixtures. Edit and save your work, or work with colleagues. Download Predictive Data Model Methods Of Data Clustering In Predictive Analytics Rules PDF and observe how to make your presentation outstanding. Give an impeccable presentation to your group and make your presentation unforgettable.

Predictive Data Model Uses Of Predictive Analytics In Marketing Industry Themes PDF
This slide outlines the use of predictive analytics in the marketing industry, where active traders develop a new campaign based on customer behavior. The marketing use cases include understanding customer behavior, optimizing resources and spending, qualifying and prioritizing leads, and retaining customers. Are you in need of a template that can accommodate all of your creative concepts This one is crafted professionally and can be altered to fit any style. Use it with Google Slides or PowerPoint. Include striking photographs, symbols, depictions, and other visuals. Fill, move around, or remove text boxes as desired. Test out color palettes and font mixtures. Edit and save your work, or work with colleagues. Download Predictive Data Model Uses Of Predictive Analytics In Marketing Industry Themes PDF and observe how to make your presentation outstanding. Give an impeccable presentation to your group and make your presentation unforgettable.
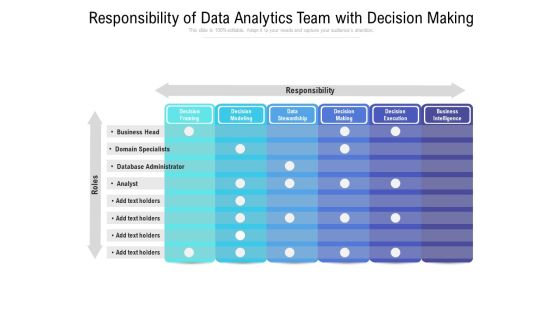
Responsibility Of Data Analytics Team With Decision Making Ppt PowerPoint Presentation File Outfit PDF
Pitch your topic with ease and precision using this responsibility of data analytics team with decision making ppt powerpoint presentation file outfit pdf. This layout presents information on business head, domain specialists, database administrator, analyst, responsibility. It is also available for immediate download and adjustment. So, changes can be made in the color, design, graphics or any other component to create a unique layout.

Crawl Walk Run Approach For Business Analytics Ppt PowerPoint Presentation Gallery Layout PDF
Pitch your topic with ease and precision using this crawl walk run approach for business analytics ppt powerpoint presentation gallery layout pdf. This layout presents information on crawl, walk, run. It is also available for immediate download and adjustment. So, changes can be made in the color, design, graphics or any other component to create a unique layout.

Consumer Data Analytics Report With Adwords Integration Ppt PowerPoint Presentation Gallery Sample PDF
Pitch your topic with ease and precision using this consumer data analytics report with adwords integration ppt powerpoint presentation gallery sample pdf. This layout presents information on property settings, adwords integration, view settings, filter creation. It is also available for immediate download and adjustment. So, changes can be made in the color, design, graphics or any other component to create a unique layout.
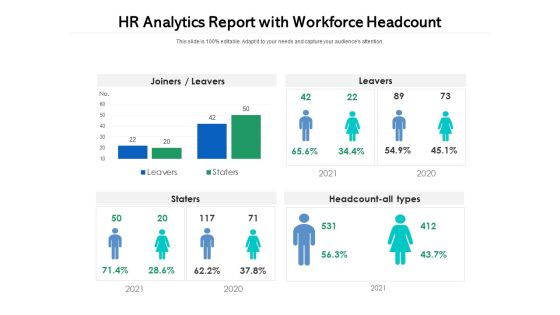
HR Analytics Report With Workforce Headcount Ppt PowerPoint Presentation File Grid PDF
Pitch your topic with ease and precision using this hr analytics report with workforce headcount ppt powerpoint presentation file grid pdf. This layout presents information on joiners leavers, staters, headcount all types. It is also available for immediate download and adjustment. So, changes can be made in the color, design, graphics or any other component to create a unique layout.
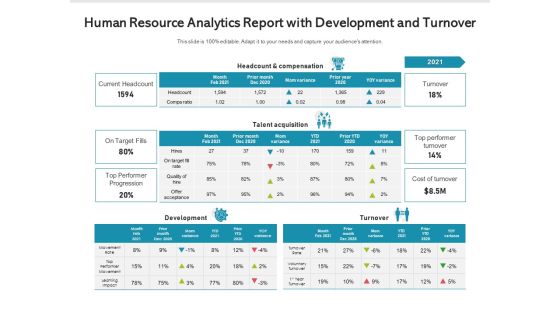
Human Resource Analytics Report With Development And Turnover Ppt PowerPoint Presentation File Layout PDF
Pitch your topic with ease and precision using this human resource analytics report with development and turnover ppt powerpoint presentation file layout pdf. This layout presents information on current headcount, on target fills, top performer progression. It is also available for immediate download and adjustment. So, changes can be made in the color, design, graphics or any other component to create a unique layout.

Advanced Analytics System Report With Key Features Ppt PowerPoint Presentation Show Vector PDF
Pitch your topic with ease and precision using this advanced analytics system report with key features ppt powerpoint presentation show vector pdf. This layout presents information on service call reporting, deployment, your budget. It is also available for immediate download and adjustment. So, changes can be made in the color, design, graphics or any other component to create a unique layout.
Employee Key Performance Indicators Performance Indicators Analytics And Monitoring Icon Demonstration PDF
Pitch your topic with ease and precision using this Employee Key Performance Indicators Performance Indicators Analytics And Monitoring Icon Demonstration PDF This layout presents information on Employee Key, Performance Indicators, Performance Indicators It is also available for immediate download and adjustment. So, changes can be made in the color, design, graphics or any other component to create a unique layout.
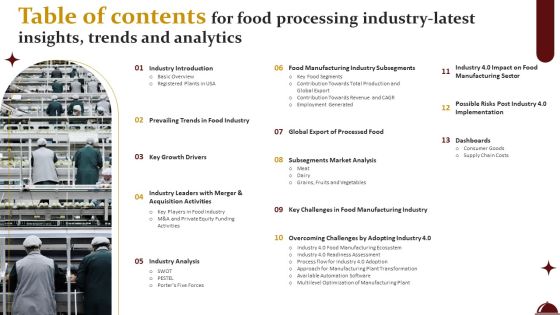
Table Of Contents For Food Processing Industry Latest Insights Trends And Analytics Graphics PDF
If your project calls for a presentation, then Slidegeeks is your go to partner because we have professionally designed, easy to edit templates that are perfect for any presentation. After downloading, you can easily edit Table Of Contents For Food Processing Industry Latest Insights Trends And Analytics Graphics PDF and make the changes accordingly. You can rearrange slides or fill them with different images. Check out all the handy templates.
Optimizing Marketing Analytics To Enhance Organizational Growth Website Landing Page KPI Tracking Dashboard Graphics PDF
This slide covers a dashboard for analysing the metrics of the website landing page. It includes KPIs such as conversions, conversion rate, sessions, bounce rate, engagement sickness, etc. Do you have an important presentation coming up Are you looking for something that will make your presentation stand out from the rest Look no further than Optimizing Marketing Analytics To Enhance Organizational Growth Website Landing Page KPI Tracking Dashboard Graphics PDF. With our professional designs, you can trust that your presentation will pop and make delivering it a smooth process. And with Slidegeeks, you can trust that your presentation will be unique and memorable. So why wait Grab Optimizing Marketing Analytics To Enhance Organizational Growth Website Landing Page KPI Tracking Dashboard Graphics PDF today and make your presentation stand out from the rest.

Executing Advance Data Analytics At Workspace Determine Network Management Architecture Graphics PDF
This slide covers details regarding the network management architecture and standard network management platform including management data browser, network discovery, performance data collector. Deliver an awe inspiring pitch with this creative executing advance data analytics at workspace determine network management architecture graphics pdf bundle. Topics like determine network management architecture can be discussed with this completely editable template. It is available for immediate download depending on the needs and requirements of the user.

Procurement Analytics Tools And Strategies List Of Supplies To Be Purchased Graphics PDF
This slide covers suppliers list for purchasing material including country, program, procurement period, quantity, units, reference cost etc.Deliver an awe inspiring pitch with this creative Procurement Analytics Tools And Strategies List Of Supplies To Be Purchased Graphics PDF bundle. Topics like Concentration, Total Reference, Procurement Period can be discussed with this completely editable template. It is available for immediate download depending on the needs and requirements of the user.

Procurement Analytics Tools And Strategies Qualification Of Suppliers In Procurement Analysis Graphics PDF
This slide covers suppliers qualification or acceptance criteria of supplier based on some parameters and points. Deliver and pitch your topic in the best possible manner with this Procurement Analytics Tools And Strategies Qualification Of Suppliers In Procurement Analysis Graphics PDF. Use them to share invaluable insights on Degree Of Confidence, Satisfactory Suppliers, Degree Confidence and impress your audience. This template can be altered and modified as per your expectations. So, grab it now.

Retail Outlet Operational Efficiency Analytics Key Retail Store Operational Areas Graphics PDF
This slide provides an overview of multiple retail store operational areas such as store administration, inventory management, customer service, sales, and marketing, etc. Deliver and pitch your topic in the best possible manner with this Retail Outlet Operational Efficiency Analytics Key Retail Store Operational Areas Graphics PDF. Use them to share invaluable insights on Inventory Management, Store Administration, Customer Service and impress your audience. This template can be altered and modified as per your expectations. So, grab it now.

Human Resource Analytics Deployment Ppt PowerPoint Presentation Complete Deck With Slides
This Human Resource Analytics Deployment Ppt PowerPoint Presentation Complete Deck With Slides is designed to help you retain your audiences attention. This content-ready PowerPoint Template enables you to take your audience on a journey and share information in a way that is easier to recall. It helps you highlight the crucial parts of your work so that the audience does not get saddled with information download. This sixty one slide PPT Deck comes prepared with the graphs and charts you could need to showcase your information through visuals. You only need to enter your own data in them. Download this editable PowerPoint Theme and walk into that meeting with confidence.

BI Technique For Data Informed Decisions Sap Analytics Cloud Dashboard For HR Department Background PDF
This slide represents the SAP Analytics Cloud Dashboard for HR department of the organization. It includes information regarding the workforce employed, average salary department wise, age diversity, gender distribution and reasons for leaving firm. This modern and well-arranged BI Technique For Data Informed Decisions Sap Analytics Cloud Dashboard For HR Department Background PDF provides lots of creative possibilities. It is very simple to customize and edit with the Powerpoint Software. Just drag and drop your pictures into the shapes. All facets of this template can be edited with Powerpoint no extra software is necessary. Add your own material, put your images in the places assigned for them, adjust the colors, and then you can show your slides to the world, with an animated slide included.
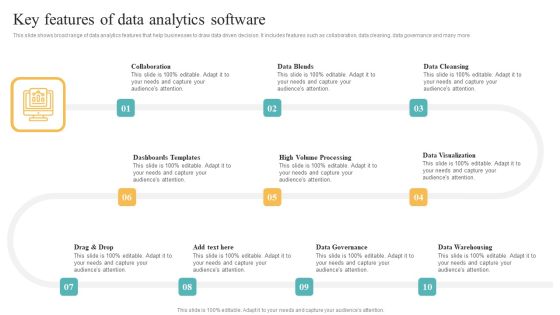
Transformation Toolkit Competitive Intelligence Information Analysis Key Features Of Data Analytics Software Elements PDF
This slide shows broad range of data analytics features that help businesses to draw data driven decision. It includes features such as collaboration, data cleaning, data governance and many more. This modern and well arranged Transformation Toolkit Competitive Intelligence Information Analysis Key Features Of Data Analytics Software Elements PDF provides lots of creative possibilities. It is very simple to customize and edit with the Powerpoint Software. Just drag and drop your pictures into the shapes. All facets of this template can be edited with Powerpoint no extra software is necessary. Add your own material, put your images in the places assigned for them, adjust the colors, and then you can show your slides to the world, with an animated slide included.

Deploying Ai To Enhance Predictive Analytics Dashboard To Track Manufacturing Guidelines PDF
This slide depicts the predictive analytics dashboard to track manufacturing operations, including production volume, order volume, active machines, sales revenue, top five products, downtime causes, production volume by top five machines, and so on. This modern and well-arranged Deploying Ai To Enhance Predictive Analytics Dashboard To Track Manufacturing Guidelines PDF provides lots of creative possibilities. It is very simple to customize and edit with the Powerpoint Software. Just drag and drop your pictures into the shapes. All facets of this template can be edited with Powerpoint, no extra software is necessary. Add your own material, put your images in the places assigned for them, adjust the colors, and then you can show your slides to the world, with an animated slide included.
Online Marketing Analytics To Enhance Business Growth Tracking Social Media Content Reach For Better Template PDF
This slide covers an overview of social media content reach to identify the number of people who see your content, either ads or posts. It also includes improvement strategies such as producing high-quality content, increasing the number of images, etc. Whether you have daily or monthly meetings, a brilliant presentation is necessary. Online Marketing Analytics To Enhance Business Growth Tracking Social Media Content Reach For Better Template PDF can be your best option for delivering a presentation. Represent everything in detail using Online Marketing Analytics To Enhance Business Growth Tracking Social Media Content Reach For Better Template PDF and make yourself stand out in meetings. The template is versatile and follows a structure that will cater to your requirements. All the templates prepared by Slidegeeks are easy to download and edit. Our research experts have taken care of the corporate themes as well. So, give it a try and see the results.
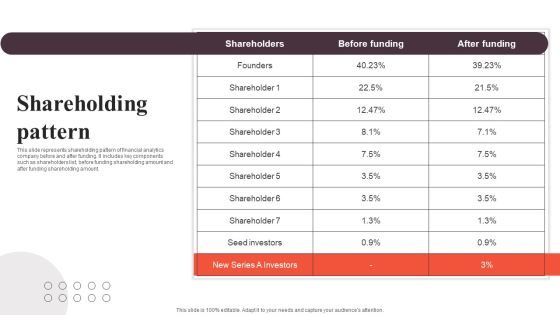
Financial Analytics Solution Investor Funding Elevator Pitch Deck Shareholding Pattern Pictures PDF
This slide represents shareholding pattern of financial analytics company before and after funding. It includes key components such as shareholders list, before funding shareholding amount and after funding shareholding amount. This modern and well arranged Financial Analytics Solution Investor Funding Elevator Pitch Deck Shareholding Pattern Pictures PDF provides lots of creative possibilities. It is very simple to customize and edit with the Powerpoint Software. Just drag and drop your pictures into the shapes. All facets of this template can be edited with Powerpoint no extra software is necessary. Add your own material, put your images in the places assigned for them, adjust the colors, and then you can show your slides to the world, with an animated slide included.

Projection Model Methods Of Data Clustering In Predictive Analytics Formats PDF
This slide outlines the two primary information clustering methods used in the predictive analytics clustering model. The methods include K-means and K-nearest neighbor clustering, including the working of both approaches. This modern and well-arranged Projection Model Methods Of Data Clustering In Predictive Analytics Formats PDF provides lots of creative possibilities. It is very simple to customize and edit with the Powerpoint Software. Just drag and drop your pictures into the shapes. All facets of this template can be edited with Powerpoint, no extra software is necessary. Add your own material, put your images in the places assigned for them, adjust the colors, and then you can show your slides to the world, with an animated slide included.
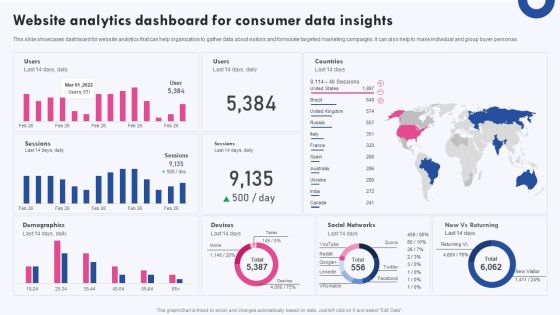
Targeted Marketing Campaigns To Improve Buyers Experience Website Analytics Dashboard For Consumer Infographics PDF
This slide showcases dashboard for website analytics that can help organization to gather data about visitors and formulate targeted marketing campaigns. It can also help to make individual and group buyer personas This modern and well arranged Targeted Marketing Campaigns To Improve Buyers Experience Website Analytics Dashboard For Consumer Infographics PDF provides lots of creative possibilities. It is very simple to customize and edit with the Powerpoint Software. Just drag and drop your pictures into the shapes. All facets of this template can be edited with Powerpoint no extra software is necessary. Add your own material, put your images in the places assigned for them, adjust the colors, and then you can show your slides to the world, with an animated slide included.

Data Evaluation And Processing Toolkit Reasons Towards Failure Of Data Analytics Project Designs PDF
This slide shows the graph highlighting key reasons for the failure of data management project. If your project calls for a presentation, then Slidegeeks is your go-to partner because we have professionally designed, easy-to-edit templates that are perfect for any presentation. After downloading, you can easily edit Data Evaluation And Processing Toolkit Reasons Towards Failure Of Data Analytics Project Designs PDF and make the changes accordingly. You can rearrange slides or fill them with different images. Check out all the handy templates.

Marketing Success Metrics Pre And Post Market Analytics Implementation Information PDF
This slide covers a graphical representation of marketing analytics impact on various business aspects such as customer lifetime value, employee engagement, improvement in customer effort score, and average profit margin Per customer. Do you know about Slidesgeeks Marketing Success Metrics Pre And Post Market Analytics Implementation Information PDF These are perfect for delivering any kind od presentation. Using it, create PowerPoint presentations that communicate your ideas and engage audiences. Save time and effort by using our pre-designed presentation templates that are perfect for a wide range of topic. Our vast selection of designs covers a range of styles, from creative to business, and are all highly customizable and easy to edit. Download as a PowerPoint template or use them as Google Slides themes.
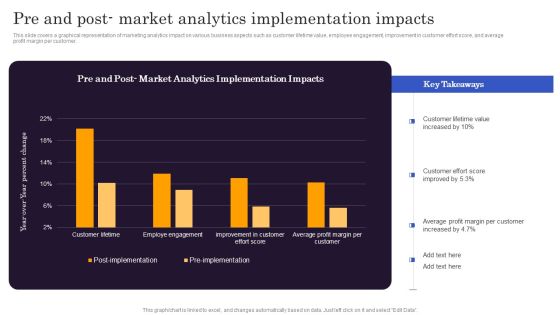
Marketers Guide To Data Analysis Optimization Pre And Post Market Analytics Implementation Impacts Formats PDF
This slide covers a graphical representation of marketing analytics impact on various business aspects such as customer lifetime value, employee engagement, improvement in customer effort score, and average profit margin per customer. Do you know about Slidesgeeks Marketers Guide To Data Analysis Optimization Pre And Post Market Analytics Implementation Impacts Formats PDF. These are perfect for delivering any kind od presentation. Using it, create PowerPoint presentations that communicate your ideas and engage audiences. Save time and effort by using our pre designed presentation templates that are perfect for a wide range of topic. Our vast selection of designs covers a range of styles, from creative to business, and are all highly customizable and easy to edit. Download as a PowerPoint template or use them as Google Slides themes.

Project Analytics Dashboard With Conversion Rate Ppt PowerPoint Presentation File Deck PDF
Pitch your topic with ease and precision using this project analytics dashboard with conversion rate ppt powerpoint presentation gallery graphics template pdf. This layout presents information on cost per conversion, supercharger network, advertisement conversion, conversion by campaign. It is also available for immediate download and adjustment. So, changes can be made in the color, design, graphics or any other component to create a unique layout.

Transforming Big Data Analytics To Knowledge Ppt PowerPoint Presentation Complete Deck With Slides
This complete presentation has PPT slides on wide range of topics highlighting the core areas of your business needs. It has professionally designed templates with relevant visuals and subject driven content. This presentation deck has total of twenty one slides. Get access to the customizable templates. Our designers have created editable templates for your convenience. You can edit the colour, text and font size as per your need. You can add or delete the content if required. You are just a click to away to have this ready made presentation. Click the download button now.

Customer Behavioral Data And Analytics Ppt PowerPoint Presentation Complete With Slides
This complete presentation has PPT slides on wide range of topics highlighting the core areas of your business needs. It has professionally designed templates with relevant visuals and subject driven content. This presentation deck has total of fifty one slides. Get access to the customizable templates. Our designers have created editable templates for your convenience. You can edit the colour, text and font size as per your need. You can add or delete the content if required. You are just a click to away to have this ready made presentation. Click the download button now.

Data And Analytics Playbook Ppt PowerPoint Presentation Complete Deck With Slides
This complete presentation has PPT slides on wide range of topics highlighting the core areas of your business needs. It has professionally designed templates with relevant visuals and subject driven content. This presentation deck has total of fourty slides. Get access to the customizable templates. Our designers have created editable templates for your convenience. You can edit the colour, text and font size as per your need. You can add or delete the content if required. You are just a click to away to have this ready made presentation. Click the download button now.
Procurement Analytics Tools And Strategies Ppt PowerPoint Presentation Complete Deck With Slides
This complete presentation has PPT slides on wide range of topics highlighting the core areas of your business needs. It has professionally designed templates with relevant visuals and subject driven content. This presentation deck has total of fivty nine slides. Get access to the customizable templates. Our designers have created editable templates for your convenience. You can edit the colour, text and font size as per your need. You can add or delete the content if required. You are just a click to away to have this ready made presentation. Click the download button now.

Data Warehouse Analytics App Ppt PowerPoint Presentation Complete Deck With Slides
This complete presentation has PPT slides on wide range of topics highlighting the core areas of your business needs. It has professionally designed templates with relevant visuals and subject driven content. This presentation deck has total of eighty nine slides. Get access to the customizable templates. Our designers have created editable templates for your convenience. You can edit the colour, text and font size as per your need. You can add or delete the content if required. You are just a click to away to have this ready made presentation. Click the download button now.

Software Characteristics For Business Analytics Transformation Ppt PowerPoint Presentation Complete Deck With Slides
This complete presentation has PPT slides on wide range of topics highlighting the core areas of your business needs. It has professionally designed templates with relevant visuals and subject driven content. This presentation deck has total of sixteen slides. Get access to the customizable templates. Our designers have created editable templates for your convenience. You can edit the colour, text and font size as per your need. You can add or delete the content if required. You are just a click to away to have this ready made presentation. Click the download button now.
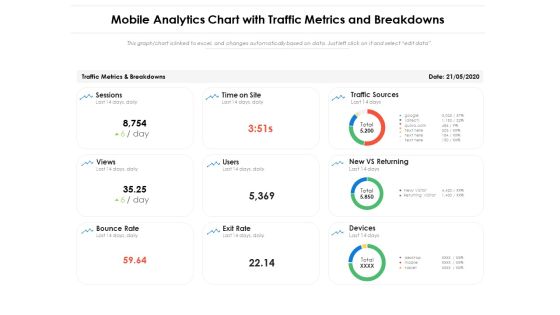
Mobile Analytics Chart With Traffic Metrics And Breakdowns Ppt PowerPoint Presentation Ideas Layout PDF
Pitch your topic with ease and precision using this mobile analytics chart with traffic metrics and breakdowns ppt powerpoint presentation ideas layout pdf. This layout presents information on traffic sources, new vs returning, devices, bounce rate, sessions. It is also available for immediate download and adjustment. So, changes can be made in the color, design, graphics or any other component to create a unique layout.

Mobile Analytics To Assess User Interactions Ppt PowerPoint Presentation Layouts Design Inspiration PDF
Pitch your topic with ease and precision using this mobile analytics to assess user interactions ppt powerpoint presentation layouts design inspiration pdf. This layout presents information on platform android, occurrences, affected users, latest app version, revenue loss. It is also available for immediate download and adjustment. So, changes can be made in the color, design, graphics or any other component to create a unique layout.

Role Of Analytics In Transforming Healthcare Ppt PowerPoint Presentation Slides Download PDF
Pitch your topic with ease and precision using this role of analytics in transforming healthcare ppt powerpoint presentation slides download pdf. This layout presents information on disease surveillance and preventative management, effective diagnostic and therapeutic techniques, development of a faster, leaner. It is also available for immediate download and adjustment. So, changes can be made in the color, design, graphics or any other component to create a unique layout.

Transformation Toolkit Competitive Intelligence Information Analysis Industry Data Analytics Value Stream Model Inspiration PDF
This slide shows the data value streams structure that will identify and represent all data sources and methods to transform the ingest information into analytical data for business decision making. Are you in need of a template that can accommodate all of your creative concepts This one is crafted professionally and can be altered to fit any style. Use it with Google Slides or PowerPoint. Include striking photographs, symbols, depictions, and other visuals. Fill, move around, or remove text boxes as desired. Test out color palettes and font mixtures. Edit and save your work, or work with colleagues. Download Transformation Toolkit Competitive Intelligence Information Analysis Industry Data Analytics Value Stream Model Inspiration PDF and observe how to make your presentation outstanding. Give an impeccable presentation to your group and make your presentation unforgettable.
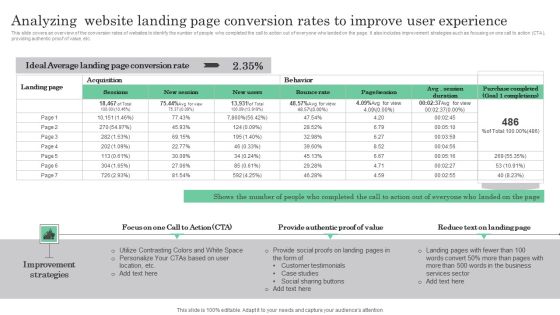
Online Marketing Analytics To Enhance Business Growth Analyzing Website Landing Page Conversion Rates Information PDF
This slide covers an overview of the conversion rates of websites to identify the number of people who completed the call to action out of everyone who landed on the page. It also includes improvement strategies such as focusing on one call to action CTA, providing authentic proof of value, etc. If you are looking for a format to display your unique thoughts, then the professionally designed Online Marketing Analytics To Enhance Business Growth Analyzing Website Landing Page Conversion Rates Information PDF is the one for you. You can use it as a Google Slides template or a PowerPoint template. Incorporate impressive visuals, symbols, images, and other charts. Modify or reorganize the text boxes as you desire. Experiment with shade schemes and font pairings. Alter, share or cooperate with other people on your work. Download Online Marketing Analytics To Enhance Business Growth Analyzing Website Landing Page Conversion Rates Information PDF and find out how to give a successful presentation. Present a perfect display to your team and make your presentation unforgettable.

Customer Behavioral Data And Analytics Customer Lifetime Value Ltv Graphics PDF
Measure the total business a customer brings over the whole period of their relationship with your brand. This helps to develop strategies to acquire new customers at lower cost and retain existing ones while maintaining profit margins. Deliver and pitch your topic in the best possible manner with this customer behavioral data and analytics customer lifetime value ltv graphics pdf. Use them to share invaluable insights on customer lifetime value and impress your audience. This template can be altered and modified as per your expectations. So, grab it now.

Executing Advance Data Analytics At Workspace Assessing Staff Performance Graphics PDF
This slide helps in analyzing the performance of different executives representatives. It will help in tracking metrics such as cost per contact, percentage of tickets opened, etc. The staff performance will be assessed on various parameters such as cost, quality, productivity and service level. Deliver and pitch your topic in the best possible manner with this executing advance data analytics at workspace assessing staff performance graphics pdf. Use them to share invaluable insights on assessing staff performance on various parameters and impress your audience. This template can be altered and modified as per your expectations. So, grab it now.
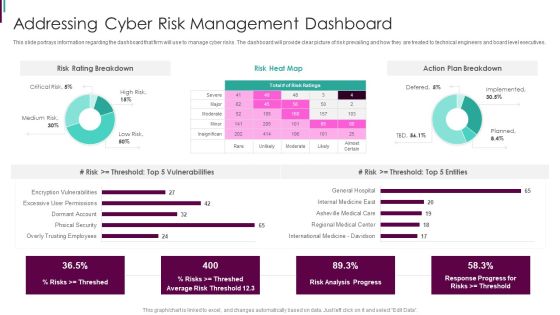
Developing Business Analytics Framework Addressing Cyber Risk Management Dashboard Graphics PDF
This slide portrays information regarding the dashboard that firm will use to manage cyber risks. The dashboard will provide clear picture of risk prevailing and how they are treated to technical engineers and board level executives.Deliver and pitch your topic in the best possible manner with this Developing Business Analytics Framework Addressing Cyber Risk Management Dashboard Graphics PDF Use them to share invaluable insights on Risk Breakdown, Action Breakdown, Vulnerabilities and impress your audience. This template can be altered and modified as per your expectations. So, grab it now.
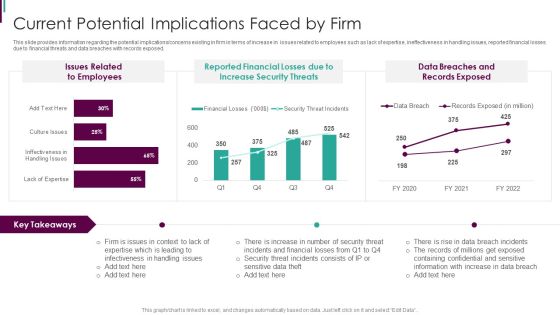
Developing Business Analytics Framework Current Potential Implications Faced By Firm Graphics PDF
This slide provides information regarding the potential implications concerns existing in firm in terms of increase in issues related to employees such as lack of expertise, ineffectiveness in handling issues, reported financial losses due to financial threats and data breaches with records exposed. Deliver and pitch your topic in the best possible manner with this Developing Business Analytics Framework Current Potential Implications Faced By Firm Graphics PDF Use them to share invaluable insights on Reported Financial, Increase Security, Data Breaches and impress your audience. This template can be altered and modified as per your expectations. So, grab it now.
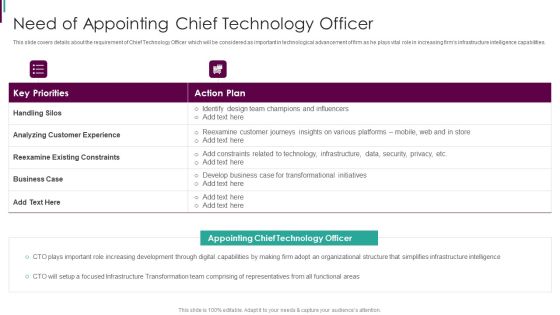
Developing Business Analytics Framework Need Of Appointing Chief Technology Officer Graphics PDF
This slide covers details about the requirement of Chief Technology Officer which will be considered as important in technological advancement of firm as he plays vital role in increasing firms infrastructure intelligence capabilities. Deliver and pitch your topic in the best possible manner with this Developing Business Analytics Framework Need Of Appointing Chief Technology Officer Graphics PDF Use them to share invaluable insights on Customer Experience, Existing Constraints, Champions And Influencers and impress your audience. This template can be altered and modified as per your expectations. So, grab it now.
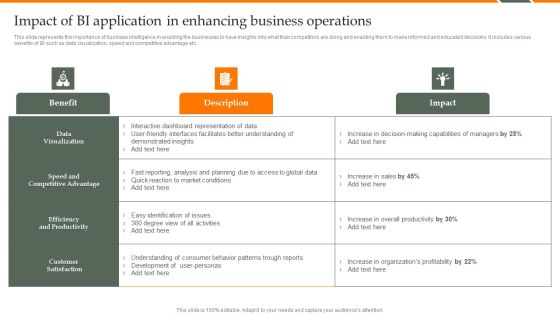
Human Resource Analytics Impact Of BI Application In Enhancing Business Operations Professional PDF
This slide represents the importance of business intelligence in enabling the businesses to have insights into what their competitors are doing and enabling them to make informed and educated decisions. It includes various benefits of BI such as data visualization, speed and competitive advantage etc. This modern and well-arranged Human Resource Analytics Impact Of BI Application In Enhancing Business Operations Professional PDF provides lots of creative possibilities. It is very simple to customize and edit with the Powerpoint Software. Just drag and drop your pictures into the shapes. All facets of this template can be edited with Powerpoint, no extra software is necessary. Add your own material, put your images in the places assigned for them, adjust the colors, and then you can show your slides to the world, with an animated slide included.
System Steadiness Analytics Process Ppt PowerPoint Presentation Complete Deck With Slides
Boost your confidence and team morale with this well-structured system steadiness analytics process ppt powerpoint presentation complete deck with slides. This prefabricated set gives a voice to your presentation because of its well-researched content and graphics. Our experts have added all the components very carefully, thus helping you deliver great presentations with a single click. Not only that, it contains a set of twelve slides that are designed using the right visuals, graphics, etc. Various topics can be discussed, and effective brainstorming sessions can be conducted using the wide variety of slides added in this complete deck. Apart from this, our PPT design contains clear instructions to help you restructure your presentations and create multiple variations. The color, format, design anything can be modified as deemed fit by the user. Not only this, it is available for immediate download. So, grab it now.
Operational Analytics Developer Community Ppt PowerPoint Presentation Complete Deck With Slides
Boost your confidence and team morale with this well-structured operational analytics developer community ppt powerpoint presentation complete deck with slides. This prefabricated set gives a voice to your presentation because of its well-researched content and graphics. Our experts have added all the components very carefully, thus helping you deliver great presentations with a single click. Not only that, it contains a set of eleven slides that are designed using the right visuals, graphics, etc. Various topics can be discussed, and effective brainstorming sessions can be conducted using the wide variety of slides added in this complete deck. Apart from this, our PPT design contains clear instructions to help you restructure your presentations and create multiple variations. The color, format, design anything can be modified as deemed fit by the user. Not only this, it is available for immediate download. So, grab it now.

Circular Procedure For New Product Launch Business Analytics Ppt PowerPoint Presentation Complete Deck With Slides
Boost your confidence and team morale with this well-structured circular procedure for new product launch business analytics ppt powerpoint presentation complete deck with slides. This prefabricated set gives a voice to your presentation because of its well-researched content and graphics. Our experts have added all the components very carefully, thus helping you deliver great presentations with a single click. Not only that, it contains a set of nine slides that are designed using the right visuals, graphics, etc. Various topics can be discussed, and effective brainstorming sessions can be conducted using the wide variety of slides added in this complete deck. Apart from this, our PPT design contains clear instructions to help you restructure your presentations and create multiple variations. The color, format, design anything can be modified as deemed fit by the user. Not only this, it is available for immediate download. So, grab it now.

Supplier Mini Profiles For Business Analytics Transformation Ppt PowerPoint Presentation Complete With Slides
Boost your confidence and team morale with this well-structured Supplier Mini Profiles For Business Analytics Transformation Ppt PowerPoint Presentation Complete With Slides. This prefabricated set gives a voice to your presentation because of its well-researched content and graphics. Our experts have added all the components very carefully, thus helping you deliver great presentations with a single click. Not only that, it contains a set of tweleve slides that are designed using the right visuals, graphics, etc. Various topics can be discussed, and effective brainstorming sessions can be conducted using the wide variety of slides added in this complete deck. Apart from this, our PPT design contains clear instructions to help you restructure your presentations and create multiple variations. The color, format, design anything can be modified as deemed fit by the user. Not only this, it is available for immediate download. So, grab it now.

Competency Framework For Business Analytics Transformation Ppt PowerPoint Presentation Complete With Slides
Boost your confidence and team morale with this well-structured Competency Framework For Business Analytics Transformation Ppt PowerPoint Presentation Complete With Slides. This prefabricated set gives a voice to your presentation because of its well-researched content and graphics. Our experts have added all the components very carefully, thus helping you deliver great presentations with a single click. Not only that, it contains a set of eighteen slides that are designed using the right visuals, graphics, etc. Various topics can be discussed, and effective brainstorming sessions can be conducted using the wide variety of slides added in this complete deck. Apart from this, our PPT design contains clear instructions to help you restructure your presentations and create multiple variations. The color, format, design anything can be modified as deemed fit by the user. Not only this, it is available for immediate download. So, grab it now.

Business Analytics Application Impact Of BI Application In Enhancing Business Formats PDF
This slide represents the importance of business intelligence in enabling the businesses to have insights into what their competitors are doing and enabling them to make informed and educated decisions. It includes various benefits of BI such as data visualization, speed and competitive advantage etc. Welcome to our selection of the Business Analytics Application Impact Of BI Application In Enhancing Business Formats PDF. These are designed to help you showcase your creativity and bring your sphere to life. Planning and Innovation are essential for any business that is just starting out. This collection contains the designs that you need for your everyday presentations. All of our PowerPoints are 100 percent editable, so you can customize them to suit your needs. This multi-purpose template can be used in various situations. Grab these presentation templates today.

Human Resource Analytics Data Warehouse And Olap Cubes Business Intelligence Professional PDF
This slide represents the data warehouse and OLAP cubes architecture of business intelligence. It includes key recommendations such as used by companies of all sizes etc. Are you in need of a template that can accommodate all of your creative concepts This one is crafted professionally and can be altered to fit any style. Use it with Google Slides or PowerPoint. Include striking photographs, symbols, depictions, and other visuals. Fill, move around, or remove text boxes as desired. Test out color palettes and font mixtures. Edit and save your work, or work with colleagues. Download Human Resource Analytics Data Warehouse And Olap Cubes Business Intelligence Professional PDF and observe how to make your presentation outstanding. Give an impeccable presentation to your group and make your presentation unforgettable.
Optimizing Marketing Analytics To Enhance Organizational Growth Ppt PowerPoint Presentation Complete Deck With Slides
This Optimizing Marketing Analytics To Enhance Organizational Growth Ppt PowerPoint Presentation Complete Deck With Slides is designed to help you retain your audiences attention. This content ready PowerPoint Template enables you to take your audience on a journey and share information in a way that is easier to recall. It helps you highlight the crucial parts of your work so that the audience does not get saddled with information download. This sixty five slide PPT Deck comes prepared with the graphs and charts you could need to showcase your information through visuals. You only need to enter your own data in them. Download this editable PowerPoint Theme and walk into that meeting with confidence.

Tools For HR Business Analytics Data Warehouse And Data Marts Business Intelligence Introduction PDF
This slide represents the data warehouse and data marts architecture of business intelligence. It includes key recommendations such as utilized for distributing required information to each department etc. Are you in need of a template that can accommodate all of your creative concepts This one is crafted professionally and can be altered to fit any style. Use it with Google Slides or PowerPoint. Include striking photographs, symbols, depictions, and other visuals. Fill, move around, or remove text boxes as desired. Test out color palettes and font mixtures. Edit and save your work, or work with colleagues. Download Tools For HR Business Analytics Data Warehouse And Data Marts Business Intelligence Introduction PDF and observe how to make your presentation outstanding. Give an impeccable presentation to your group and make your presentation unforgettable.

Online Marketing Analytics To Enhance Business Growth Cost Effectiveness Analysis To Evaluate Impact Guidelines PDF
This slide covers the cost-effectiveness analysis to identify the best-performing and worst-performing marketing channels. It includes cost and conversion analysis of channels such as landing page website, SEO, paid search, social media, blogging, etc. Are you in need of a template that can accommodate all of your creative concepts This one is crafted professionally and can be altered to fit any style. Use it with Google Slides or PowerPoint. Include striking photographs, symbols, depictions, and other visuals. Fill, move around, or remove text boxes as desired. Test out color palettes and font mixtures. Edit and save your work, or work with colleagues. Download Online Marketing Analytics To Enhance Business Growth Cost Effectiveness Analysis To Evaluate Impact Guidelines PDF and observe how to make your presentation outstanding. Give an impeccable presentation to your group and make your presentation unforgettable.
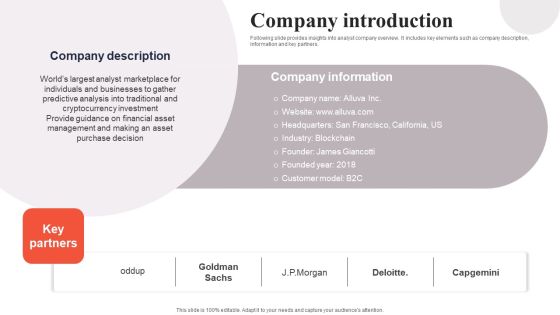
Financial Analytics Solution Investor Funding Elevator Pitch Deck Company Introduction Infographics PDF
Following slide provides insights into analyst company overview. It includes key elements such as company description, information and key partners. Are you in need of a template that can accommodate all of your creative concepts This one is crafted professionally and can be altered to fit any style. Use it with Google Slides or PowerPoint. Include striking photographs, symbols, depictions, and other visuals. Fill, move around, or remove text boxes as desired. Test out color palettes and font mixtures. Edit and save your work, or work with colleagues. Download Financial Analytics Solution Investor Funding Elevator Pitch Deck Company Introduction Infographics PDF and observe how to make your presentation outstanding. Give an impeccable presentation to your group and make your presentation unforgettable.

Augmented Analytics Implementation IT Ppt PowerPoint Presentation Complete Deck With Slides
This complete deck covers various topics and highlights important concepts. It has PPT slides which cater to your business needs. This complete deck presentation emphasizes Augmented Analytics Implementation IT Ppt PowerPoint Presentation Complete Deck With Slides and has templates with professional background images and relevant content. This deck consists of total of fifty three slides. Our designers have created customizable templates, keeping your convenience in mind. You can edit the colour, text and font size with ease. Not just this, you can also add or delete the content if needed. Get access to this fully editable complete presentation by clicking the download button below.

Need For Business Analytics Transformation Ppt PowerPoint Presentation Complete Deck With Slides
This complete deck covers various topics and highlights important concepts. It has PPT slides which cater to your business needs. This complete deck presentation emphasizes Need For Business Analytics Transformation Ppt PowerPoint Presentation Complete Deck With Slides and has templates with professional background images and relevant content. This deck consists of total of seventeen slides. Our designers have created customizable templates, keeping your convenience in mind. You can edit the colour, text and font size with ease. Not just this, you can also add or delete the content if needed. Get access to this fully editable complete presentation by clicking the download button below.

Business Analytics Application Comparative Analysis Of ETL Tools For Data Integration Background PDF
This slide represents comparison between various ETL tools to help organization select the best ETL tool for integrating data. It includes comparison between ETL tools on the basis of criterias such as ease-of-use, reusability etc. If your project calls for a presentation, then Slidegeeks is your go-to partner because we have professionally designed, easy-to-edit templates that are perfect for any presentation. After downloading, you can easily edit Business Analytics Application Comparative Analysis Of ETL Tools For Data Integration Background PDF and make the changes accordingly. You can rearrange slides or fill them with different images. Check out all the handy templates.

BI Implementation To Enhance Hiring Process Training Plan For Hr Analytics Software Themes PDF
This slide represents the plan prepared for facilitating training to employees related to usage of implemented business intelligence software. It includes details related to training topic, methods, date, trainer and budget.If your project calls for a presentation, then Slidegeeks is your go-to partner because we have professionally designed, easy-to-edit templates that are perfect for any presentation. After downloading, you can easily edit BI Implementation To Enhance Hiring Process Training Plan For Hr Analytics Software Themes PDF and make the changes accordingly. You can rearrange slides or fill them with different images. Check out all the handy templates.
Online Marketing Analytics To Enhance Business Growth Website Landing Page KPI Tracking Dashboard Sample PDF
This slide covers a dashboard for analyzing the metrics of the website landing page. It includes KPIs such as conversions, conversion rate, sessions, bounce rate, engagement sickness, etc. If your project calls for a presentation, then Slidegeeks is your go to partner because we have professionally designed, easy to edit templates that are perfect for any presentation. After downloading, you can easily edit Online Marketing Analytics To Enhance Business Growth Website Landing Page KPI Tracking Dashboard Sample PDF and make the changes accordingly. You can rearrange slides or fill them with different images. Check out all the handy templates

Financial Analytics Solution Investor Funding Elevator Pitch Deck Business Model Guidelines PDF
Following slide provides information about the company business model canvas. It includes key points such as key partners, activities, value propositions, customer relations, customer segments, key resources, cost structure, channels, and revenue sources. If your project calls for a presentation, then Slidegeeks is your go to partner because we have professionally designed, easy to edit templates that are perfect for any presentation. After downloading, you can easily edit Financial Analytics Solution Investor Funding Elevator Pitch Deck Business Model Guidelines PDF and make the changes accordingly. You can rearrange slides or fill them with different images. Check out all the handy templates
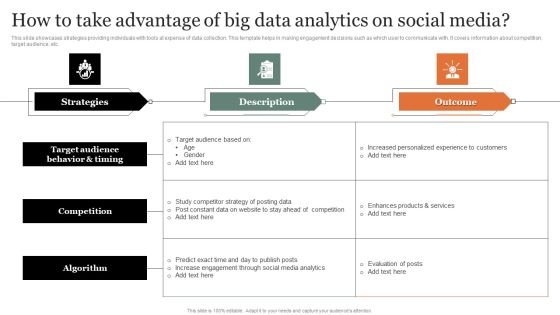
How To Take Advantage Of Big Data Analytics On Social Media Infographics PDF
This slide showcases strategies providing individuals with tools at expense of data collection. This template helps in making engagement decisions such as which user to communicate with. It covers information about competition, target audience, etc. Pitch your topic with ease and precision using this How To Take Advantage Of Big Data Analytics On Social Media Infographics PDF Graphics. This layout presents information on Target Audience Behavior, Competition, Algorithm. It is also available for immediate download and adjustment. So, changes can be made in the color, design, graphics or any other component to create a unique layout.
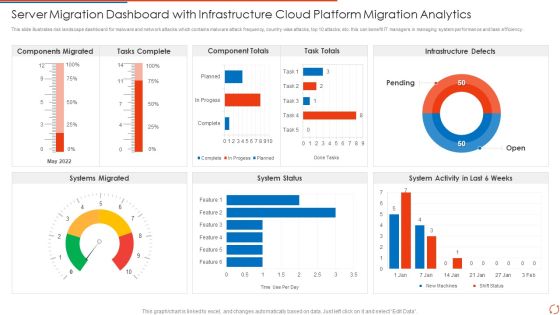
Server Migration Dashboard With Infrastructure Cloud Platform Migration Analytics Elements PDF Portrait PDF
This slide illustrates risk landscape dashboard for malware and network attacks which contains malware attack frequency, country wise attacks, top 10 attacks, etc. this can benefit IT managers in managing system performance and task efficiency Pitch your topic with ease and precision using this Server Migration Dashboard With Infrastructure Cloud Platform Migration Analytics Elements PDF Portrait PDF. This layout presents information on Tasks Complete, Component Totals, Task Totals. It is also available for immediate download and adjustment. So, changes can be made in the color, design, graphics or any other component to create a unique layout.

Value Streams For Business Analytics Transformation Ppt PowerPoint Presentation Complete Deck With Slides
Pitch yourself both in house and outside by utilizing this complete deck. This Value Streams For Business Analytics Transformation Ppt PowerPoint Presentation Complete Deck With Slides focuses on key fundamentals of the topic, displayed using different slides. With a total of fifteen slides, this template is the best tool you can use to persuade your audience. It will not only help you create great presentations but also induce strategic thinking because of its well researched content and graphics. You can easily personalize any of the elements to suit your unique business setting. Additionally, it can be saved in PNG, JPG, and PDF formats to save your time and resources.

Retail Outlet Operational Efficiency Analytics Ppt PowerPoint Presentation Complete Deck With Slides
Pitch yourself both in house and outside by utilizing this complete deck. This Retail Outlet Operational Efficiency Analytics Ppt PowerPoint Presentation Complete Deck With Slides focuses on key fundamentals of the topic, displayed using different slides. With a total of ninty two slides, this template is the best tool you can use to persuade your audience. It will not only help you create great presentations but also induce strategic thinking because of its well researched content and graphics. You can easily personalize any of the elements to suit your unique business setting. Additionally, it can be saved in PNG, JPG, and PDF formats to save your time and resources.

Customer Behavior Analytics Dashboard To Improve Satisfaction Ppt File Infographics PDF
The following slide provides an insight of websites performance that includes date parameters. The dashboard includes sessions, users, pageviews, bounce rate and percentage of new sessions. Pitch your topic with ease and precision using this Customer Behavior Analytics Dashboard To Improve Satisfaction Ppt File Infographics PDF. This layout presents information on Session, Avg Session Duration, Bounce Rate. It is also available for immediate download and adjustment. So, changes can be made in the color, design, graphics or any other component to create a unique layout.
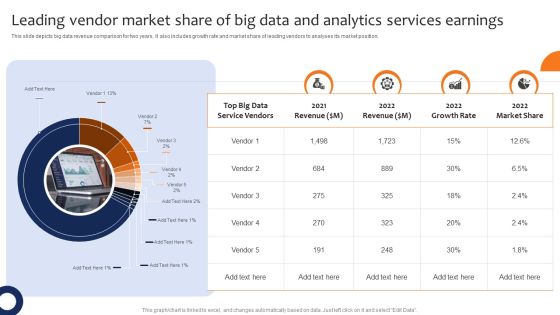
Leading Vendor Market Share Of Big Data And Analytics Services Earnings Professional PDF
This slide depicts big data revenue comparison for two years. It also includes growth rate and market share of leading vendors to analyses its market position. Pitch your topic with ease and precision using this Leading Vendor Market Share Of Big Data And Analytics Services Earnings Professional PDF. This layout presents information on Revenue, Growth Rate, Market Share. It is also available for immediate download and adjustment. So, changes can be made in the color, design, graphics or any other component to create a unique layout.

Types Of Big Data Analytics Procedure For Effective Decision Making Microsoft PDF
This slide illustrate four different types of big data analysis processes along with their tools used and business applications. It includes analysis such as descriptive, diagnostic, predictive and prescriptive Pitch your topic with ease and precision using this Types Of Big Data Analytics Procedure For Effective Decision Making Microsoft PDF. This layout presents information on Descriptive Analysis, Diagnostic Analysis, Predictive Analysis. It is also available for immediate download and adjustment. So, changes can be made in the color, design, graphics or any other component to create a unique layout.

Brand Analytics Kpi Dashboard For Organization Ppt Portfolio Graphics Design PDF
The following slide outlines key performance indicator KPI dashboard that can assist marketers to evaluate brand performance on social media channels. The metrics covered are age group, gender, brand perception, branding themes, celebrity analysis, etc. Boost your pitch with our creative Brand Analytics Kpi Dashboard For Organization Ppt Portfolio Graphics Design PDF. Deliver an awe inspiring pitch that will mesmerize everyone. Using these presentation templates you will surely catch everyones attention. You can browse the ppts collection on our website. We have researchers who are experts at creating the right content for the templates. So you do not have to invest time in any additional work. Just grab the template now and use them.

Tools For HR Business Analytics HR Talent Management Key Metrics Structure PDF
This slide represents the KPI dashboard to track and monitor management of talent by the HR department. It includes details related to talent satisfaction, talent turnover rate, fired talents etc. This modern and well-arranged Tools For HR Business Analytics HR Talent Management Key Metrics Structure PDF provides lots of creative possibilities. It is very simple to customize and edit with the Powerpoint Software. Just drag and drop your pictures into the shapes. All facets of this template can be edited with Powerpoint, no extra software is necessary. Add your own material, put your images in the places assigned for them, adjust the colors, and then you can show your slides to the world, with an animated slide included.

Information Analytics Company Outline ESG Performance Carbon Emissions And Energy Use Demonstration PDF
This slide highlights the Experian environment, social and governance which showcase total energy use, carbon emissions, and renewable electricity uses in last 3 years. This modern and well arranged Information Analytics Company Outline ESG Performance Carbon Emissions And Energy Use Demonstration PDF provides lots of creative possibilities. It is very simple to customize and edit with the Powerpoint Software. Just drag and drop your pictures into the shapes. All facets of this template can be edited with Powerpoint no extra software is necessary. Add your own material, put your images in the places assigned for them, adjust the colors, and then you can show your slides to the world, with an animated slide included.
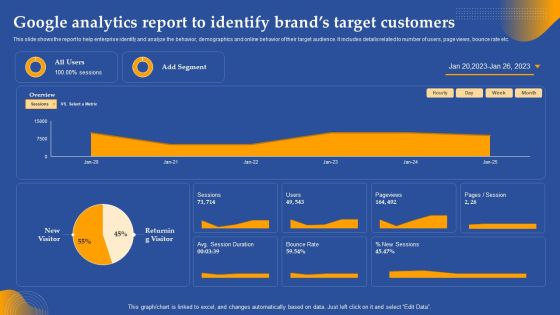
Google Analytics Report To Identify Brands Target Customers Ppt Inspiration Skills PDF
This slide shows the report to help enterprise identify and analyze the behavior, demographics and online behavior of their target audience. It includes details related to number of users, page views, bounce rate etc. This modern and well arranged Google Analytics Report To Identify Brands Target Customers Ppt Inspiration Skills PDF provides lots of creative possibilities. It is very simple to customize and edit with the Powerpoint Software. Just drag and drop your pictures into the shapes. All facets of this template can be edited with Powerpoint no extra software is necessary. Add your own material, put your images in the places assigned for them, adjust the colors, and then you can show your slides to the world, with an animated slide included.

Google Analytics Report To Identify Brands Target Customers Ppt Layouts Tips PDF
This slide shows the report to help enterprise identify and analyze the behavior, demographics and online behavior of their target audience. It includes details related to number of users, page views, bounce rate etc. This modern and well arranged Google Analytics Report To Identify Brands Target Customers Ppt Layouts Tips PDF provides lots of creative possibilities. It is very simple to customize and edit with the Powerpoint Software. Just drag and drop your pictures into the shapes. All facets of this template can be edited with Powerpoint no extra software is necessary. Add your own material, put your images in the places assigned for them, adjust the colors, and then you can show your slides to the world, with an animated slide included.

Big Data Analytics Framework Business Intelligence Ppt PowerPoint Presentation Complete Deck
Improve your presentation delivery using this big data analytics framework business intelligence ppt powerpoint presentation complete deck. Support your business vision and objectives using this well-structured PPT deck. This template offers a great starting point for delivering beautifully designed presentations on the topic of your choice. Comprising twelve slides this professionally designed template is all you need to host discussion and meetings with collaborators. Each slide is self-explanatory and equipped with high-quality graphics that can be adjusted to your needs. Therefore, you will face no difficulty in portraying your desired content using this PPT slideshow. This PowerPoint slideshow contains every important element that you need for a great pitch. It is not only editable but also available for immediate download and utilization. The color, font size, background, shapes everything can be modified to create your unique presentation layout. Therefore, download it now.

 Home
Home