Visual Analytics
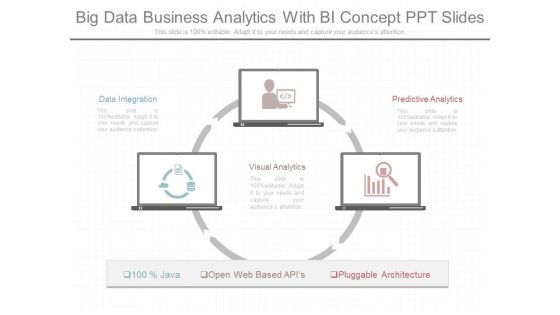
Big Data Business Analytics With Bi Concept Ppt Slides
This is a big data business analytics with bi concept ppt slides. This is a three stage process. The stages in this process are data integration, visual analytics, predictive analytics, open web based apis, pluggable architecture, java.
Expert Systems Advanced Analytics Techniques Icons PDF
Presenting expert systems advanced analytics techniques icons pdf to provide visual cues and insights. Share and navigate important information on three stages that need your due attention. This template can be used to pitch topics like business intelligence, clickstream, analytics, data mining, planning. In addtion, this PPT design contains high-resolution images, graphics, etc, that are easily editable and available for immediate download.
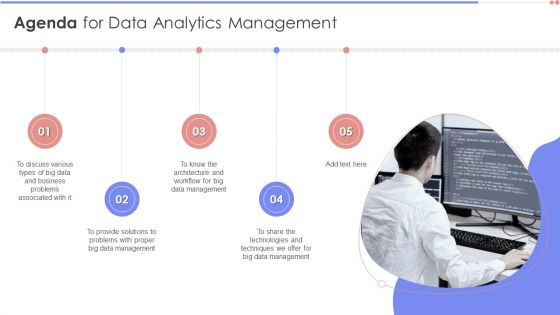
Agenda For Data Analytics Management Diagrams PDF
Presenting Agenda For Data Analytics Management Diagrams PDF to provide visual cues and insights. Share and navigate important information on five stages that need your due attention. This template can be used to pitch topics like Agenda. In addtion, this PPT design contains high resolution images, graphics, etc, that are easily editable and available for immediate download.
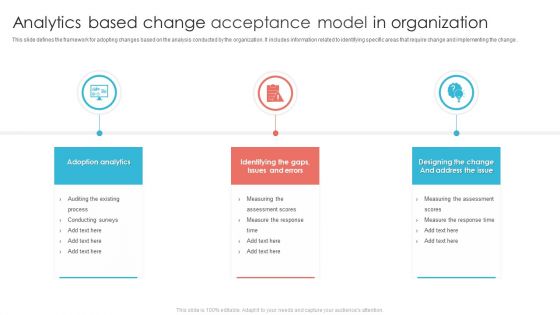
Analytics Based Change Acceptance Model In Organization Ppt PowerPoint Presentation Infographics Visual Aids PDF
This slide defines the framework for adopting changes based on the analysis conducted by the organization. It includes information related to identifying specific areas that require change and implementing the change .Presenting Analytics Based Change Acceptance Model In Organization Ppt PowerPoint Presentation Infographics Visual Aids PDF to dispense important information. This template comprises three stages. It also presents valuable insights into the topics including Adoption Analytics, Designing Change, Measuring Assessment. This is a completely customizable PowerPoint theme that can be put to use immediately. So, download it and address the topic impactfully.

Data Analytics IT Tasks And Skills Of Machine Learning Engineer Ppt Gallery Visual Aids PDF
This slide represents the machine learning engineers tasks and skills, including a deep knowledge of machine learning, ML algorithms, and Python and C. This is a data analytics it tasks and skills of machine learning engineer ppt gallery visual aids pdf template with various stages. Focus and dispense information on six stages using this creative set, that comes with editable features. It contains large content boxes to add your information on topics like knowledge of machine learning, python, c plus, ml algorithms. You can also showcase facts, figures, and other relevant content using this PPT layout. Grab it now.
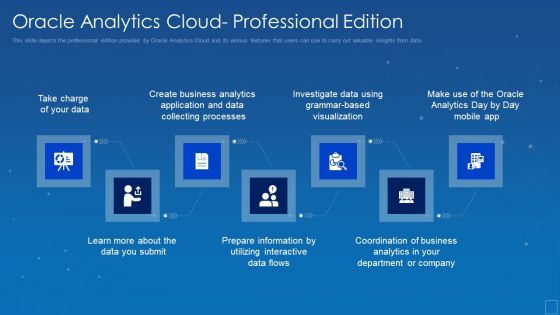
Oracle Analytics Cloud Professional Edition Graphics PDF
This slide defines the collaboration and publishing cloud solution of Oracle Analytics and how it encourages teamwork in the organizations. Presenting oracle analytics cloud professional edition graphics pdf to provide visual cues and insights. Share and navigate important information on seven stages that need your due attention. This template can be used to pitch topics like oracle analytics cloud solutions collaboration and publishing. In addtion, this PPT design contains high resolution images, graphics, etc, that are easily editable and available for immediate download.
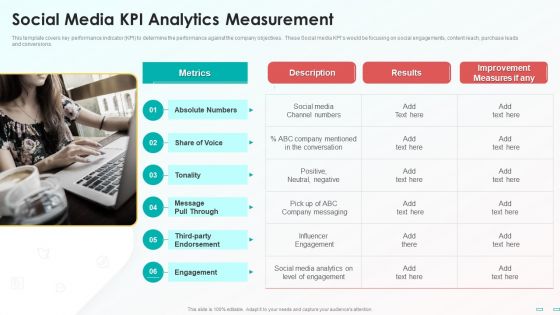
Social Media Kpi Analytics Measurement Demonstration PDF
This template covers key performance indicator KPI to determine the performance against the company objectives. These Social media KPIs would be focusing on social engagements, content reach, purchase leads and conversions. Presenting Social Media Kpi Analytics Measurement Demonstration PDF to provide visual cues and insights. Share and navigate important information on one stages that need your due attention. This template can be used to pitch topics like Metrics, Social Media, Improvement Measures. In addtion, this PPT design contains high resolution images, graphics, etc, that are easily editable and available for immediate download.
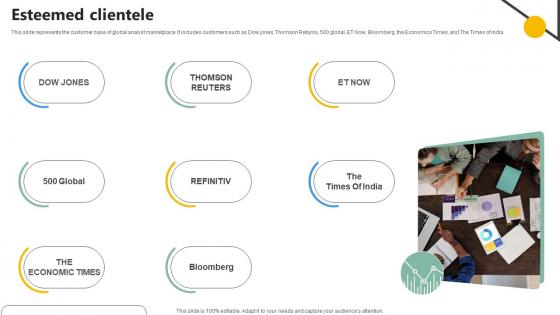
Esteemed Clientele Analytics Company Investor Funding Elevator
This slide represents the customer base of global analyst marketplace. It includes customers such as Dow jones, Thomson Returns, 500 global, ET Now, Bloomberg, the Economics Times, and The Times of India.The best PPT templates are a great way to save time, energy, and resources. Slidegeeks have 100 percent editable powerpoint slides making them incredibly versatile. With these quality presentation templates, you can create a captivating and memorable presentation by combining visually appealing slides and effectively communicating your message. Download Esteemed Clientele Analytics Company Investor Funding Elevator from Slidegeeks and deliver a wonderful presentation.

Big Data Analytics Framework Layers Formats PDF
This slide illustrate four different layer of big data pipeline architecture to support activities related to data management. It includes layers such as data ingestion, processing, storage and visualization Persuade your audience using this Benefits Of Big Data And Analytics Framework For Organization Development Guidelines PDF. This PPT design covers four stages, thus making it a great tool to use. It also caters to a variety of topics including Data Ingestion, Data Processing, Data Storage. Download this PPT design now to present a convincing pitch that not only emphasizes the topic but also showcases your presentation skills.

Data Service Analytics Diagram Ppt Inspiration
This is a data service analytics diagram ppt inspiration. This is a eight stage process. The stages in this process are traffic demand estimation, policy control analytics, data processing, device analytics, service quality analytics, charging verification, productivity, statistical research.
Customer Analytics Ppt PowerPoint Presentation Information
This is a customer analytics ppt powerpoint presentation information. This is a four stage process. The stages in this process are customer analytics.

Analytics Solutions Diagram Sample Of Ppt Presentation
This is a analytics solutions diagram sample of ppt presentation. This is a four stage process. The stages in this process are analytic applications, analytics, data sources, business intelligence.

Analytics Insights Planning Template Ppt Slides
This is a analytics insights planning template ppt slides. This is a nine stage process. The stages in this process are buy, explore, discover, public relations, advertising, customer analytics, customer communication, customer experiences, marketing, analytics insights planning.
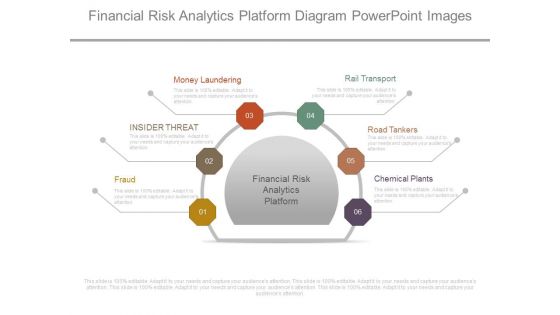
Financial Risk Analytics Platform Diagram Powerpoint Images
This is a financial risk analytics platform diagram powerpoint images. This is a six stage process. The stages in this process are money laundering, insider threat, fraud, rail transport, road tankers, chemical plants, financial risk analytics platform.
Analytics Insights Planning Template Ppt Images Gallery
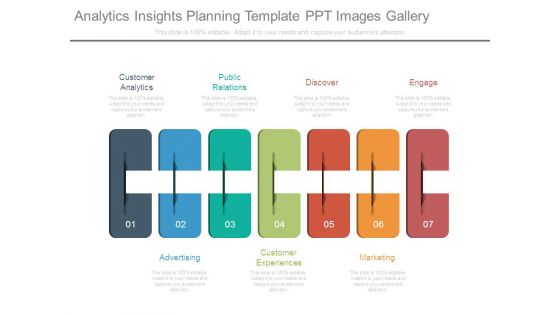
This is a analytics insights planning template ppt images gallery. This is a seven stage process. The stages in this process are customer analytics, public relations, discover, engage, marketing, customer experiences, advertising.

Analytics Maturity Ppt Powerpoint Slide Background Designs
This is a analytics maturity ppt powerpoint slide background designs. This is a four stage process. The stages in this process are competitive advantage, analytics maturity, sense and respond, predict and analysis.
Customizable Dashboard Enhanced Analytics Powerpoint Slides
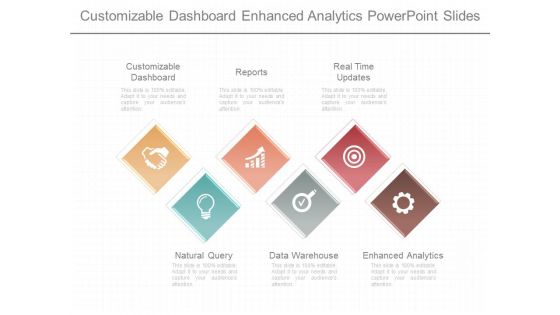
This is a customizable dashboard enhanced analytics powerpoint slides. This is a six stage process. The stages in this process are customizable dashboard, reports, real time updates, natural query, data warehouse, enhanced analytics.

Data Modeling And Analytics Example Ppt Presentation
This is a data modeling and analytics example ppt presentation. This is a four stage process. The stages in this process are data modeling, data migration, balance data, explore data, data modeling and analytics.

Analytics Support Powerpoint Slide Background Designs
This is a analytics support powerpoint slide background designs. This is a three stage process. The stages in this process are supplemental plans, benefit coding, analytics support.

Business Environment Video Analytics Diagram Powerpoint Ideas
This is a business environment video analytics diagram powerpoint ideas. This is a four stage process. The stages in this process are camera, nvr, analytic server, remote client.

Centralized Data Analytics Team Structure Clipart PDF
This slide shows the model representing the structure of the centralized data analytics team. It includes key stakeholders such as vice president, centralized data analytics team, and analysts of units A,B and C.Persuade your audience using this Centralized Data Analytics Team Structure Clipart PDF. This PPT design coversone stage, thus making it a great tool to use. It also caters to a variety of topics including Vice President, Data Analytics, Analytics Team. Download this PPT design now to present a convincing pitch that not only emphasizes the topic but also showcases your presentation skills.

Process Of Retail Site Analytics Ppt Model
This is a process of retail site analytics ppt model. This is a four stage process. The stages in this process are visualization, customer info, salesperson, shopper.
Web Analytics Metrics Powerpoint Slide Templates Download
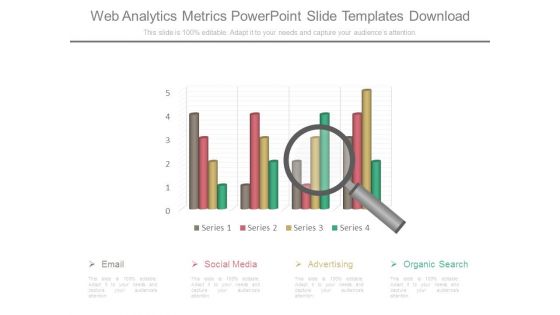
This is a web analytics metrics powerpoint slide templates download. This is a one stage process. The stages in this process are email, social media, advertising, organic search.

Organization Production Analytics Diagram Powerpoint Images
This is a organization production analytics diagram powerpoint images. This is a four stage process. The stages in this process are brand definition, creative platform, communication strategy, activation.

Marketing Analytics Powerpoint Slide Background Designs
This is a marketing analytics powerpoint slide background designs. This is a four stage process. The stages in this process are email marketing, social media marketing.

Pricing Analytics Diagram Sample Of Ppt Presentation
This is a pricing analytics diagram sample of ppt presentation. This is a three stage process. The stages in this process are internet marketing, marketing plans, seo.
Cloud Analytics Strategy Sample Diagram Powerpoint Guide
This is a cloud analytics strategy sample diagram powerpoint guide. This is a one stage process. The stages in this process are business, marketing, thought, presentation, strategy.
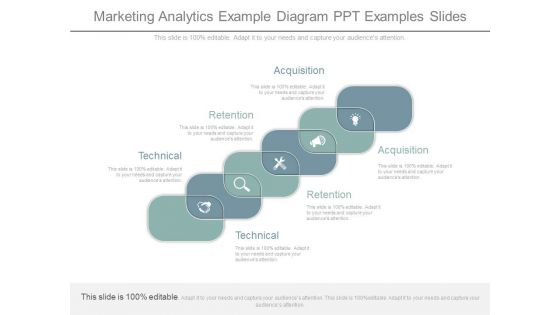
Marketing Analytics Example Diagram Ppt Examples Slides
This is a marketing analytics example diagram ppt examples slides. This is a six stage process. The stages in this process are acquisition, retention, technical.
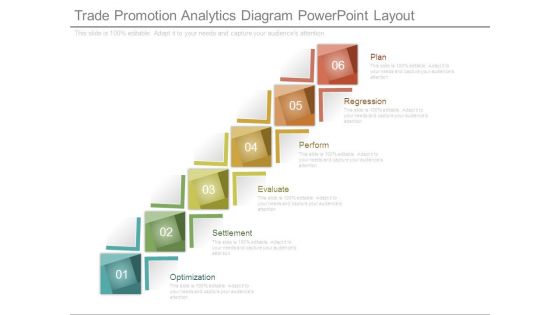
Trade Promotion Analytics Diagram Powerpoint Layout
This is a trade promotion analytics diagram powerpoint layout. This is a six stage process. The stages in this process are plan, regression, perform, evaluate, settlement, optimization.
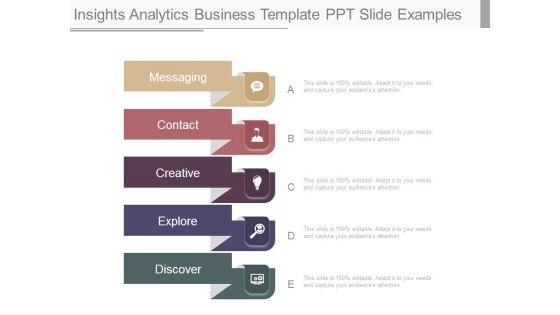
Insights Analytics Business Template Ppt Slide Examples
This is a insights analytics business template ppt slide examples. This is a five stage process. The stages in this process are messaging, contact, creative, explore, discover.

Marketing Analytics Technology Template Ppt Sample Download
This is a marketing analytics technology template ppt sample download. This is a six stage process. The stages in this process are strategy, technology, traffic, marketing, volume, shares.
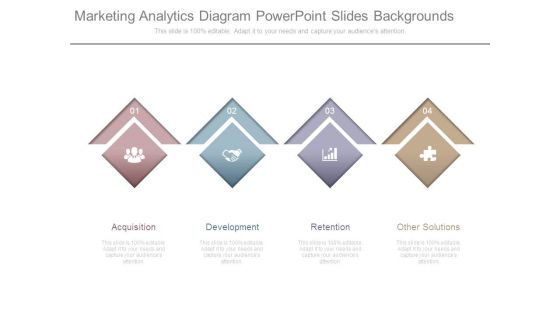
Marketing Analytics Diagram Powerpoint Slides Backgrounds
This is a marketing analytics diagram powerpoint slides backgrounds. This is a four stage process. The stages in this process are acquisition, development, retention, other solutions.

Strategy Analytics Ppt Layout Powerpoint Slide
This is a strategy analytics ppt layout powerpoint slide. This is a four stage process. The stages in this process are team, data, processes, data analysis.
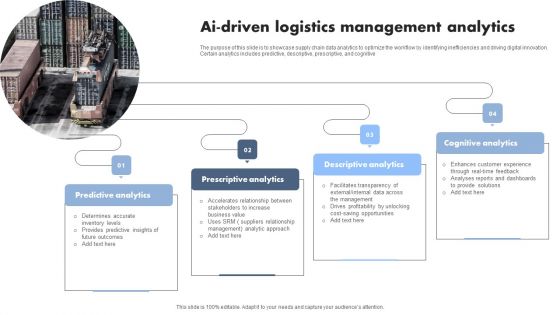
AI Driven Logistics Management Analytics Professional PDF
The purpose of this slide is to showcase supply chain data analytics to optimize the workflow by identifying inefficiencies and driving digital innovation. Certain analytics includes predictive, descriptive, prescriptive, and cognitive. Presenting AI Driven Logistics Management Analytics Professional PDF to dispense important information. This template comprises four stages. It also presents valuable insights into the topics including Predictive Analytics, Prescriptive Analytics, Descriptive Analytics. This is a completely customizable PowerPoint theme that can be put to use immediately. So, download it and address the topic impactfully.
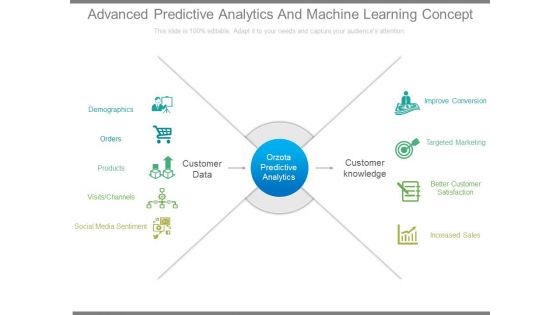
Advanced Predictive Analytics And Machine Learning Concept
This is a advanced predictive analytics and machine learning concept. This is a nine stage process. The stages in this process are demographics, orders, products, visits channels, social media sentiment, customer data, orzota predictive analytics, customer knowledge, improve conversion, targeted marketing, better customer satisfaction, increased sales.

Analytics Solutions Sample Of Ppt Presentation
This is a analytics solutions sample of ppt presentation. This is a eight stage process. The stages in this process are information sources, analytics solutions, system infrastructure, social network, big data, data discovery, data analysis, reports and dashboards.
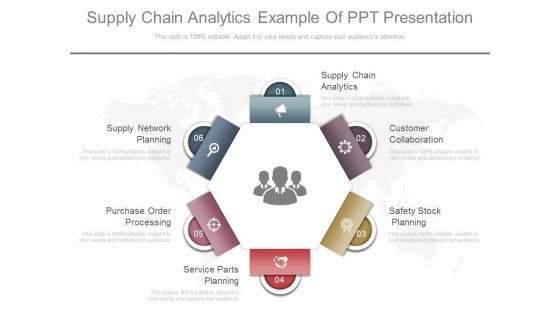
Supply Chain Analytics Example Of Ppt Presentation
This is a supply chain analytics example of ppt presentation. This is a six stage process. The stages in this process are supply chain analytics, customer collaboration, safety stock planning, purchase order processing, supply network planning, safety stock planning.

Unified Customer Experience Analytics Ppt Design
This is a unified customer experience analytics ppt design. This is a four stage process. The stages in this process are cross channel customer experience, unified customer experience analytics, sales, performance, key business result area.

Business Analytics Lab Example Of Ppt
This is a business analytics lab example of ppt. This is a four stage process. The stages in this process are managerial and organizational economics, business analytics, sustainable, interdisciplinary management factory.
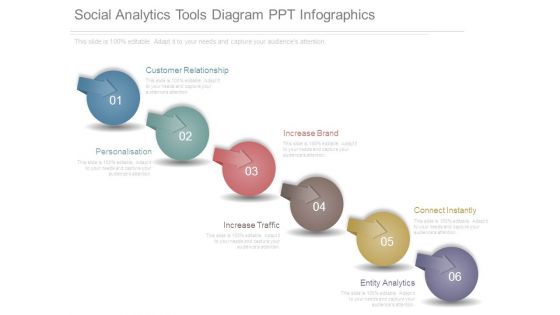
Social Analytics Tools Diagram Ppt Infographics
This is a social analytics tools diagram ppt infographics. This is a six stage process. The stages in this process are customer relationship, personalisation, increase brand, increase traffic, connect instantly, entity analytics.

Marketing Analytics Example Diagram Ppt Inspiration
This is a marketing analytics example diagram ppt inspiration. This is a six stage process. The stages in this process are marketing analytics, development, analysis, strategy, acquisition, retention, other solutions.

Analytics Strategy For Organizational Goals Clipart PDF
Presenting analytics strategy for organizational goals clipart pdf. to dispense important information. This template comprises six stages. It also presents valuable insights into the topics including business context, organization, analytics platform, analytics goals. This is a completely customizable PowerPoint theme that can be put to use immediately. So, download it and address the topic impactfully.
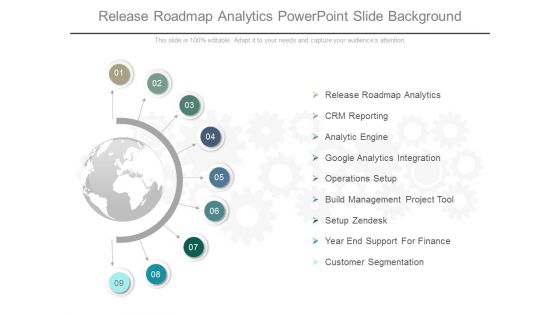
Release Roadmap Analytics Powerpoint Slide Background
This is a release roadmap analytics powerpoint slide background. This is a nine stage process. The stages in this process are release roadmap analytics, crm reporting, analytic engine, google analytics integration, operations setup, build management project tool, setup zendesk, year end support for finance, customer segmentation.
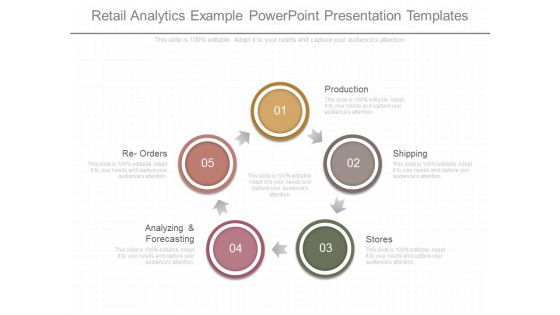
Retail Analytics Example Powerpoint Presentation Templates
This is a retail analytics example powerpoint presentation templates. This is a five stage process. The stages in this process are production, shipping, stores, analyzing and forecasting, re orders.

Social Media Management Analytics Dashboards Powerpoint Slides
This is a social media management analytics dashboards powerpoint slides. This is a four stage process. The stages in this process are reach and engagement, audience profile, traffic, audience size, sentiment analysis, content analysis, competitive benchmarking, community responsiveness.\n\n\n\n\n\n

Event Marketing Analytics Example Powerpoint Shapes
This is a event marketing analytics example powerpoint shapes. This is a seven stage process. The stages in this process are growing fans, engaging users, going viral, driving roi, advertising, promotions, cross functional.

Sample Of Internet Analytics Template Powerpoint Themes
This is a sample of internet analytics template powerpoint themes. This is a six stage process. The stages in this process are improve or eliminate, analyze, action, define, measure, reinforce clarity.

Sales Analytics Business Template Ppt Design
This is a sales analytics business template ppt design. This is a six stage process. The stages in this process are identify customer, create brand identify, develop pricing strategy, relate to customers, case management, assurance.

Customer Experience Analytics Example Ppt Infographic Template
This is a customer experience analytics example ppt infographic template. This is a six stage process. The stages in this process are resource fluidity, measurement, priorities, process, leadership edge, enterprise culture.
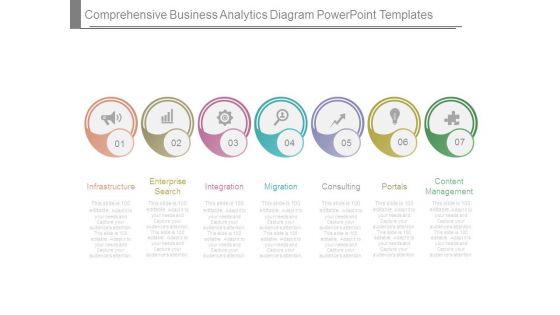
Comprehensive Business Analytics Diagram Powerpoint Templates
This is a comprehensive business analytics diagram powerpoint templates. This is a seven stage process. The stages in this process are infrastructure, enterprise search, integration, migration, consulting, portals, content management.
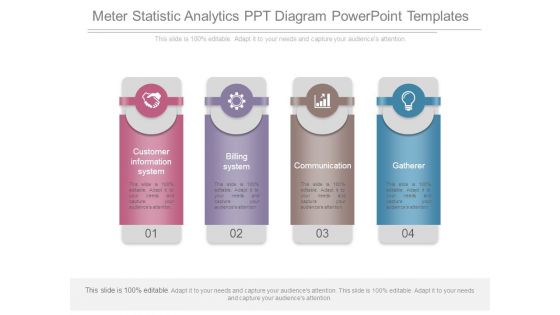
Meter Statistic Analytics Ppt Diagram Powerpoint Templates
This is a meter statistic analytics ppt diagram powerpoint templates. This is a four stage process. The stages in this process are customer information system, billing system, communication, gatherer.
Closed Loop Analytics Layout Powerpoint Slide Designs
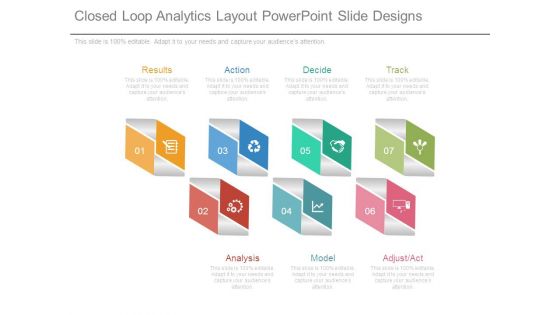
This is a closed loop analytics layout powerpoint slide designs. This is a seven stage process. The stages in this process are results, action, decide, track, analysis, model, adjust act.

Marketing Analytics Ppt Template Powerpoint Slide Introduction
This is a marketing analytics ppt template powerpoint slide introduction. This is a six stage process. The stages in this process are reporting intelligence, acquisition, development, pricing strategy, product design, other solution.

Marketing Analytics Technology Template Ppt Sample File
This is a marketing analytics technology template ppt sample file. This is a five stage process. The stages in this process are profile, associate, product design, marketing roi, predict.
Web Analytics Diagram Ppt Slides Themes
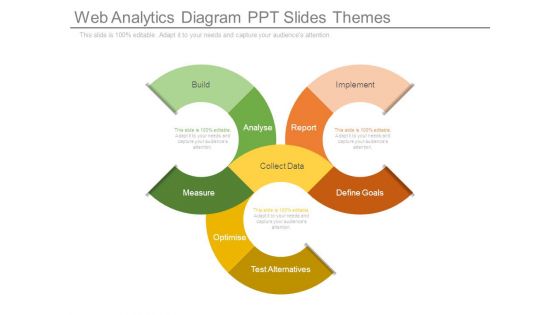
This is a web analytics diagram ppt slides themes. This is a three stage process. The stages in this process are build, analyse, measure, test alternatives, optimise, collect data, define goals, report, implement.
Web Analytics Process Diagram Presentation Backgrounds
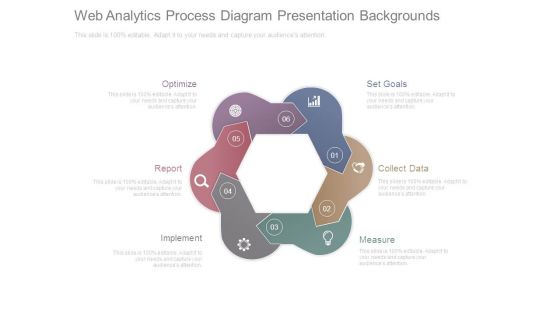
This is a web analytics process diagram presentation backgrounds. This is a six stage process. The stages in this process are optimize, report, implement, measure, collect data, set goals.
Online Product Positioning Analytics Powerpoint Guide
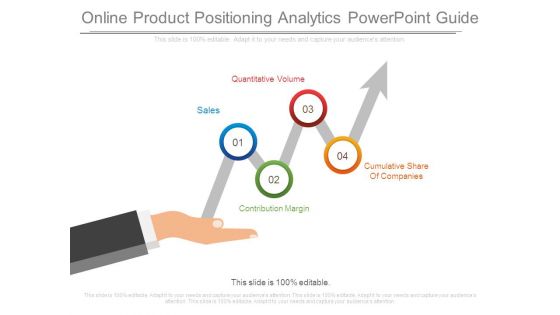
This is a online product positioning analytics powerpoint guide. This is a four stage process. The stages in this process are sales, quantitative volume, contribution margin, cumulative share of companies.

Effective Marketing Analytics Layout Ppt Slide Design
This is a effective marketing analytics layout ppt slide design. This is a three stage process. The stages in this process are checks and balances, fundamental analysis, trend analysis.

Mapping Analytics Template Ppt Examples Professional
This is a mapping analytics template ppt examples professional. This is a four stage process. The stages in this process are omni channel distribution and fulfillment, sourcing and supplier collaboration, planning and execution, retail execution.
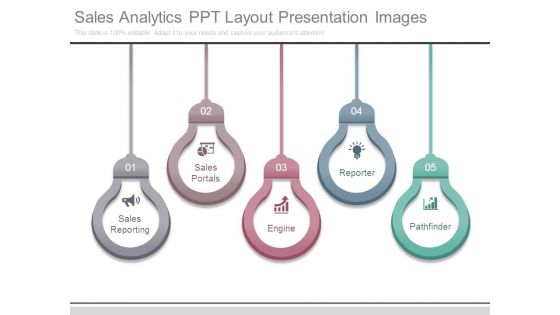
Sales Analytics Ppt Layout Presentation Images
This is a sales analytics ppt layout presentation images. This is a five stage process. The stages in this process are sales reporting, sales portals, engine, reporter, pathfinder.
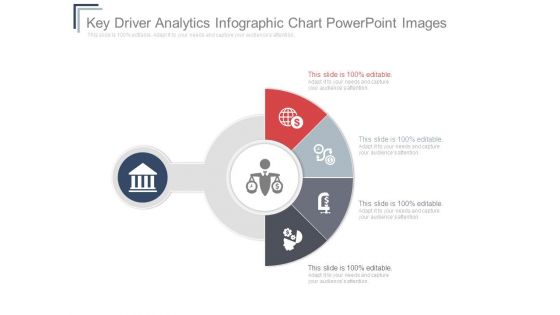
Key Driver Analytics Infographic Chart Powerpoint Images
This is a key driver analytics infographic chart powerpoint images. This is a five stage process. The stages in this process are business, marketing, semicircle, icons, strategy.
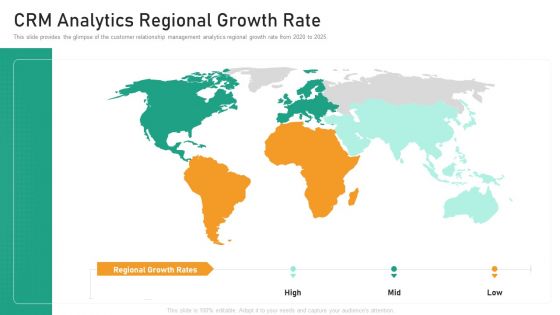
CRM Analytics Regional Growth Rate Diagrams PDF
This slide provides the glimpse of the customer relationship management analytics regional growth rate from 2020 to 2025.This is a crm analytics regional growth rate diagrams pdf template with various stages. Focus and dispense information on three stages using this creative set, that comes with editable features. It contains large content boxes to add your information on topics like crm analytics regional growth rate. You can also showcase facts, figures, and other relevant content using this PPT layout. Grab it now.
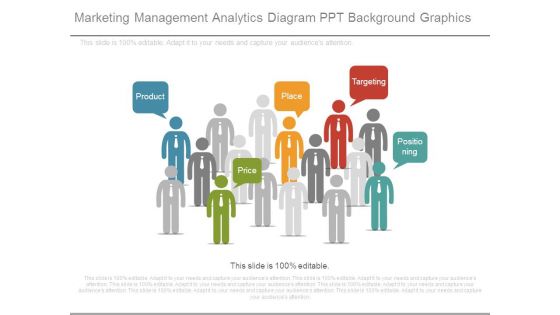
Marketing Management Analytics Diagram Ppt Background Graphics
This is a marketing management analytics diagram ppt background graphics. This is a five stage process. The stages in this process are product, price, place, targeting, positioning.

Web Analytics Process Framework Presentation Graphics
This is a web analytics process framework presentation graphics. This is a five stage process. The stages in this process are benchmarketing, management, implement, operations, social media.

Data Analytics Ppt PowerPoint Presentation Graphics
This is a data analytics ppt powerpoint presentation graphics. This is a five stage process. The stages in this process are data analysis, business, marketing, success, graph.
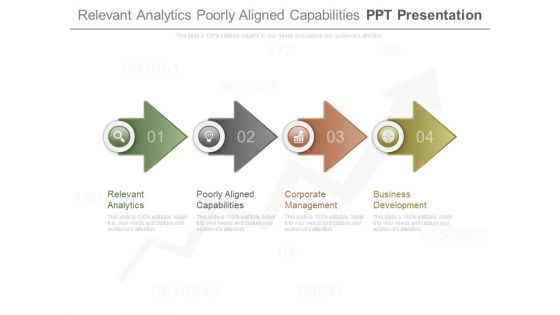
Relevant Analytics Poorly Aligned Capabilities Ppt Presentation
This is a relevant analytics poorly aligned capabilities ppt presentation. This is a four stage process. The stages in this process are success, business, marketing, arrows.

Marketing Analytics Diagram Powerpoint Slide Ideas
This is a marketing analytics diagram powerpoint slide ideas. This is a four stage process. The stages in this process are development, other solution, acquisition, retention.
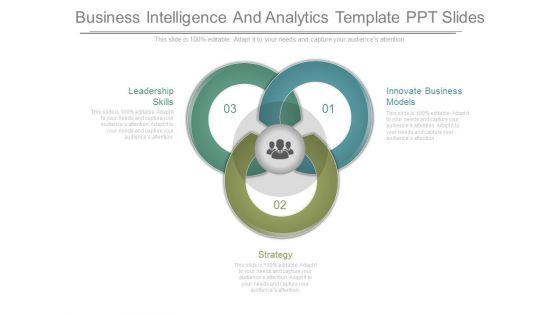
Business Intelligence And Analytics Template Ppt Slides
This is a business intelligence and analytics template ppt slides. This is a three stage process. The stages in this process are leadership skills, strategy, innovate business models.
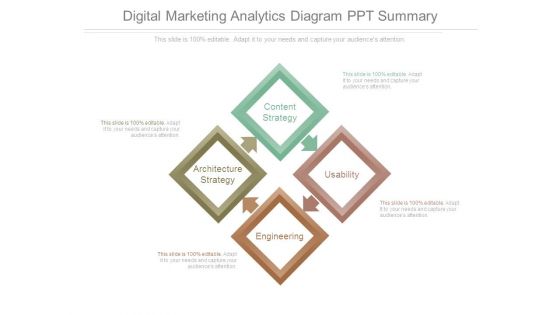
Digital Marketing Analytics Diagram Ppt Summary
This is a digital marketing analytics diagram ppt summary. This is a four stage process. The stages in this process are content strategy, usability, engineering, architecture, strategy.
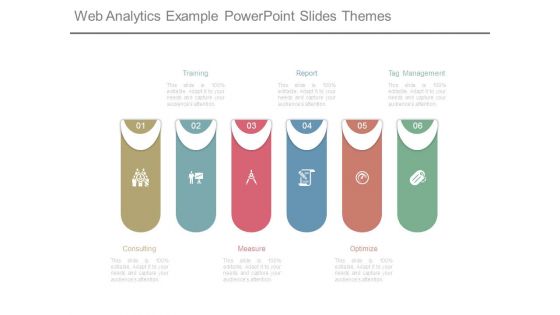
Web Analytics Example Powerpoint Slides Themes
This is a web analytics example powerpoint slides themes. This is a six stage process. The stages in this process are consulting, training, measure, report, optimize, tag management.
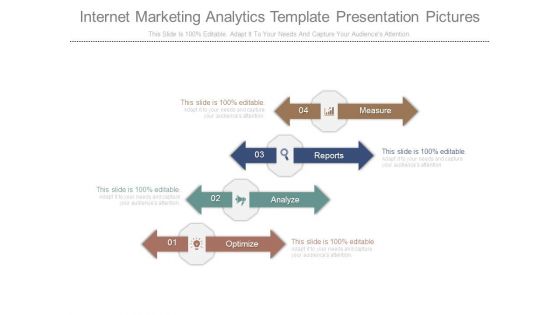
Internet Marketing Analytics Template Presentation Pictures
This is a internet marketing analytics template presentation pictures. This is a four stage process. The stages in this process are measure, reports, analyze, optimize.
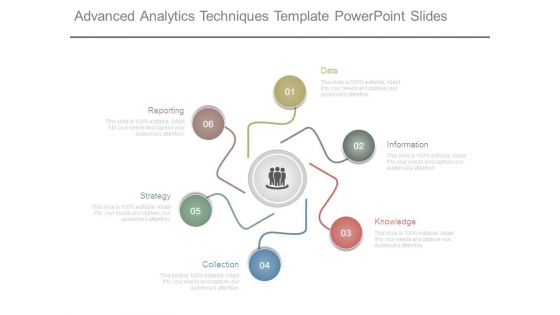
Advanced Analytics Techniques Template Powerpoint Slides
This is a advanced analytics techniques template powerpoint slides. This is a six stage process. The stages in this process are reporting, strategy, collection, knowledge, information, data.

Business Analytics Dashboard Diagram Example Of Ppt
This is a business analytics dashboard diagram example of ppt. This is a one stage process. The stages in this process are business, management, strategy, pie, presentation.
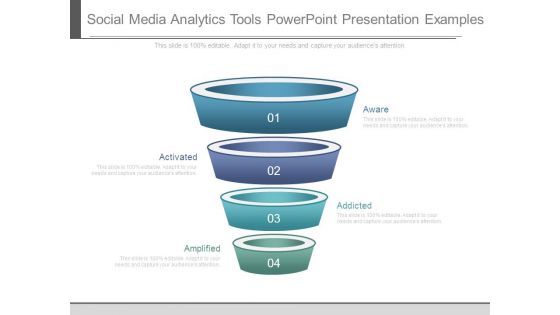
Social Media Analytics Tools Powerpoint Presentation Examples
This is a social media analytics tools powerpoint presentation examples. This is a four stage process. The stages in this process are activated, amplified, aware, addicted.

Bar Chart For Data Analytics Ppt Examples
This is a bar chart for data analytics ppt examples. This is a five stage process. The stages in this process are category.

Data Driven Analytics Chart Powerpoint Presentation Templates
This is a data driven analytics chart powerpoint presentation templates. This is a five stage process. The stages in this process are category.

Data Analytics Bar Chart Ppt Sample Presentations
This is a data analytics bar chart ppt sample presentations. This is a five stage process. The stages in this process are category.

Marketing Data Analytics Ppt Sample Presentations
This is a marketing data analytics ppt sample presentations. This is a five stage process. The stages in this process are business, strategy, marketing, process, linear process.

Data Analytics For Marketing Growth Ppt Slide
This is a data analytics for marketing growth ppt slide. This is a five stage process. The stages in this process are category.

Paid Search Analytics Ppt PowerPoint Presentation Guidelines
This is a paid search analytics ppt powerpoint presentation guidelines. This is a three stage process. The stages in this process are budget, impressions, clicks.

Data Analytics Ppt PowerPoint Presentation Themes
This is a data analytics ppt powerpoint presentation themes. This is a five stage process. The stages in this process are business, marketing, presentation, data analyst, management.

Key Driver Analytics Ppt PowerPoint Presentation Designs
This is a key driver analytics ppt powerpoint presentation designs. This is a four stage process. The stages in this process are business, strategy, marketing, analysis, success, icons.

Key Driver Analytics Ppt PowerPoint Presentation Microsoft
This is a key driver analytics ppt powerpoint presentation microsoft. This is a five stage process. The stages in this process are icons, business, marketing, strategy, success.
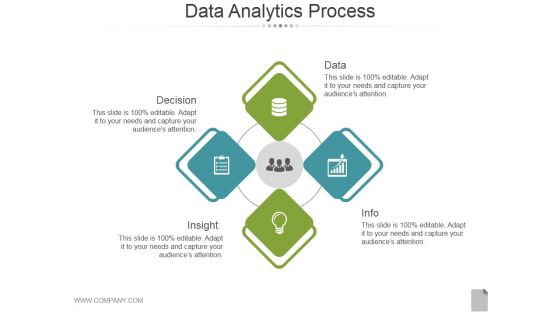
Data Analytics Process Ppt PowerPoint Presentation Inspiration
This is a data analytics process ppt powerpoint presentation inspiration. This is a four stage process. The stages in this process are decision, insight, data, info.
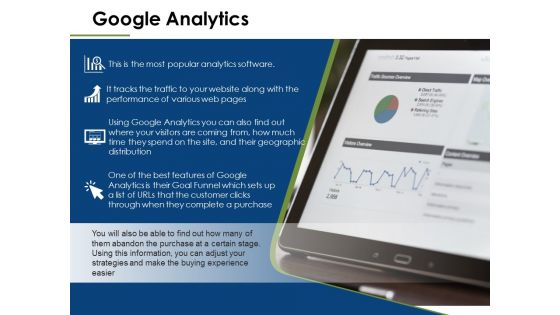
Google Analytics Ppt PowerPoint Presentation Slides Shapes
This is a google analytics ppt powerpoint presentation slides shapes. This is a one stage process. The stages in this process are marketing, management, business, strategy, business.

Robust Reporting And Analytics Powerpoint Slides
This is a robust reporting and analytics powerpoint slides. This is a six stage process. The stages in this process are robust reporting and analytics, integration for order info automation, enter order info creases rater, management tools and functionality, customer satisfaction tools, multi enterprise application.
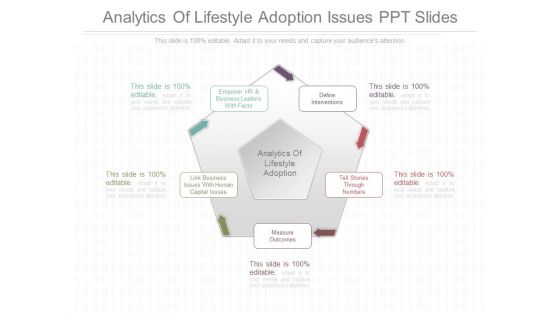
Analytics Of Lifestyle Adoption Issues Ppt Slides
This is a analytics of lifestyle adoption issues ppt slides. This is a five stage process. The stages in this process are define interventions, tell stories through numbers, measure outcomes, link business issues with human capital issues, empower hr and business leaders with facts, analytics of lifestyle adoption.

CRM Analytics Regional Growth Rate Download PDF
This is a crm analytics regional growth rate download pdf template with various stages. Focus and dispense information on three stages using this creative set, that comes with editable features. It contains large content boxes to add your information on topics like crm analytics regional growth rate. You can also showcase facts, figures, and other relevant content using this PPT layout. Grab it now.
Manpower Performance Analytics Dashboard Icon Designs PDF
Persuade your audience using this Manpower Performance Analytics Dashboard Icon Designs PDF. This PPT design covers four stages, thus making it a great tool to use. It also caters to a variety of topics including Manpower Performance, Analytics Dashboard, Icon. Download this PPT design now to present a convincing pitch that not only emphasizes the topic but also showcases your presentation skills.
Predictive Healthcare Data Analytics Icon Summary PDF
Presenting Predictive Healthcare Data Analytics Icon Summary PDF to dispense important information. This template comprises Three stages. It also presents valuable insights into the topics including Predictive Healthcare, Data Analytics Icon. This is a completely customizable PowerPoint theme that can be put to use immediately. So, download it and address the topic impactfully
Personnel Salary Analytics Dashboard Icon Elements PDF
Persuade your audience using this Personnel Salary Analytics Dashboard Icon Elements PDF. This PPT design covers three stages, thus making it a great tool to use. It also caters to a variety of topics including Dashboard Icon, Personnel Salary Analytics. Download this PPT design now to present a convincing pitch that not only emphasizes the topic but also showcases your presentation skills.
Working Capital Growth Analytics Icon Elements PDF
Presenting Working Capital Growth Analytics Icon Elements PDF to dispense important information. This template comprises three stages. It also presents valuable insights into the topics including Working Capital, Growth, Analytics This is a completely customizable PowerPoint theme that can be put to use immediately. So, download it and address the topic impactfully.
Working Capital Investment Analytics Icon Summary PDF
Persuade your audience using this Working Capital Investment Analytics Icon Summary PDF. This PPT design covers three stages, thus making it a great tool to use. It also caters to a variety of topics including Working Capital, Investment, Analytics. Download this PPT design now to present a convincing pitch that not only emphasizes the topic but also showcases your presentation skills.

Strategic Analytics Framework Sample Diagram Powerpoint Templates
This is a strategic analytics framework sample diagram powerpoint templates. This is a six stage process. The stages in this process are technology and infrastructure, teams and training, tools and techniques, business and quality context, stakeholders and users, process and data.

Analytics And Reporting Lifecycle Template Powerpoint Slides
This is a analytics and reporting lifecycle template powerpoint slides. This is a twelve stage process. The stages in this process are migration, business intelligence, portals, enterprise search, business process, enterprises content management, online solution, consoling, infrastructure, integration, business automation, content management.
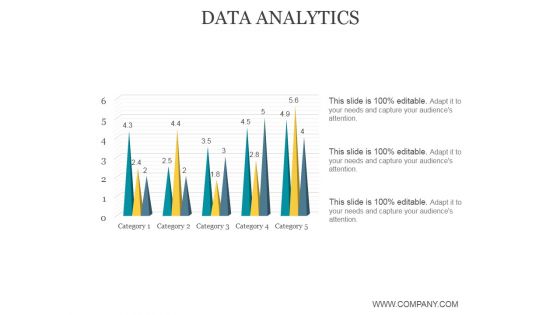
Data Analytics Ppt PowerPoint Presentation Guide
This is a data analytics ppt powerpoint presentation guide. This is a five stage process. The stages in this process are data analysis, business, marketing, success, graph.

Web Analytics Process Diagram Powerpoint Images
This is a web analytics process diagram powerpoint images. This is a six stage process. The stages in this process are build kpis, define goals, implement, test alternatives, analyze data, collect data.
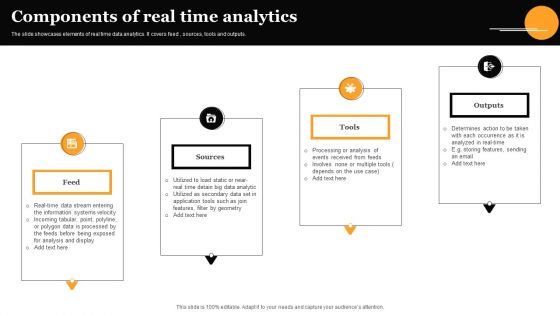
Components Of Real Time Analytics Graphics PDF
The slide showcases elements of real time data analytics. It covers feed, sources, tools and outputs. Presenting Components Of Real Time Analytics Graphics PDF to dispense important information. This template comprises four stages. It also presents valuable insights into the topics including Feed, Sources, Tools . This is a completely customizable PowerPoint theme that can be put to use immediately. So, download it and address the topic impactfully.
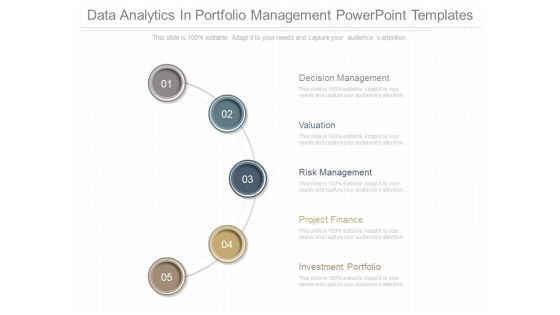
Data Analytics In Portfolio Management Powerpoint Templates
This is a data analytics in portfolio management powerpoint templates. This is a five stage process. The stages in this process are decision management, valuation, risk management, project finance, investment portfolio.
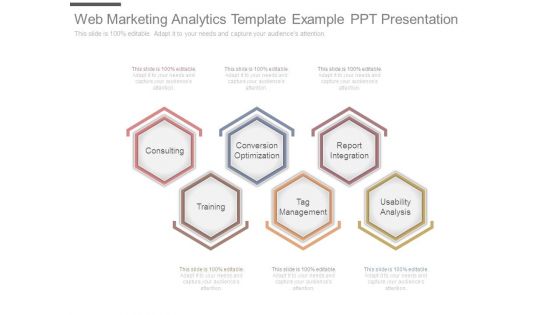
Web Marketing Analytics Template Example Ppt Presentation
This is a web marketing analytics template example ppt presentation. This is a six stage process. The stages in this process are consulting, conversion optimization, report integration, training, tag management, usability analysis.
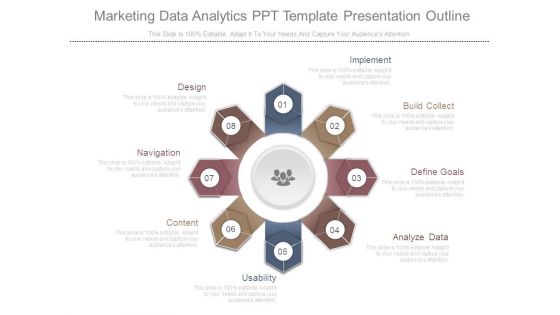
Marketing Data Analytics Ppt Template Presentation Outline
This is a marketing data analytics ppt template presentation outline. This is a eight stage process. The stages in this process are design, navigation, content, usability, analyze data, define goals, build collect, implement.
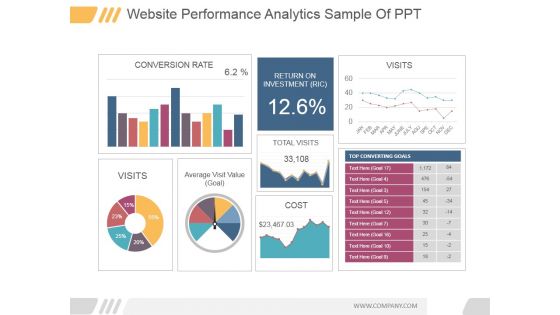
Website Performance Analytics Ppt PowerPoint Presentation Show
This is a website performance analytics ppt powerpoint presentation show. This is a three stage process. The stages in this process are conversion rate, visits, average visit value goal, return on investment ric, total visits, cost.

Paid Search Analytics Ppt PowerPoint Presentation Layout
This is a paid search analytics ppt powerpoint presentation layout. This is a three stage process. The stages in this process are march change form february, key stats, impressions, clicks, conversions.

Behavioural Analytics Ppt PowerPoint Presentation File Example
Presenting this set of slides with name behavioural analytics ppt powerpoint presentation file example. This is an editable Powerpoint six stages graphic that deals with topics like behavioural analytics to help convey your message better graphically. This product is a premium product available for immediate download and is 100 percent editable in Powerpoint. Download this now and use it in your presentations to impress your audience.
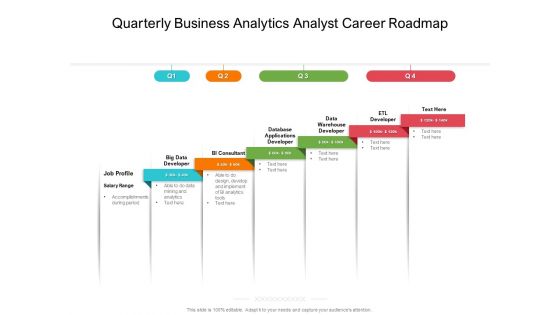
Quarterly Business Analytics Analyst Career Roadmap Themes
We present our quarterly business analytics analyst career roadmap themes. This PowerPoint layout is easy-to-edit so you can change the font size, font type, color, and shape conveniently. In addition to this, the PowerPoint layout is Google Slides compatible, so you can share it with your audience and give them access to edit it. Therefore, download and save this well-researched quarterly business analytics analyst career roadmap themes in different formats like PDF, PNG, and JPG to smoothly execute your business plan.

Data Analytics Healthcare Best Technologies Template PDF
This slide showcases the most used technologies for healthcare data analytics. It includes technologies such as AI tools, cloud computing platforms, blockchain networks and machine learning tools. Presenting Data Analytics Healthcare Best Technologies Template PDF to dispense important information. This template comprises Five stages. It also presents valuable insights into the topics including Artificial Intelligence Tools, Cloud Computing Platforms, Blockchain Network. This is a completely customizable PowerPoint theme that can be put to use immediately. So, download it and address the topic impactfully.

Core Team Analytics Company Investor Funding Elevator
This slide represents core management team of analytics company. It includes CEO, Technology manager, and marketing manager.Formulating a presentation can take up a lot of effort and time, so the content and message should always be the primary focus. The visuals of the PowerPoint can enhance the presenters message, so our Core Team Analytics Company Investor Funding Elevator was created to help save time. Instead of worrying about the design, the presenter can concentrate on the message while our designers work on creating the ideal templates for whatever situation is needed. Slidegeeks has experts for everything from amazing designs to valuable content, we have put everything into Core Team Analytics Company Investor Funding Elevator.

Effective Website Customer Analytics Tools Microsoft PDF
The following slide exhibits software for analysing consumer behaviour which helps businesses in providing crucial data about their marketing efforts and customer preferences. It includes information about Mixpanel, Hotjar, etc. Persuade your audience using this Effective Website Customer Analytics Tools Microsoft PDF. This PPT design covers three stages, thus making it a great tool to use. It also caters to a variety of topics including Tools, Features, Pricing. Download this PPT design now to present a convincing pitch that not only emphasizes the topic but also showcases your presentation skills.

Big Data Analytics Service Framework Graphics PDF
Mentioned slide illustrates big data managed services which can be used by business to gather real time company analytics. It includes services such as data acquisition, storage, testing, monitoring, data security, analysis, architecture, development, migration and optimization. Persuade your audience using this Big Data Analytics Service Framework Graphics PDF. This PPT design covers one stages, thus making it a great tool to use. It also caters to a variety of topics including Data Analysis, Assessment Of Business, Management Infrastructure. Download this PPT design now to present a convincing pitch that not only emphasizes the topic but also showcases your presentation skills.
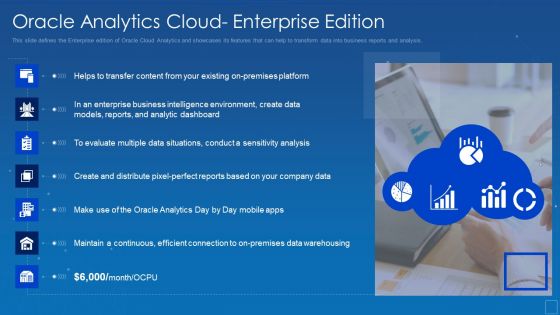
Oracle Analytics Cloud Enterprise Edition Download PDF
This slide defines the Enterprise edition of Oracle Cloud Analytics and showcases its features that can help to transform data into business reports and analysis. This is a oracle analytics cloud enterprise edition download pdf template with various stages. Focus and dispense information on six stages using this creative set, that comes with editable features. It contains large content boxes to add your information on topics like content, on premises, platform, environment, intelligence, dashboard. You can also showcase facts, figures, and other relevant content using this PPT layout. Grab it now.
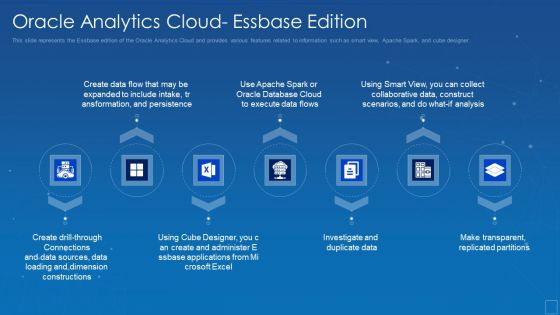
Oracle Analytics Cloud Essbase Edition Pictures PDF
This slide represents the Essbase edition of the Oracle Analytics Cloud and provides various features related to information such as smart view, Apache Spark, and cube designer. This is a oracle analytics cloud essbase edition pictures pdf template with various stages. Focus and dispense information on seven stages using this creative set, that comes with editable features. It contains large content boxes to add your information on topics like persistence, transformation, expanded, connections, sources. You can also showcase facts, figures, and other relevant content using this PPT layout. Grab it now.

Oracle Analytics Clouds Essbase Service Guidelines PDF
This slide describes the oracle analytics clouds Essbase service, and its features include flexibility, portability, enterprise readiness, best in class functionality, and proved platform and technology. This is a oracle analytics clouds essbase service guidelines pdf template with various stages. Focus and dispense information on five stages using this creative set, that comes with editable features. It contains large content boxes to add your information on topics like platform, technology, enterprise, functionality, flexible. You can also showcase facts, figures, and other relevant content using this PPT layout. Grab it now.

Benefits Of Healthcare Data Analytics Pictures PDF
This slide showcase the advantages of data analytics in healthcare. It includes benefits such as improved medical research, new drug development and automatic administrative processes. Persuade your audience using this Benefits Of Healthcare Data Analytics Pictures PDF. This PPT design covers Ten stages, thus making it a great tool to use. It also caters to a variety of topics including Clinical Data Analysis, Improve Medical Research. Download this PPT design now to present a convincing pitch that not only emphasizes the topic but also showcases your presentation skills.
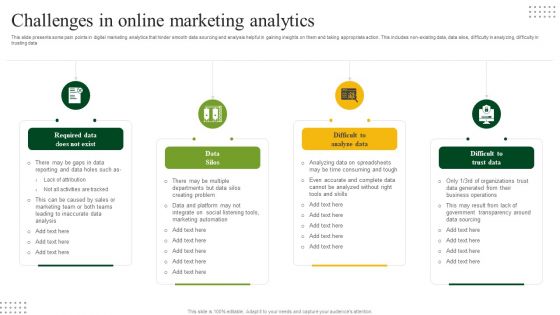
Challenges In Online Marketing Analytics Elements PDF
This slide presents some pain points in digital marketing analytics that hinder smooth data sourcing and analysis helpful in gaining insights on them and taking appropriate action. This includes non-existing data, data silos, difficulty in analyzing, difficulty in trusting data. Presenting Challenges In Online Marketing Analytics Elements PDF to dispense important information. This template comprises four stages. It also presents valuable insights into the topics including Data Silos, Difficult Analyze Data, Difficult Trust Data. This is a completely customizable PowerPoint theme that can be put to use immediately. So, download it and address the topic impactfully.
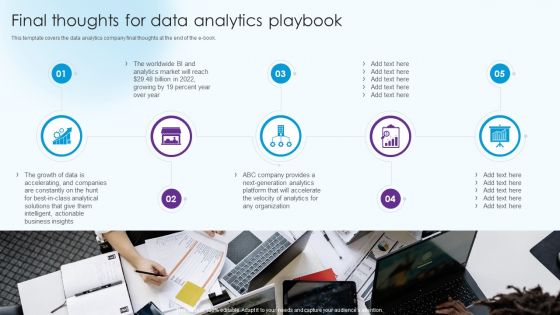
Information Analytics And Ml Strategy Playbook Final Thoughts For Data Analytics Playbook Topics PDF
This template covers the data analytics company final thoughts at the end of the e book. Presenting Information Analytics And Ml Strategy Playbook Final Thoughts For Data Analytics Playbook Topics PDF to provide visual cues and insights. Share and navigate important information on five stages that need your due attention. This template can be used to pitch topics like Analytics, Organization, Business Insights. In addtion, this PPT design contains high resolution images, graphics, etc, that are easily editable and available for immediate download.
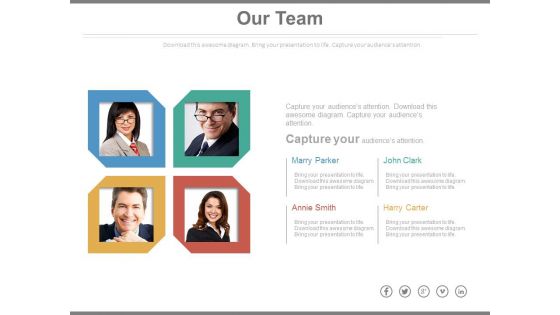
Business Analytics Team Structure Powerpoint Slides
This PowerPoint template displays business analytics team structure. This PPT slide may be used for team briefing sessions or it may be used to display functions of business team. Transmit your thoughts via this slide and prod your team to action.

Agenda Developing Business Analytics Framework Elements PDF
This is a Agenda Developing Business Analytics Framework Elements PDF template with various stages. Focus and dispense information on four stages using this creative set, that comes with editable features. It contains large content boxes to add your information on topics like Agenda You can also showcase facts, figures, and other relevant content using this PPT layout. Grab it now.
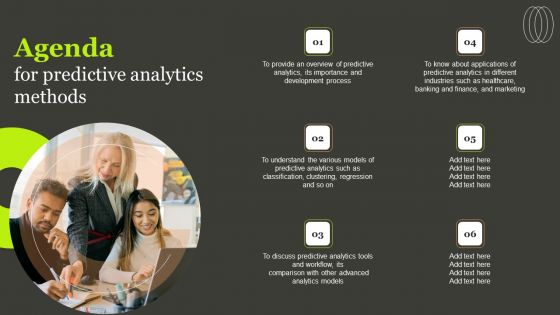
Agenda For Predictive Analytics Methods Topics PDF
Predictive Analytics For Empowering Predictive Analytics Vs Machine Learning Icons Pdf
This slide represents the comparison between predictive analytics and machine learning based on technology used and built on, the functionality of the model, and requirements for the development of the models. Here you can discover an assortment of the finest PowerPoint and Google Slides templates. With these templates, you can create presentations for a variety of purposes while simultaneously providing your audience with an eye-catching visual experience. Download Predictive Analytics For Empowering Predictive Analytics Vs Machine Learning Icons Pdf to deliver an impeccable presentation. These templates will make your job of preparing presentations much quicker, yet still, maintain a high level of quality. Slidegeeks has experienced researchers who prepare these templates and write high-quality content for you. Later on, you can personalize the content by editing the Predictive Analytics For Empowering Predictive Analytics Vs Machine Learning Icons Pdf

Manufacturing Industry Weak Point Analytics Designs PDF
The following slide highlights pain point analysis of manufacturing industries to overcome consistent problems disrupting smooth functioning of markets. It include components such as supply chain disruptions, materials shortage etc. Presenting Manufacturing Industry Weak Point Analytics Designs PDF to dispense important information. This template comprises five stages. It also presents valuable insights into the topics including Disruptions, Shortage, Challenges. This is a completely customizable PowerPoint theme that can be put to use immediately. So, download it and address the topic impactfully.

 Home
Home