Visual Analytics

Big Data Analytics Procedure In Banking Sector Guidelines PDF
This slide illustrate procedure of big data analysis in banking segment to find useful insights for decision making. It includes elements such as data collection, data processing, live analysis and insights generation Persuade your audience using this Big Data Analytics Procedure In Banking Sector Guidelines PDF. This PPT design covers three stages, thus making it a great tool to use. It also caters to a variety of topics including Data Collection, Data Processing, Live Analysis. Download this PPT design now to present a convincing pitch that not only emphasizes the topic but also showcases your presentation skills.

Big Data Electric Power Distribution Network Analytics Procedure Slides PDF
This slide illustrate big data electric power distribution network analysis process. It includes elements such as demand analysis, data traceability, data cleaning, model construction and evaluation Persuade your audience using this Big Data Electric Power Distribution Network Analytics Procedure Slides PDF. This PPT design covers three stages, thus making it a great tool to use. It also caters to a variety of topics including Demand Analysis, Data Traceability, Data Cleaning. Download this PPT design now to present a convincing pitch that not only emphasizes the topic but also showcases your presentation skills.

Procedure To Cure Disease Using Big Data Analytics Designs PDF
This slide showcase process to cure disease using big data analysis and use it for future preference to treat patients. It includes elements such as diagnose and collect, analyze and store, map and match, access and compute etc. Presenting Procedure To Cure Disease Using Big Data Analytics Designs PDF to dispense important information. This template comprises five stages. It also presents valuable insights into the topics including Patient, Compute, Collect. This is a completely customizable PowerPoint theme that can be put to use immediately. So, download it and address the topic impactfully.

Profitability Modelling Framework Selecting Suitable Profitability Analytics Solutions Infographics PDF
This slide portrays information regarding the profitability analytics solutions that are available. Firm can choose the suitable solution based on the requirement based on features and cost mentioned. The best PPT templates are a great way to save time, energy, and resources. Slidegeeks have 100 percent editable powerpoint slides making them incredibly versatile. With these quality presentation templates, you can create a captivating and memorable presentation by combining visually appealing slides and effectively communicating your message. Download Profitability Modelling Framework Selecting Suitable Profitability Analytics Solutions Infographics PDF from Slidegeeks and deliver a wonderful presentation.

Predictive Data Model Predictive Analytics Forecast Model Introduction Themes PDF
This slide outlines the introduction of the forecast model used for predictive analytics to make the metric value predictions for business processes. This model uses the Prophet algorithm to make predictions and includes its use cases in the manufacturing industry. The best PPT templates are a great way to save time, energy, and resources. Slidegeeks have 100 percent editable powerpoint slides making them incredibly versatile. With these quality presentation templates, you can create a captivating and memorable presentation by combining visually appealing slides and effectively communicating your message. Download Predictive Data Model Predictive Analytics Forecast Model Introduction Themes PDF from Slidegeeks and deliver a wonderful presentation.

3 Months Timeline For Fitness Analytics Initiative Guidelines
Presenting our jaw dropping 3 months timeline for fitness analytics initiative guidelines. You can alternate the color, font size, font type, and shapes of this PPT layout according to your strategic process. This PPT presentation is compatible with Google Slides and is available in both standard screen and widescreen aspect ratios. You can also download this well researched PowerPoint template design in different formats like PDF, JPG, and PNG. So utilize this visually appealing design by clicking the download button given below.

5 Year Timeline For Fitness Analytics Initiative Ideas
Presenting our jaw dropping 5 year timeline for fitness analytics initiative ideas. You can alternate the color, font size, font type, and shapes of this PPT layout according to your strategic process. This PPT presentation is compatible with Google Slides and is available in both standard screen and widescreen aspect ratios. You can also download this well researched PowerPoint template design in different formats like PDF, JPG, and PNG. So utilize this visually appealing design by clicking the download button given below.

6 Months Timeline For Fitness Analytics Initiative Mockup
Presenting our jaw dropping 6 months timeline for fitness analytics initiative mockup. You can alternate the color, font size, font type, and shapes of this PPT layout according to your strategic process. This PPT presentation is compatible with Google Slides and is available in both standard screen and widescreen aspect ratios. You can also download this well researched PowerPoint template design in different formats like PDF, JPG, and PNG. So utilize this visually appealing design by clicking the download button given below.
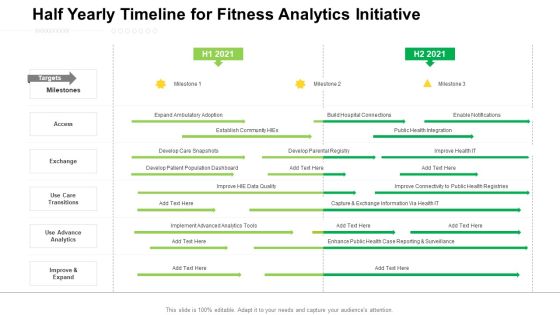
Half Yearly Timeline For Fitness Analytics Initiative Inspiration
Presenting our jaw dropping half yearly timeline for fitness analytics initiative inspiration. You can alternate the color, font size, font type, and shapes of this PPT layout according to your strategic process. This PPT presentation is compatible with Google Slides and is available in both standard screen and widescreen aspect ratios. You can also download this well researched PowerPoint template design in different formats like PDF, JPG, and PNG. So utilize this visually appealing design by clicking the download button given below.

Business Analytics Application Gap Analysis Representing Present Business Graphics PDF
This slide represents the gap analysis to help organizations understand the gaps so that they could build effective strategies to eliminate these gaps and achieve desired results. It represents gap analysis showing the current scenario of an organization. This modern and well-arranged Business Analytics Application Gap Analysis Representing Present Business Graphics PDF provides lots of creative possibilities. It is very simple to customize and edit with the Powerpoint Software. Just drag and drop your pictures into the shapes. All facets of this template can be edited with Powerpoint, no extra software is necessary. Add your own material, put your images in the places assigned for them, adjust the colors, and then you can show your slides to the world, with an animated slide included.

Human Resource Analytics Analysis Of Business Intelligence Requirement Template PDF
This slide represents the need for implementing business intelligence in HR operations. It represents the requirement of prediction of employee performance for which BI is required. Do you know about Slidesgeeks Human Resource Analytics Analysis Of Business Intelligence Requirement Template PDF These are perfect for delivering any kind od presentation. Using it, create PowerPoint presentations that communicate your ideas and engage audiences. Save time and effort by using our pre-designed presentation templates that are perfect for a wide range of topic. Our vast selection of designs covers a range of styles, from creative to business, and are all highly customizable and easy to edit. Download as a PowerPoint template or use them as Google Slides themes.
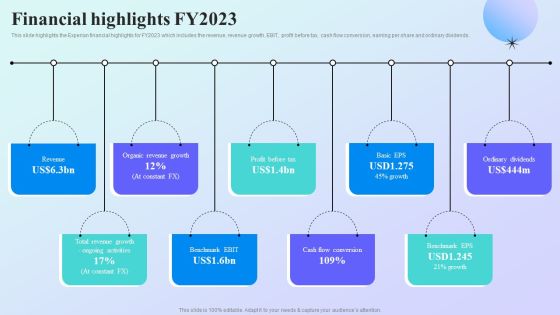
Information Analytics Company Outline Financial Highlights FY2023 Summary PDF
This slide highlights the Experian financial highlights for FY2023 which includes the revenue, revenue growth, EBIT, profit before tax, cash flow conversion, earning per share and ordinary dividends. Welcome to our selection of the Information Analytics Company Outline Financial Highlights FY2023 Summary PDF. These are designed to help you showcase your creativity and bring your sphere to life. Planning and Innovation are essential for any business that is just starting out. This collection contains the designs that you need for your everyday presentations. All of our PowerPoints are 100 percent editable, so you can customize them to suit your needs. This multi purpose template can be used in various situations. Grab these presentation templates today.
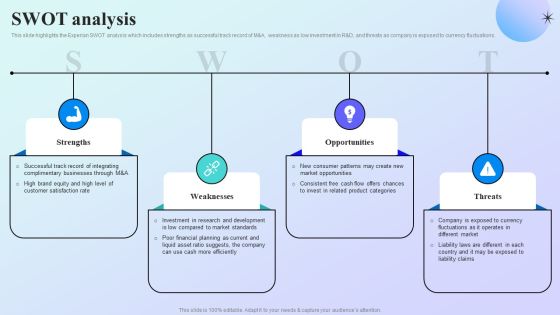
Information Analytics Company Outline SWOT Analysis Demonstration PDF
This slide highlights the Experian SWOT analysis which includes strengths as successful track record of M and A, weakness as low investment in R and D, and threats as company is exposed to currency fluctuations. Retrieve professionally designed Information Analytics Company Outline SWOT Analysis Demonstration PDF to effectively convey your message and captivate your listeners. Save time by selecting pre made slideshows that are appropriate for various topics, from business to educational purposes. These themes come in many different styles, from creative to corporate, and all of them are easily adjustable and can be edited quickly. Access them as PowerPoint templates or as Google Slides themes. You do not have to go on a hunt for the perfect presentation because Slidegeeks got you covered from everywhere.

Datafy Introduction To Human Resource Talent Analytics Clipart PDF
This slide represents the overview of human resource talent analytics, covering recruiting and workforce planning, compensation and benefits, performance succession engagement, human resources management system employee data, and so on. Formulating a presentation can take up a lot of effort and time, so the content and message should always be the primary focus. The visuals of the PowerPoint can enhance the presenters message, so our Datafy Introduction To Human Resource Talent Analytics Clipart PDF was created to help save time. Instead of worrying about the design, the presenter can concentrate on the message while our designers work on creating the ideal templates for whatever situation is needed. Slidegeeks has experts for everything from amazing designs to valuable content, we have put everything into Datafy Introduction To Human Resource Talent Analytics Clipart PDF.

Predictive Data Model Working Of Predictive Analytics Models Pictures PDF
This slide depicts the working of predictive analytics models that operates iteratively. The main phases in working include business understanding, data understanding, data preparation, modeling, evaluation, and deployment. Formulating a presentation can take up a lot of effort and time, so the content and message should always be the primary focus. The visuals of the PowerPoint can enhance the presenters message, so our Predictive Data Model Working Of Predictive Analytics Models Pictures PDF was created to help save time. Instead of worrying about the design, the presenter can concentrate on the message while our designers work on creating the ideal templates for whatever situation is needed. Slidegeeks has experts for everything from amazing designs to valuable content, we have put everything into Predictive Data Model Working Of Predictive Analytics Models Pictures PDF

Predicting Customer Churn Probability Through Predictive Analytics Inspiration PDF
After deploying predictive analytics tool, the firm will become capable in predicting churn probability of various customers on basis of various attributes such as NPS, transaction usage, etc. that are retrieved from customer data. Coming up with a presentation necessitates that the majority of the effort goes into the content and the message you intend to convey. The visuals of a PowerPoint presentation can only be effective if it supplements and supports the story that is being told. Keeping this in mind our experts created Predicting Customer Churn Probability Through Predictive Analytics Inspiration PDF to reduce the time that goes into designing the presentation. This way, you can concentrate on the message while our designers take care of providing you with the right template for the situation.

Business Analytics Application Employee Engagement Key Performance Metrics Icons PDF
This slide represents key metrics dashboard to analyze the engagement of employees in the organization. It includes details related to KPIs such as engagement score, response rate, net promoter score etc. Formulating a presentation can take up a lot of effort and time, so the content and message should always be the primary focus. The visuals of the PowerPoint can enhance the presenters message, so our Business Analytics Application Employee Engagement Key Performance Metrics Icons PDF was created to help save time. Instead of worrying about the design, the presenter can concentrate on the message while our designers work on creating the ideal templates for whatever situation is needed. Slidegeeks has experts for everything from amazing designs to valuable content, we have put everything into Business Analytics Application Employee Engagement Key Performance Metrics Icons PDF.

Human Resource Analytics Gap Analysis Representing Present Business Microsoft PDF
This slide represents the gap analysis to help organizations understand the gaps so that they could build effective strategies to eliminate these gaps and achieve desired results. It represents gap analysis showing the current scenario of an organization. Formulating a presentation can take up a lot of effort and time, so the content and message should always be the primary focus. The visuals of the PowerPoint can enhance the presenters message, so our Human Resource Analytics Gap Analysis Representing Present Business Microsoft PDF was created to help save time. Instead of worrying about the design, the presenter can concentrate on the message while our designers work on creating the ideal templates for whatever situation is needed. Slidegeeks has experts for everything from amazing designs to valuable content, we have put everything into Human Resource Analytics Gap Analysis Representing Present Business Microsoft PDF.

Predictive Data Model Overview Of Predictive Analytics Framework Summary PDF
This slide outlines the overview of the predictive analytics framework and its components, including wide area network, OpenFlow, forecasting, software-defined networking controller, predictive models, elastic cluster, data acquisition and application servers. Coming up with a presentation necessitates that the majority of the effort goes into the content and the message you intend to convey. The visuals of a PowerPoint presentation can only be effective if it supplements and supports the story that is being told. Keeping this in mind our experts created Predictive Data Model Overview Of Predictive Analytics Framework Summary PDF to reduce the time that goes into designing the presentation. This way, you can concentrate on the message while our designers take care of providing you with the right template for the situation.

Warehouse Fleet And Transportation Performance Analytics Dashboard Pictures PDF
This slide represents a warehouse fleet and transportation management dashboard to visualize and optimize logistics operations through advanced data analyses. It monitors KPIs such as fleet status, delivery status, deliveries by location, average delivery time hours0 and route Km, loading time and weight, and profit by location. Do you have to make sure that everyone on your team knows about any specific topic I yes, then you should give Warehouse Fleet And Transportation Performance Analytics Dashboard Pictures PDF a try. Our experts have put a lot of knowledge and effort into creating this impeccable Warehouse Fleet And Transportation Performance Analytics Dashboard Pictures PDF. You can use this template for your upcoming presentations, as the slides are perfect to represent even the tiniest detail. You can download these templates from the Slidegeeks website and these are easy to edit. So grab these today

User Feedback Governance And Analytics Dashboard Ppt Professional Rules PDF
This slide covers summary report on feedbacks provided by users.It includes analytics based on monthly feedbacks, positive and negative feedbacks, etc. for effective user experience. Pitch your topic with ease and precision using this User Feedback Governance And Analytics Dashboard Ppt Professional Rules PDF. This layout presents information on Current Feedbacks, Monthly Feedbacks, Analytics. It is also available for immediate download and adjustment. So, changes can be made in the color, design, graphics or any other component to create a unique layout.

Centralized Big Data And Analytics Pipeline Framework Brochure PDF
This slide provide information about centralized data and analytics pipeline architecture to reduce the engineering overhead associated with data warehousing. It includes elements such as data sources, ingestion, analytics engines and data targets Pitch your topic with ease and precision using this Centralized Big Data And Analytics Pipeline Framework Brochure PDF. This layout presents information on Data Sources, Analytics Engines, Data Targets . It is also available for immediate download and adjustment. So, changes can be made in the color, design, graphics or any other component to create a unique layout.

Data Requirements For Analytics Dashboard Icon Graphics PDF
Showcasing this set of slides titled data requirements for analytics dashboard icon graphics pdf. The topics addressed in these templates are data requirements for analytics dashboard icon. All the content presented in this PPT design is completely editable. Download it and make adjustments in color, background, font etc. as per your unique business setting.
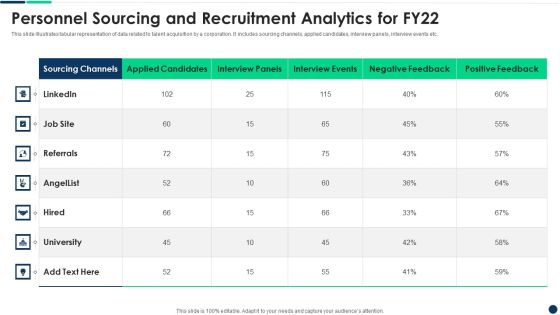
Personnel Sourcing And Recruitment Analytics For FY22 Diagrams PDF
Pitch your topic with ease and precision using this Personnel Sourcing And Recruitment Analytics For FY22 Diagrams PDF This layout presents information on Personnel Sourcing And Recruitment Analytics For Fy22 It is also available for immediate download and adjustment. So, changes can be made in the color, design, graphics or any other component to create a unique layout.
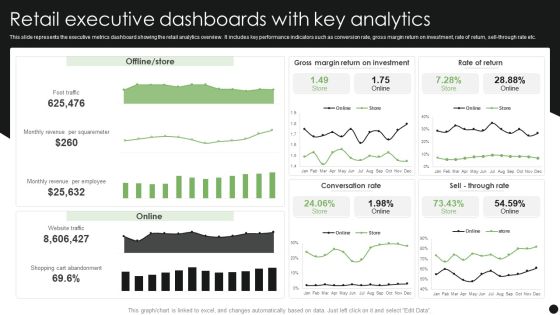
Retail Executive Dashboards With Key Analytics Guidelines PDF
Pitch your topic with ease and precision using this Retail Executive Dashboards With Key Analytics Guidelines PDF. This layout presents information on Retail Executive Dashboards, Key Analytics. It is also available for immediate download and adjustment. So, changes can be made in the color, design, graphics or any other component to create a unique layout.

Influencer Marketing Digital Promotion Success Analytics Structure PDF
Pitch your topic with ease and precision using this Influencer Marketing Digital Promotion Success Analytics Structure PDF. This layout presents information on Digital Promotion, Success Analytics. It is also available for immediate download and adjustment. So, changes can be made in the color, design, graphics or any other component to create a unique layout.
Project Personnel Planning Analytics Dashboard Icon Infographics PDF
Pitch your topic with ease and precision using this Project Personnel Planning Analytics Dashboard Icon Infographics PDF. This layout presents information on Project Personnel Planning, Analytics Dashboard Icon. It is also available for immediate download and adjustment. So, changes can be made in the color, design, graphics or any other component to create a unique layout.

Big Data Security Analytics Icon With Shield Symbol Background PDF
Pitch your topic with ease and precision using this Big Data Security Analytics Icon With Shield Symbol Background PDF. This layout presents information on Big Data Security Analytics, Icon With Shield Symbol. It is also available for immediate download and adjustment. So, changes can be made in the color, design, graphics or any other component to create a unique layout.
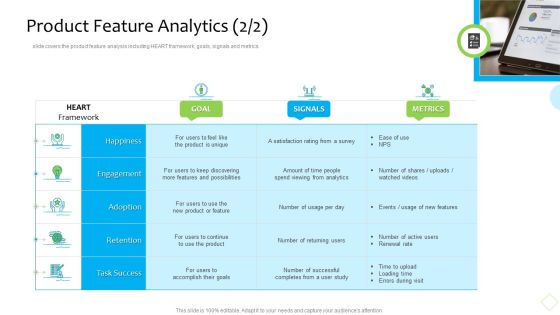
Product Demand Administration Product Feature Analytics Goal Structure PDF
slide covers the product feature analysis including heart framework, goals, signals and metrics. This is a product demand administration objectives of requirement document portrait pdf template with various stages. Focus and dispense information on one stages using this creative set, that comes with editable features. It contains large content boxes to add your information on topics like analytics, survey, goal, metrics. You can also showcase facts, figures, and other relevant content using this PPT layout. Grab it now.
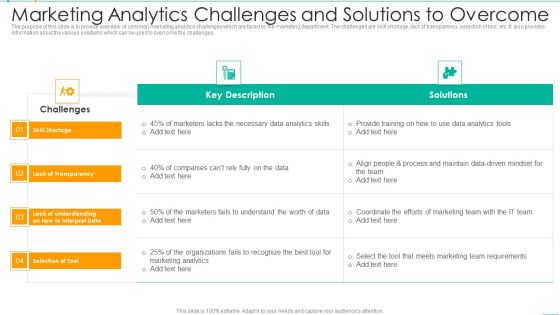
Marketing Analytics Challenges And Solutions To Overcome Template PDF
The purpose of this slide is to provide overview of common marketing analytics challenges which are faced by the marketing department. The challenges are skill shortage, lack of transparency, selection of tool, etc. It also provides information about the various solutions which can be used to overcome the challenges. Pitch your topic with ease and precision using this Marketing Analytics Challenges And Solutions To Overcome Template PDF. This layout presents information on Marketers, Data Analytics, Team. It is also available for immediate download and adjustment. So, changes can be made in the color, design, graphics or any other component to create a unique layout.

Marketing Analytics Dashboard With Conversion Rate Summary PDF
The purpose of this slide is to outline marketing analytics dashboard. The dashboard provides information about key metrices such as total impressions, clicks, cost, conversion value, rate, ROAS, market share by different ad platforms etc. Pitch your topic with ease and precision using this Marketing Analytics Dashboard With Conversion Rate Summary PDF. This layout presents information on Marketing Analytics Dashboard With Conversion Rate. It is also available for immediate download and adjustment. So, changes can be made in the color, design, graphics or any other component to create a unique layout.

Online Marketing Report Showing Social Media Analytics Mockup PDF
This slide shows the digital marketing report showcasing social media analytics which provides metrics of Facebook, Twitter, Instagram and YouTube with actual, target and yet to target performance.Pitch your topic with ease and precision using this Online Marketing Report Showing Social Media Analytics Mockup PDF This layout presents information on Total Engagements, Marketing Report, Showing Analytics It is also available for immediate download and adjustment. So, changes can be made in the color, design, graphics or any other component to create a unique layout.

Weekly Timeline For Supply Chain Big Data Analytics Introduction PDF
Following slide demonstrates weekly timeline which can be used by managers for management for bulky supply chain data. It includes key elements such as develop analytics team, determine supply problem and map out data sources, set business priorities, develop solutions and evaluate impact. Pitch your topic with ease and precision using this Weekly Timeline For Supply Chain Big Data Analytics Introduction PDF. This layout presents information on Determine Supply Chain, Data Sources, Analytics Team. It is also available for immediate download and adjustment. So, changes can be made in the color, design, graphics or any other component to create a unique layout.

E Mail Performance Analytics Metrics Tracking Report Analysis Demonstration PDF
The purpose of this slide is to showcase an e-mail analytics mechanism in order to track the performance of certain e-mail marketing based on various metrics. Certain KPIs include open rate, click rate, unsubscribe rate etc. Pitch your topic with ease and precision using this E Mail Performance Analytics Metrics Tracking Report Analysis Demonstration PDF. This layout presents information on E Mail Performance Analytics, Metrics Tracking Report Analysis. It is also available for immediate download and adjustment. So, changes can be made in the color, design, graphics or any other component to create a unique layout.
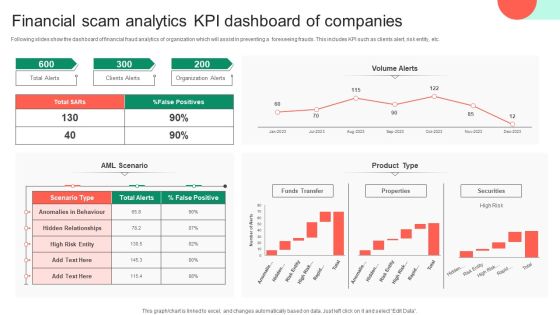
Financial Scam Analytics KPI Dashboard Of Companies Clipart PDF
Following slides show the dashboard of financial fraud analytics of organization which will assist in preventing a foreseeing frauds. This includes KPI such as clients alert, risk entity, etc. Pitch your topic with ease and precision using this Financial Scam Analytics KPI Dashboard Of Companies Clipart PDF. This layout presents information on Financial Scam Analytics, Kpi Dashboard Of Companies. It is also available for immediate download and adjustment. So, changes can be made in the color, design, graphics or any other component to create a unique layout.
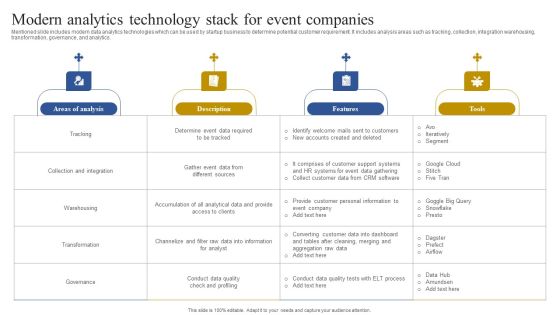
Modern Analytics Technology Stack For Event Companies Information PDF
Mentioned slide includes modern data analytics technologies which can be used by startup business to determine potential customer requirement. It includes analysis areas such as tracking, collection, integration warehousing, transformation, governance, and analytics. Pitch your topic with ease and precision using this Modern Analytics Technology Stack For Event Companies Information PDF. This layout presents information on Warehousing, Transformation, Collection And Integration. It is also available for immediate download and adjustment. So, changes can be made in the color, design, graphics or any other component to create a unique layout.
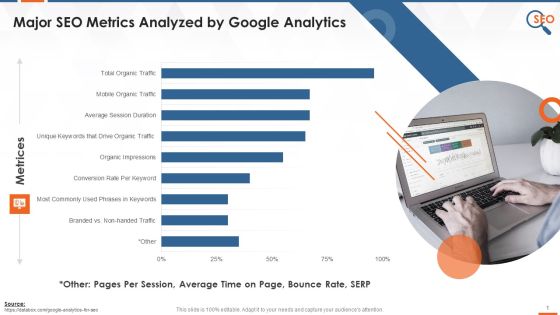
SEO Metrics That Google Analytics Analyses Training Ppt
This slide graphically presents the major SEO metrics analyzed by Google Analytics tools such as total organic traffic, average session duration, conversion rate per keyword, branded vs. non-branded traffic, etc.
Retail Campaign Analytics Ppt PowerPoint Presentation Infographic Template Inspiration Cpb
Presenting this set of slides with name retail campaign analytics ppt powerpoint presentation infographic template inspiration cpb. This is an editable Powerpoint graphic that deals with topics like retail campaign analytics to help convey your message better graphically. This product is a premium product available for immediate download and is 100 percent editable in Powerpoint. Download this now and use it in your presentations to impress your audience.
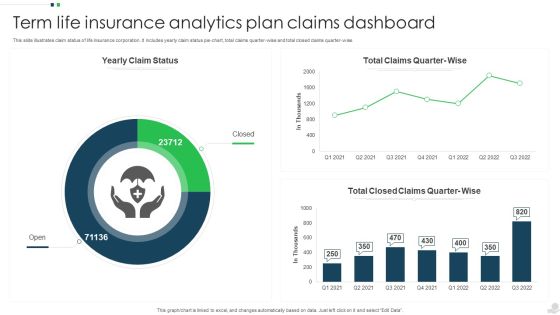
Term Life Insurance Analytics Plan Claims Dashboard Structure PDF
This slide illustrates claim status of life insurance corporation. It includes yearly claim status pie chart, total claims quarter-wise and total closed claims quarter wise. Pitch your topic with ease and precision using this Term Life Insurance Analytics Plan Claims Dashboard Structure PDF. This layout presents information on Insurance Analytics, Plan Claims Dashboard. It is also available for immediate download and adjustment. So, changes can be made in the color, design, graphics or any other component to create a unique layout.

Data And Analytics Procedure Evaluation Checklist Infographics PDF
This slide showcases a checklist of data and analytics process to find current trends and improve performance. The KPIs involved in this are cost, performance scalability, and modernization. Pitch your topic with ease and precision using this Data And Analytics Procedure Evaluation Checklist Infographics PDF. This layout presents information on Particulars, Owner, Deadline. It is also available for immediate download and adjustment. So, changes can be made in the color, design, graphics or any other component to create a unique layout.

Data And Analytics Impact Analysis On Business Slides PDF
This slide covers potential impact of data and analytics on location based services and other sectors. It also includes major barriers to adoption disrupting the process. Pitch your topic with ease and precision using this Data And Analytics Impact Analysis On Business Slides PDF. This layout presents information on Retail, Manufacturing, Location Based Data. It is also available for immediate download and adjustment. So, changes can be made in the color, design, graphics or any other component to create a unique layout.

Call Center Kpis Reporting And Analytics Dashboard Download PDF
This slide covers contact center reporting and analytics metrics dashboard. It involves metrics such as total unsuccessful calls, competence, activity, agent details and quality rate. Pitch your topic with ease and precision using this Call Center Kpis Reporting And Analytics Dashboard Download PDF. This layout presents information on Activity, Quality, Dashboard. It is also available for immediate download and adjustment. So, changes can be made in the color, design, graphics or any other component to create a unique layout.

Dashboard Depicting Sales And Customer Analytics Infographics PDF
This slide focuses on dashboard that depicts sales and customer analytics which covers sales revenue, average transaction rate, out of stock items, sales by division, monthly visitors, etc. If you are looking for a format to display your unique thoughts, then the professionally designed Dashboard Depicting Sales And Customer Analytics Infographics PDF is the one for you. You can use it as a Google Slides template or a PowerPoint template. Incorporate impressive visuals, symbols, images, and other charts. Modify or reorganize the text boxes as you desire. Experiment with shade schemes and font pairings. Alter, share or cooperate with other people on your work. Download Dashboard Depicting Sales And Customer Analytics Infographics PDF and find out how to give a successful presentation. Present a perfect display to your team and make your presentation unforgettable.

Change Management Communication Plan For Data Analytics Project Topics PDF
Here, we are describing the communication plan of implementing the change in data analytics project. It includes sections such as designated leader who support the change, respective departments and key actions for rationalizing the change in the process. If you are looking for a format to display your unique thoughts, then the professionally designed Change Management Communication Plan For Data Analytics Project Topics PDF is the one for you. You can use it as a Google Slides template or a PowerPoint template. Incorporate impressive visuals, symbols, images, and other charts. Modify or reorganize the text boxes as you desire. Experiment with shade schemes and font pairings. Alter, share or cooperate with other people on your work. Download Change Management Communication Plan For Data Analytics Project Topics PDF and find out how to give a successful presentation. Present a perfect display to your team and make your presentation unforgettable.

Projection Model Training Program For Predictive Analytics Model Sample PDF
This slide represents the training program for the predictive analytics model, and it includes the name of teams, trainer names, modules to be covered in training, and the schedule and venue of the training. If you are looking for a format to display your unique thoughts, then the professionally designed Projection Model Training Program For Predictive Analytics Model Sample PDF is the one for you. You can use it as a Google Slides template or a PowerPoint template. Incorporate impressive visuals, symbols, images, and other charts. Modify or reorganize the text boxes as you desire. Experiment with shade schemes and font pairings. Alter, share or cooperate with other people on your work. Download Projection Model Training Program For Predictive Analytics Model Sample PDF and find out how to give a successful presentation. Present a perfect display to your team and make your presentation unforgettable.

Dashboard For Big Healthcare Data Analytics Graphics PDF
This slide showcase the dashboard for big data analytics in healthcare. It includes elements such as bed occupancy rate, patient turnover rate, efficiency and costs, missed and cancelled appointment rate. Showcasing this set of slides titled Dashboard For Big Healthcare Data Analytics Graphics PDF. The topics addressed in these templates are Satisfaction Service Indicators, Occupancy, Forecasted Patient Turnover. All the content presented in this PPT design is completely editable. Download it and make adjustments in color, background, font etc. as per your unique business setting.

Brand Promotion Analytics Ppt PowerPoint Presentation Slides Graphics
Presenting this set of slides with name brand promotion analytics ppt powerpoint presentation slides graphics. The topics discussed in these slides are content, paid organic search, email marketing, social media. This is a completely editable PowerPoint presentation and is available for immediate download. Download now and impress your audience.

Playbook For Business Intelligence And Data Analytics Implementations Template
Are you tired of boring presentations that fail to captivate your audience Look no further than our Playbook For Business Intelligence And Data Analytics Implementations Template. It is designed to impress and capture attention. With 100 percent editable slides and visually-stunning graphics, you will be able to create presentations that wow. Do not settle for mediocrity, elevate your game with our A4 Playbook PPT Template.
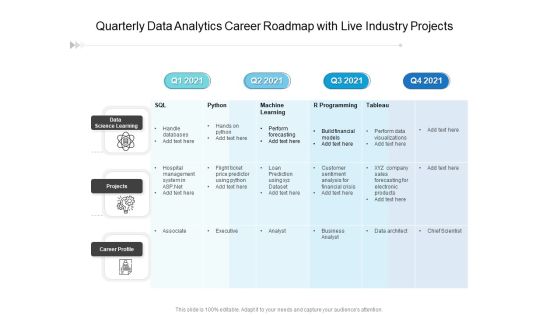
Quarterly Data Analytics Career Roadmap With Live Industry Projects Template
Presenting our jaw-dropping quarterly data analytics career roadmap with live industry projects template. You can alternate the color, font size, font type, and shapes of this PPT layout according to your strategic process. This PPT presentation is compatible with Google Slides and is available in both standard screen and widescreen aspect ratios. You can also download this well-researched PowerPoint template design in different formats like PDF, JPG, and PNG. So utilize this visually-appealing design by clicking the download button given below.

3 Months Roadmap For Data Analytics Technology Infographics
Presenting our jaw-dropping 3 months roadmap for data analytics technology infographics. You can alternate the color, font size, font type, and shapes of this PPT layout according to your strategic process. This PPT presentation is compatible with Google Slides and is available in both standard screen and widescreen aspect ratios. You can also download this well-researched PowerPoint template design in different formats like PDF, JPG, and PNG. So utilize this visually-appealing design by clicking the download button given below.

5 Year Roadmap For Data Analytics Technology Microsoft
Presenting our jaw-dropping 5 year roadmap for data analytics technology microsoft. You can alternate the color, font size, font type, and shapes of this PPT layout according to your strategic process. This PPT presentation is compatible with Google Slides and is available in both standard screen and widescreen aspect ratios. You can also download this well-researched PowerPoint template design in different formats like PDF, JPG, and PNG. So utilize this visually-appealing design by clicking the download button given below.

Playbook For Advanced Search And AI Driven Analytics Template
Create winning presentations effortlessly with our Playbook For Advanced Search And AI Driven Analytics Template. Designed to impress, each template is 100 percent editable, visually-stunning, and easy-to-use. Our team of researchers has meticulously crafted the right content for each template, so you do not have to worry about anything. Just select the perfect template for your project, personalize it, and deliver a memorable presentation that leaves a lasting impact.

Information Analytics And Automated Learning Strategy Playbook Template
Create winning presentations effortlessly with our Information Analytics And Automated Learning Strategy Playbook Template. Designed to impress, each template is 100 percent editable, visually-stunning, and easy-to-use. Our team of researchers has meticulously crafted the right content for each template, so you do not have to worry about anything. Just select the perfect template for your project, personalize it, and deliver a memorable presentation that leaves a lasting impact.
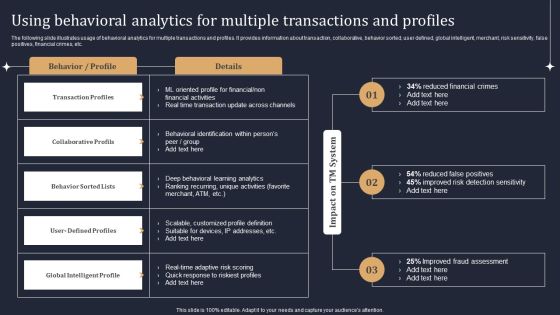
Using Behavioral Analytics For Multiple Transactions And Profiles Pictures PDF
The following slide illustrates usage of behavioral analytics for multiple transactions and profiles. It provides information about transaction, collaborative, behavior sorted, user defined, global intelligent, merchant, risk sensitivity, false positives, financial crimes, etc. If your project calls for a presentation, then Slidegeeks is your go to partner because we have professionally designed, easy to edit templates that are perfect for any presentation. After downloading, you can easily edit Using Behavioral Analytics For Multiple Transactions And Profiles Pictures PDF and make the changes accordingly. You can rearrange slides or fill them with different images. Check out all the handy templates.

Projection Model Checklist For Predictive Analytics Model Deployment Mockup PDF
This slide talks about the checklist for predictive analytics deployment that is necessary for organizations before deploying it and avoiding possible mistakes. It includes defining objectives, building the right team, and planning the deployment.If your project calls for a presentation, then Slidegeeks is your go-to partner because we have professionally designed, easy-to-edit templates that are perfect for any presentation. After downloading, you can easily edit Projection Model Checklist For Predictive Analytics Model Deployment Mockup PDF and make the changes accordingly. You can rearrange slides or fill them with different images. Check out all the handy templates
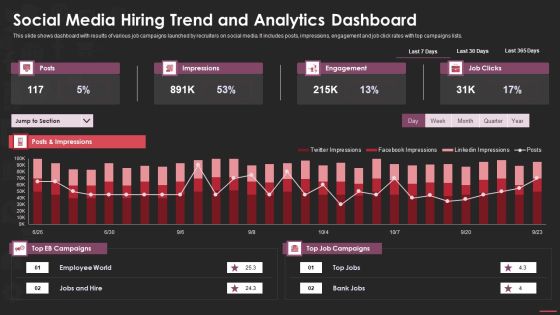
Social Media Hiring Trend And Analytics Dashboard Microsoft PDF
This slide shows dashboard with results of various job campaigns launched by recruiters on social media. It includes posts, impressions, engagement and job click rates with top campaigns lists. Pitch your topic with ease and precision using this social media hiring trend and analytics dashboard microsoft pdf. This layout presents information on social media hiring trend and analytics dashboard. It is also available for immediate download and adjustment. So, changes can be made in the color, design, graphics or any other component to create a unique layout.

Comparative Assessment Of Marketing Analytics Software Portrait PDF
The purpose of this slide is to compare different marketing analytics softwares. company can select the best software after drawing comparison on the basis of pros, cons, suitability, deployments, pricing, support and rating. Pitch your topic with ease and precision using this Comparative Assessment Of Marketing Analytics Software Portrait PDF. This layout presents information on Deployments, Pricing, Suitability. It is also available for immediate download and adjustment. So, changes can be made in the color, design, graphics or any other component to create a unique layout.

Insurance Analytics Corporation Sales Insights Dashboard Structure PDF
This slide illustrates facts and figures in relation to sales and overall policy status. It includes total policies and premiums in current and previous year, quarterly premium revenue and monthly policy status. Pitch your topic with ease and precision using this Insurance Analytics Corporation Sales Insights Dashboard Structure PDF. This layout presents information on Quarterly Premium Revenue, Sales Insights Dashboard, Insurance Analytics Corporation. It is also available for immediate download and adjustment. So, changes can be made in the color, design, graphics or any other component to create a unique layout.
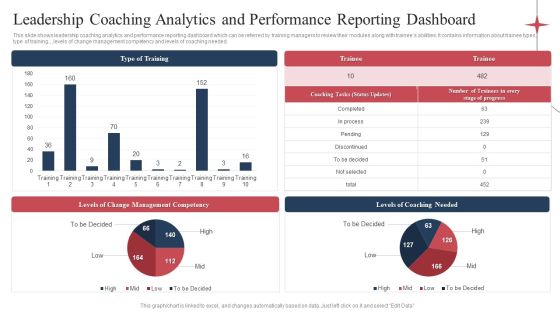
Leadership Coaching Analytics And Performance Reporting Dashboard Demonstration PDF
This slide shows leadership coaching analytics and performance reporting dashboard which can be referred by training managers to review their modules along with trainees abilities. It contains information about trainee types, type of training., ,levels of change management competency and levels of coaching needed. Pitch your topic with ease and precision using this Leadership Coaching Analytics And Performance Reporting Dashboard Demonstration PDF. This layout presents information on Levels Coaching Needed, Levels Change Management, Type Training. It is also available for immediate download and adjustment. So, changes can be made in the color, design, graphics or any other component to create a unique layout.

Cyber Security Team Analytics Dashboard With KPI Metrics Icons PDF
The following slide shows cyber analytics dashboard to monitor and inspect threats and accordingly plan preventive actions. It includes open and resolved incidents and tickets. Pitch your topic with ease and precision using this Cyber Security Team Analytics Dashboard With KPI Metrics Icons PDF. This layout presents information on Energy Security Team, Digital Security Center, Security Operations Center. It is also available for immediate download and adjustment. So, changes can be made in the color, design, graphics or any other component to create a unique layout.

 Home
Home