Two Stage Process
Retail Competition Ppt PowerPoint Presentation Icon Microsoft
This is a retail competition ppt powerpoint presentation icon microsoft. This is a six stage process. The stages in this process are customer service, shipping speed, product quality, price, product fidelity.

Retail KPI Dashboard Showing Revenue Vs Units Sold Ppt PowerPoint Presentation Professional Smartart
This is a retail kpi dashboard showing revenue vs units sold ppt powerpoint presentation professional smartart. This is a four stage process. The stages in this process are finance, analysis, business, investment, marketing.

Retail KPI Dashboard Showing Sales Revenue Customers Ppt PowerPoint Presentation Show Background Designs
This is a retail kpi dashboard showing sales revenue customers ppt powerpoint presentation show background designs. This is a six stage process. The stages in this process are finance, analysis, business, investment, marketing.
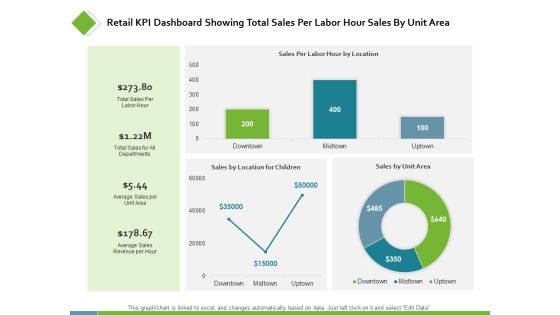
Retail KPI Dashboard Showing Total Sales Per Labor Ppt PowerPoint Presentation Styles Examples
This is a retail kpi dashboard showing total sales per labor ppt powerpoint presentation styles examples. This is a three stage process. The stages in this process are finance, analysis, business, investment, marketing.

Magnifying Glass Research Ppt PowerPoint Presentation Infographics Example Introduction
This is a magnifying glass research ppt powerpoint presentation infographics example introduction. This is a four stage process. The stages in this process are magnifying glass, research, marketing, strategy, business.
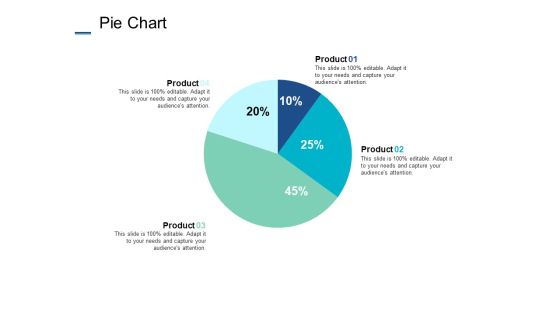
Pie Chart Finance Marketing Ppt PowerPoint Presentation Styles Outfit
This is a pie chart finance marketing ppt powerpoint presentation styles outfit. This is a four stage process. The stages in this process are finance, analysis, business, investment, marketing.
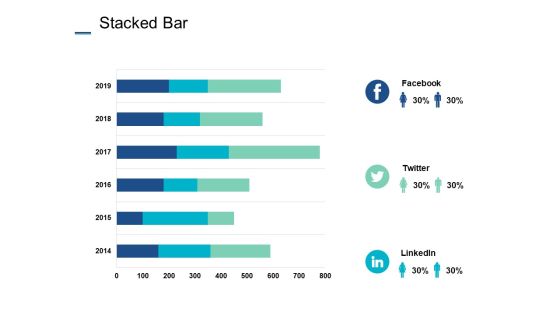
Stacked Bar Investment Ppt PowerPoint Presentation Ideas Graphics Tutorials
This is a stacked bar investment ppt powerpoint presentation ideas graphics tutorials. This is a three stage process. The stages in this process are stacked bar, finance, marketing, analysis, business, investment.

Area Stacked Finance Ppt PowerPoint Presentation Inspiration Graphics Download
This is a area stacked finance ppt powerpoint presentation inspiration graphics download. This is a three stage process. The stages in this process are area chart, finance, marketing, analysis, investment.

Cluster Column Marketing Planning Ppt PowerPoint Presentation Ideas Vector
This is a cluster column marketing planning ppt powerpoint presentation ideas vector. This is a three stage process. The stages in this process are finance, analysis, business, investment, marketing.
Employee Engagement Dashboard Ppt PowerPoint Presentation Icon Shapes
This is a employee engagement dashboard ppt powerpoint presentation icon shapes. This is a four stage process. The stages in this process are personal growth, technical skills, marketing, planning, strategy.

Employee Performance Measurement KPI Ppt PowerPoint Presentation Inspiration Influencers
This is a employee performance measurement kpi ppt powerpoint presentation inspiration influencers. This is a eight stage process. The stages in this process are finance, analysis, business, investment, marketing.
Employee Weekly Efficiency Dashboard Ppt PowerPoint Presentation Icon Backgrounds
This is a employee weekly efficiency dashboard ppt powerpoint presentation icon backgrounds. This is a four stage process. The stages in this process are finance, analysis, business, investment, marketing.

Pie Chart Marketing Finance Ppt PowerPoint Presentation File Guidelines
This is a pie chart marketing finance ppt powerpoint presentation file guidelines. This is a three stage process. The stages in this process are finance, analysis, business, investment, marketing.

Project Health Card Business Ppt PowerPoint Presentation Summary Samples
This is a project health card business ppt powerpoint presentation summary samples. This is a three stage process. The stages in this process are finance, analysis, business, investment, marketing.
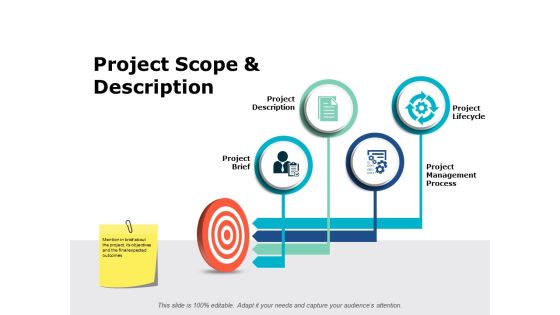
Project Scope And Description Ppt PowerPoint Presentation Slides File Formats
This is a project scope and description ppt powerpoint presentation slides file formats. This is a four stage process. The stages in this process are project description, project brief, project lifecycle, planning, marketing, strategy.

Area Chart Finance Marketing Ppt PowerPoint Presentation Gallery Graphics Design
This is a area chart finance marketing ppt powerpoint presentation gallery graphics design. This is a three stage process. The stages in this process are finance, analysis, business, investment, marketing.

Dashboard Finance Ppt PowerPoint Presentation Infographic Template Graphic Tips
This is a dashboard finance ppt powerpoint presentation infographic template graphic tips. This is a three stage process. The stages in this process are dashboard, finance, analysis, business, investment.
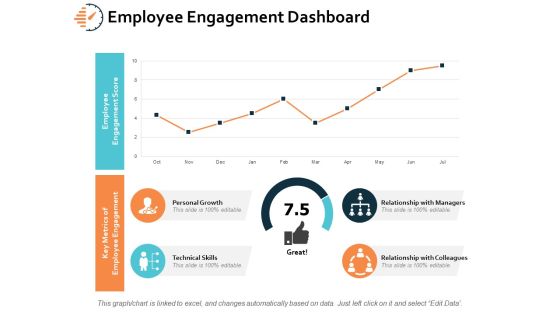
Employee Engagement Dashboard Ppt PowerPoint Presentation Layouts Inspiration
This is a employee engagement dashboard ppt powerpoint presentation layouts inspiration. This is a four stage process. The stages in this process are personal growth, technical skills, marketing, planning, strategy.

Employee Performance Measurement KPI Ppt PowerPoint Presentation Ideas Mockup
This is a employee performance measurement kpi ppt powerpoint presentation ideas mockup. This is a eight stage process. The stages in this process are finance, analysis, business, investment, marketing.
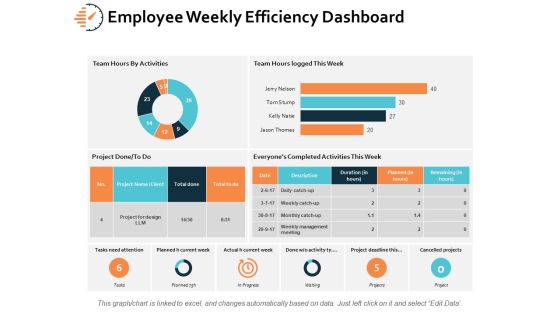
Employee Weekly Efficiency Dashboard Ppt PowerPoint Presentation Infographics Microsoft
This is a employee weekly efficiency dashboard ppt powerpoint presentation infographics microsoft. This is a six stage process. The stages in this process are finance, analysis, business, investment, marketing.
Negative Impacts Of Workplace Stress Finance Ppt PowerPoint Presentation Icon Inspiration
This is a negative impacts of workplace stress finance ppt powerpoint presentation icon inspiration. This is a five stage process. The stages in this process are finance, analysis, business, investment, marketing.
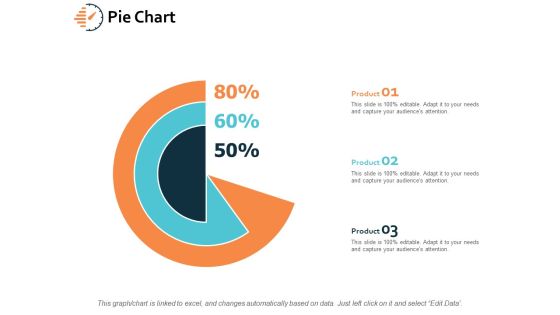
Pie Chart Investment Finance Ppt PowerPoint Presentation File Influencers
This is a pie chart investment finance ppt powerpoint presentation file influencers. This is a three stage process. The stages in this process are finance, analysis, business, investment, marketing.

Decrease Cost And Income Growth Dashboard Ppt PowerPoint Presentation Inspiration Guide
This is a decrease cost and income growth dashboard ppt powerpoint presentation inspiration guide. This is a three stage process. The stages in this process are growth, increase sales, increase revenue.
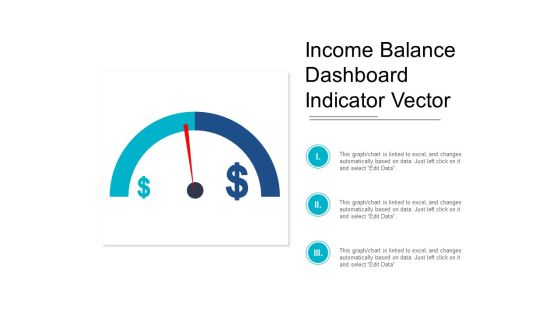
Income Balance Dashboard Indicator Vector Ppt PowerPoint Presentation Professional Diagrams
This is a income balance dashboard indicator vector ppt powerpoint presentation professional diagrams. This is a three stage process. The stages in this process are growth, increase sales, increase revenue.

Return On Capital Employed Product Performance Chart Ppt PowerPoint Presentation Portfolio Visuals
This is a return on capital employed product performance chart ppt powerpoint presentation portfolio visuals. This is a three stage process. The stages in this process are accounting ratio, roce, return on capital employed.
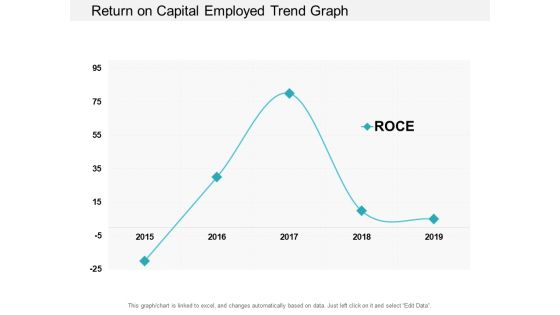
Return On Capital Employed Trend Graph Ppt PowerPoint Presentation Professional Example Topics
This is a return on capital employed trend graph ppt powerpoint presentation professional example topics. This is a one stage process. The stages in this process are accounting ratio, roce, return on capital employed.
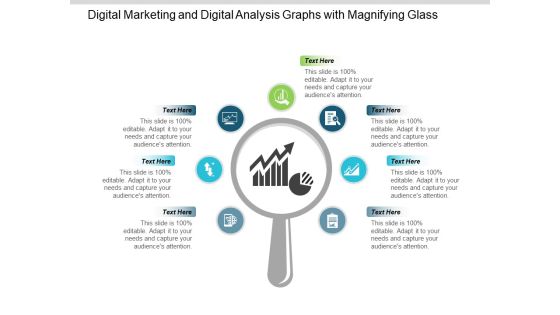
Digital Marketing And Digital Analysis Graphs With Magnifying Glass Ppt PowerPoint Presentation Portfolio Show
This is a digital marketing and digital analysis graphs with magnifying glass ppt powerpoint presentation portfolio show. This is a seven stage process. The stages in this process are digital analytics, digital dashboard, marketing.

Web Analytics For Seo Marketing Ppt PowerPoint Presentation Examples
This is a web analytics for seo marketing ppt powerpoint presentation examples. This is a five stage process. The stages in this process are digital analytics, digital dashboard, marketing.

Web Analytics Traffic Sources And Conversion Rate Ppt PowerPoint Presentation Picture
This is a web analytics traffic sources and conversion rate ppt powerpoint presentation picture. This is a four stage process. The stages in this process are digital analytics, digital dashboard, marketing.
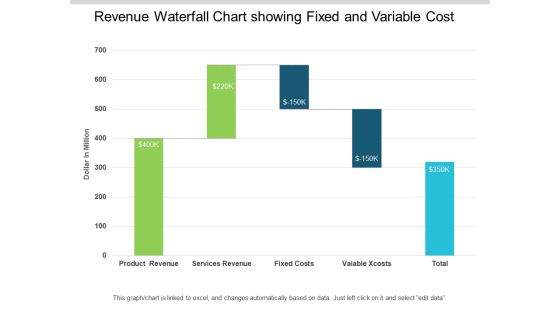
Revenue Waterfall Chart Showing Fixed And Variable Cost Ppt PowerPoint Presentation Infographic Template Images
This is a revenue waterfall chart showing fixed and variable cost ppt powerpoint presentation infographic template images. This is a five stage process. The stages in this process are sales waterfall, waterfall chart, business.

Sales Graph Showing Payouts Losses And Wins Ppt PowerPoint Presentation Pictures Designs Download
This is a sales graph showing payouts losses and wins ppt powerpoint presentation pictures designs download. This is a eight stage process. The stages in this process are sales waterfall, waterfall chart, business.
Waterfall Chart Showing Effective Pricing And Profitability Insight Ppt PowerPoint Presentation Icon Graphics
This is a waterfall chart showing effective pricing and profitability insight ppt powerpoint presentation icon graphics. This is a seven stage process. The stages in this process are sales waterfall, waterfall chart, business.
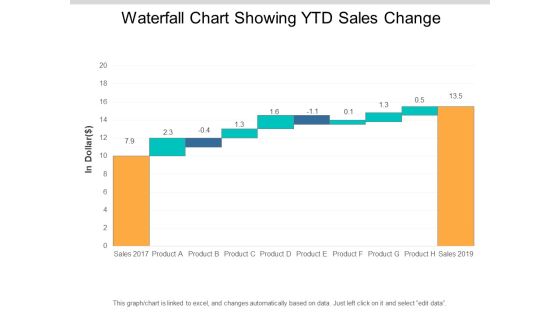
Waterfall Chart Showing Ytd Sales Change Ppt PowerPoint Presentation Professional Format
This is a waterfall chart showing ytd sales change ppt powerpoint presentation professional format. This is a ten stage process. The stages in this process are sales waterfall, waterfall chart, business.

Waterfall Chart With Merchandising Sales Cost And Net Revenue Ppt PowerPoint Presentation Summary Show
This is a waterfall chart with merchandising sales cost and net revenue ppt powerpoint presentation summary show. This is a three stage process. The stages in this process are sales waterfall, waterfall chart, business.

Waterfall Chart With Sales Overheads Interest And Depreciation Ppt PowerPoint Presentation File Display
This is a waterfall chart with sales overheads interest and depreciation ppt powerpoint presentation file display. This is a eight stage process. The stages in this process are sales waterfall, waterfall chart, business.

Waterfall Graph For Income And Expense Analysis Ppt PowerPoint Presentation File Deck
This is a waterfall graph for income and expense analysis ppt powerpoint presentation file deck. This is a eight stage process. The stages in this process are sales waterfall, waterfall chart, business.
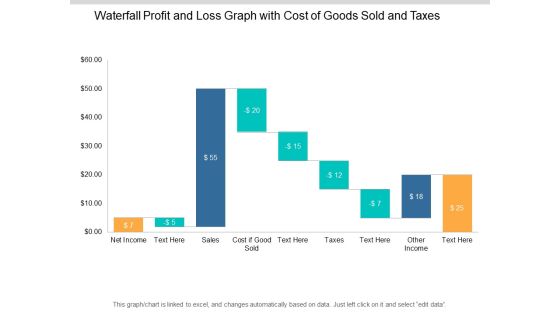
Waterfall Profit And Loss Graph With Cost Of Goods Sold And Taxes Ppt PowerPoint Presentation Show Slideshow
This is a waterfall profit and loss graph with cost of goods sold and taxes ppt powerpoint presentation show slideshow. This is a nine stage process. The stages in this process are sales waterfall, waterfall chart, business.
Predictive Analytics Sales Operational Planning Ppt PowerPoint Presentation Icon Grid Cpb
This is a predictive analytics sales operational planning ppt powerpoint presentation icon grid cpb. This is a three stage process. The stages in this process are predictive analytics sales operational planning.
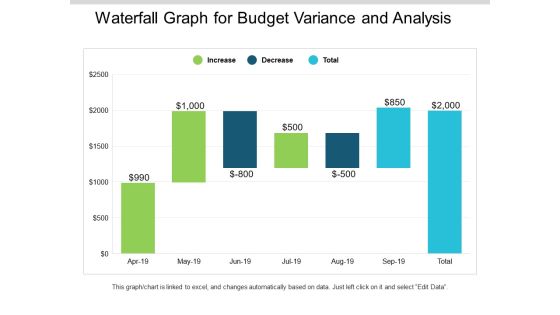
Waterfall Graph For Budget Variance And Analysis Ppt PowerPoint Presentation Slides Mockup
This is a waterfall graph for budget variance and analysis ppt powerpoint presentation slides mockup. This is a three stage process. The stages in this process are profit and loss, balance sheet, income statement, benefit and loss.

Waterfall Graph Showing Births Deaths And Population Change Ppt PowerPoint Presentation Infographic Template Visual Aids
This is a waterfall graph showing births deaths and population change ppt powerpoint presentation infographic template visual aids. This is a three stage process. The stages in this process are profit and loss, balance sheet, income statement, benefit and loss.

Waterfall Graph Showing Business Progress Ppt PowerPoint Presentation Styles Model
This is a waterfall graph showing business progress ppt powerpoint presentation styles model. This is a three stage process. The stages in this process are profit and loss, balance sheet, income statement, benefit and loss.
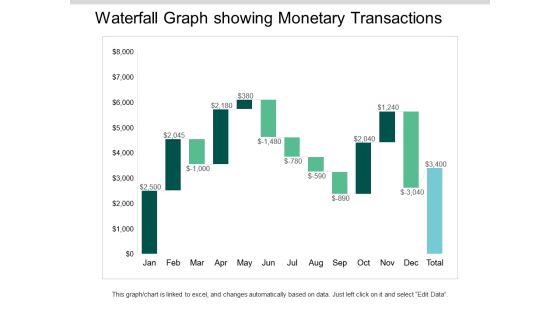
Waterfall Graph Showing Monetary Transactions Ppt PowerPoint Presentation Ideas Visuals
This is a waterfall graph showing monetary transactions ppt powerpoint presentation ideas visuals. This is a three stage process. The stages in this process are profit and loss, balance sheet, income statement, benefit and loss.

Waterfall Graph Showing Net Sales And Gross Profit Ppt PowerPoint Presentation Infographics Format
This is a waterfall graph showing net sales and gross profit ppt powerpoint presentation infographics format. This is a three stage process. The stages in this process are profit and loss, balance sheet, income statement, benefit and loss.
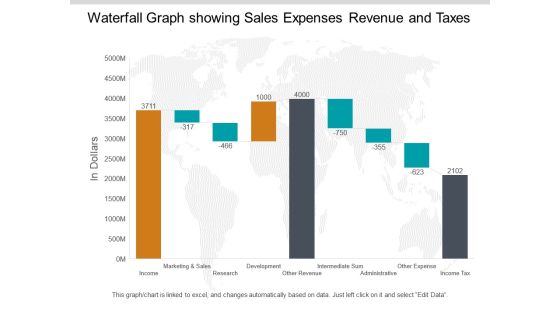
Waterfall Graph Showing Sales Expenses Revenue And Taxes Ppt PowerPoint Presentation Pictures Summary
This is a waterfall graph showing sales expenses revenue and taxes ppt powerpoint presentation pictures summary. This is a three stage process. The stages in this process are profit and loss, balance sheet, income statement, benefit and loss.

Waterfall Graph Summarize Budget 2018 To 2019 Ppt PowerPoint Presentation Summary Slides
This is a waterfall graph summarize budget 2018 to 2019 ppt powerpoint presentation summary slides. This is a three stage process. The stages in this process are profit and loss, balance sheet, income statement, benefit and loss.
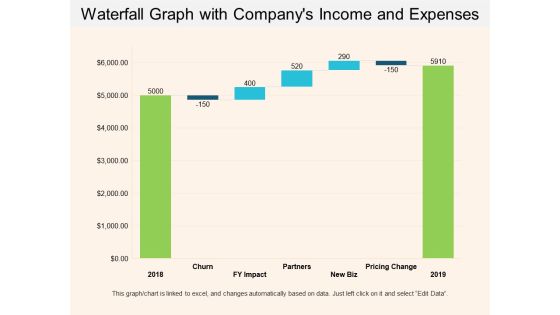
Waterfall Graph With Companys Income And Expenses Ppt PowerPoint Presentation Show Example Introduction
This is a waterfall graph with companys income and expenses ppt powerpoint presentation show example introduction. This is a three stage process. The stages in this process are profit and loss, balance sheet, income statement, benefit and loss.

Waterfall Graph With Monthly Expenses And Savings Ppt PowerPoint Presentation Layouts Clipart Images
This is a waterfall graph with monthly expenses and savings ppt powerpoint presentation layouts clipart images. This is a three stage process. The stages in this process are profit and loss, balance sheet, income statement, benefit and loss.

Business Performance Report Template Ppt PowerPoint Presentation Layouts Influencers Cpb
This is a business performance report template ppt powerpoint presentation layouts influencers cpb. This is a three stage process. The stages in this process are business performance report template.

Public Relations Media Relations Ppt PowerPoint Presentation Layouts Skills Cpb
This is a public relations media relations ppt powerpoint presentation layouts skills cpb. This is a six stage process. The stages in this process are public relations media relations.

Cost Estimating Report Material Quantity And Unit Price Ppt PowerPoint Presentation Styles Graphics Download
This is a cost estimating report material quantity and unit price ppt powerpoint presentation styles graphics download. This is a five stage process. The stages in this process are estimate, guess, evaluate.
Interconnect Graph Layout With Icons And Text Holders Ppt PowerPoint Presentation Inspiration Example Introduction
This is a interconnect graph layout with icons and text holders ppt powerpoint presentation inspiration example introduction. This is a three stage process. The stages in this process are graph theory, chart theory, business.
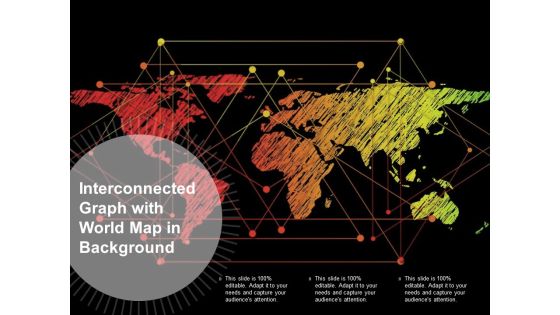
Interconnected Graph With World Map In Background Ppt PowerPoint Presentation Infographics Slide
This is a interconnected graph with world map in background ppt powerpoint presentation infographics slide. This is a three stage process. The stages in this process are graph theory, chart theory, business.
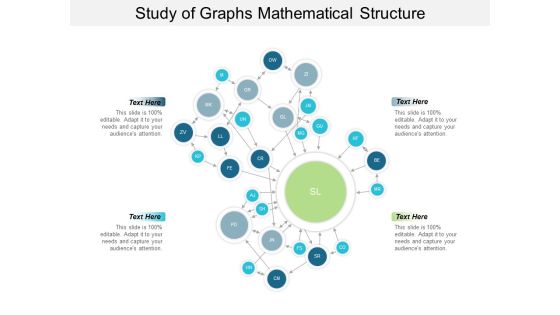
Study Of Graphs Mathematical Structure Ppt PowerPoint Presentation Gallery Background
This is a study of graphs mathematical structure ppt powerpoint presentation gallery background. This is a four stage process. The stages in this process are graph theory, chart theory, business.

Three Graphs For Path Algorithm Ppt PowerPoint Presentation Infographic Template Templates
This is a three graphs for path algorithm ppt powerpoint presentation infographic template templates. This is a three stage process. The stages in this process are graph theory, chart theory, business.

New Product Launch Marketing Ppt PowerPoint Presentation Infographic Template Format Cpb
This is a new product launch marketing ppt powerpoint presentation infographic template format cpb. This is a five stage process. The stages in this process are new product launch marketing.
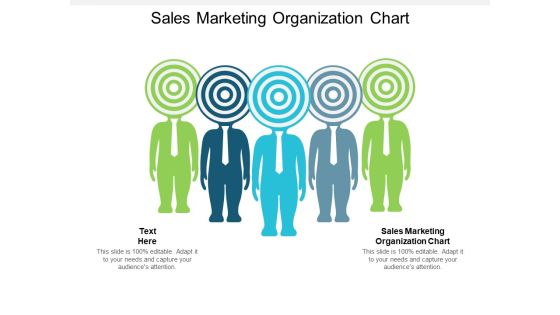
Sales Marketing Organization Chart Ppt PowerPoint Presentation Infographic Template Template Cpb
This is a sales marketing organization chart ppt powerpoint presentation infographic template template cpb. This is a five stage process. The stages in this process are sales marketing organization chart.

Raining Dollars With Handshake Showing Ways To Grow Business Ppt PowerPoint Presentation Ideas Graphics
This is a raining dollars with handshake showing ways to grow business ppt powerpoint presentation ideas graphics. This is a four stage process. The stages in this process are raining money, raining currency, raining dollar.
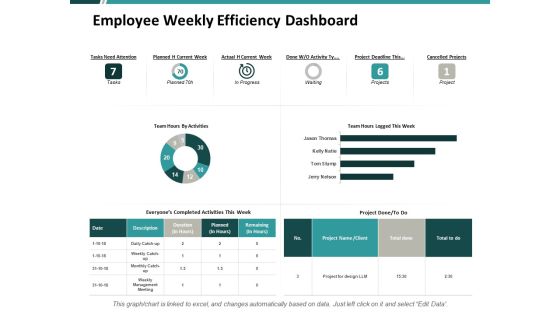
Employee Weekly Efficiency Dashboard Ppt PowerPoint Presentation Portfolio Show
This is a employee weekly efficiency dashboard ppt powerpoint presentation portfolio show. This is a three stage process. The stages in this process are financial, minimum, maximum, marketing, strategy.

Area Chart Finance Marketing Ppt PowerPoint Presentation Gallery Styles
This is a area chart finance marketing ppt powerpoint presentation gallery styles. This is a three stage process. The stages in this process are area chart, finance, marketing, analysis, investment.

Combo Chart Investment Ppt PowerPoint Presentation Summary Infographic Template
This is a combo chart investment ppt powerpoint presentation summary infographic template. This is a three stage process. The stages in this process are finance, analysis, business, investment, marketing.
 Home
Home