Two Stage Process

Cash Flow Green Drop With Dollar Symbol Ppt PowerPoint Presentation Professional Graphic Tips
This is a cash flow green drop with dollar symbol ppt powerpoint presentation professional graphic tips. This is a four stage process. The stages in this process are liquidity, cash assets, solvency.

Dollar Coins On Human Hand Money Saving Vector Ppt PowerPoint Presentation Slides Infographics
This is a dollar coins on human hand money saving vector ppt powerpoint presentation slides infographics. This is a four stage process. The stages in this process are liquidity, cash assets, solvency.
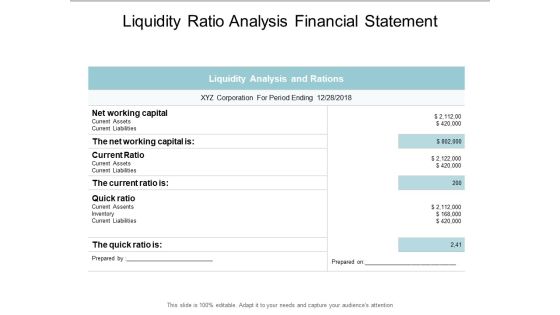
Liquidity Ratio Analysis Financial Statement Ppt PowerPoint Presentation Ideas Layouts
This is a liquidity ratio analysis financial statement ppt powerpoint presentation ideas layouts. This is a four stage process. The stages in this process are liquidity, cash assets, solvency.

B2b Customer Segmentation Attractiveness And Competitive Advantage Ppt PowerPoint Presentation Background Designs
This is a b2b customer segmentation attractiveness and competitive advantage ppt powerpoint presentation background designs. This is a five stage process. The stages in this process are market segmentation, market mapping, segmenting targeting positioning.
Market Target Determining The Attractiveness Ppt PowerPoint Presentation Icon Visual Aids
This is a market target determining the attractiveness ppt powerpoint presentation icon visual aids. This is a three stage process. The stages in this process are market segmentation, market mapping, segmenting targeting positioning.

Strategy To Segment Markets Ppt PowerPoint Presentation Styles Shapes
This is a strategy to segment markets ppt powerpoint presentation styles shapes. This is a six stage process. The stages in this process are market segmentation, market mapping, segmenting targeting positioning.
Financial Maximum Medium Ppt Powerpoint Presentation Icon Master Slide
This is a financial maximum medium ppt powerpoint presentation icon master slide. This is a three stage process. The stages in this process are financial, minimum, maximum, marketing, strategy.
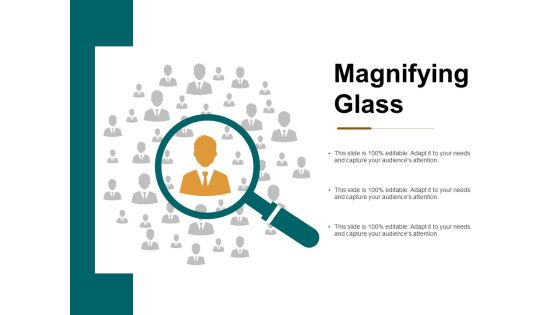
Magnifying Glass Technology Marketing Ppt Powerpoint Presentation Layouts Demonstration
This is a magnifying glass technology marketing ppt powerpoint presentation layouts demonstration. This is a three stage process. The stages in this process are magnifying glass, research, marketing, strategy, business.

Area Chart Finance Ppt PowerPoint Presentation Styles Designs Download
This is a area chart finance ppt powerpoint presentation styles designs download. This is a three stage process. The stages in this process are finance, analysis, business, investment, marketing.

Communication Plan Frequency Ppt PowerPoint Presentation Styles Topics
This is a communication plan frequency ppt powerpoint presentation styles topics. This is a five stage process. The stages in this process are frequency, responsibility, stakeholders, communication method, extranet.
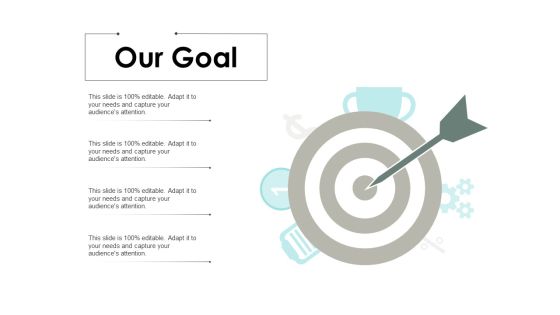
Our Goal Arrow Target Ppt PowerPoint Presentation Layouts Brochure
This is a our goal arrow target ppt powerpoint presentation layouts brochure. This is a four stage process. The stages in this process are arrow, marketing, strategy, competition, success.

Task Matrix Resources Ppt PowerPoint Presentation Summary Microsoft
This is a task matrix resources ppt powerpoint presentation summary microsoft. This is a five stage process. The stages in this process are television design, computer design, camera design, provide resources, primary responsibility.
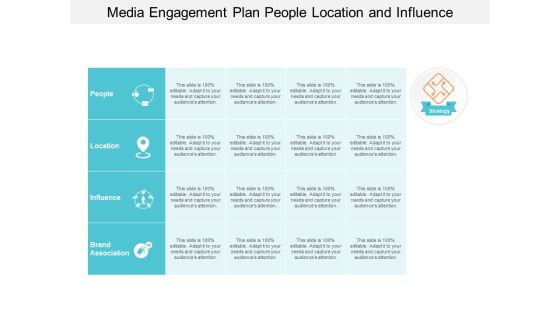
Media Engagement Plan People Location And Influence Ppt PowerPoint Presentation Summary Themes
This is a media engagement plan people location and influence ppt powerpoint presentation summary themes. This is a four stage process. The stages in this process are digital engagement, online engagement, virtual engagement.

Financial Maximum Medium Ppt Powerpoint Presentation Infographics Slideshow Ppt Powerpoint Presentation Portfolio Ideas
This is a financial maximum medium ppt powerpoint presentation infographics slideshow ppt powerpoint presentation portfolio ideas. This is a three stage process. The stages in this process are financial, minimum, maximum, marketing, strategy.
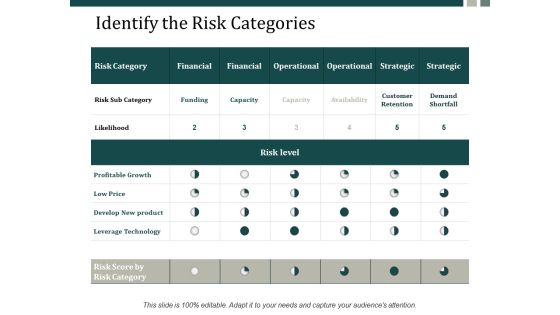
Identify The Risk Categories Ppt Powerpoint Presentation Infographics Structure Ppt Powerpoint Presentation Gallery Summary
This is a identify the risk categories ppt powerpoint presentation infographics structure ppt powerpoint presentation gallery summary. This is a six stage process. The stages in this process are financial, operational, strategic, capacity, profitable growth.

Area Graph Showing Sales Trends Over Time Ppt PowerPoint Presentation Model Background Designs
This is a area graph showing sales trends over time ppt powerpoint presentation model background designs. This is a three stage process. The stages in this process are financial analysis, quantitative, statistical modelling.

Data Chart For Distribution Of Vehicles By Origin And Type Ppt PowerPoint Presentation Infographics Topics
This is a data chart for distribution of vehicles by origin and type ppt powerpoint presentation infographics topics. This is a four stage process. The stages in this process are financial analysis, quantitative, statistical modelling.

Data Chart For Individual Income Analysis Ppt PowerPoint Presentation Layouts Visual Aids
This is a data chart for individual income analysis ppt powerpoint presentation layouts visual aids. This is a five stage process. The stages in this process are financial analysis, quantitative, statistical modelling.
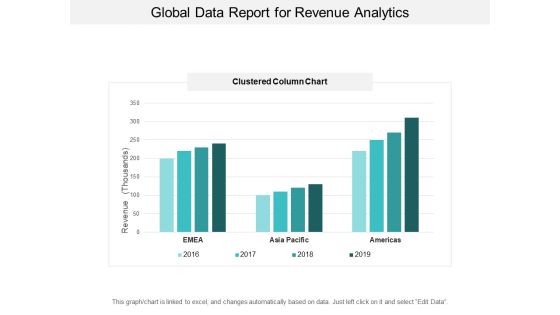
Global Data Report For Revenue Analytics Ppt PowerPoint Presentation Inspiration Visuals
This is a global data report for revenue analytics ppt powerpoint presentation inspiration visuals. This is a four stage process. The stages in this process are financial analysis, quantitative, statistical modelling.
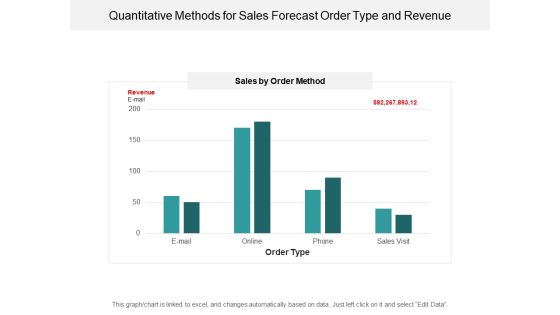
Quantitative Methods For Sales Forecast Order Type And Revenue Ppt PowerPoint Presentation Styles Show
This is a quantitative methods for sales forecast order type and revenue ppt powerpoint presentation styles show. This is a four stage process. The stages in this process are financial analysis, quantitative, statistical modelling.

Quarterly Financial Performance Ratio Analysis Ppt PowerPoint Presentation Model Format Ideas
This is a quarterly financial performance ratio analysis ppt powerpoint presentation model format ideas. This is a four stage process. The stages in this process are financial analysis, quantitative, statistical modelling.
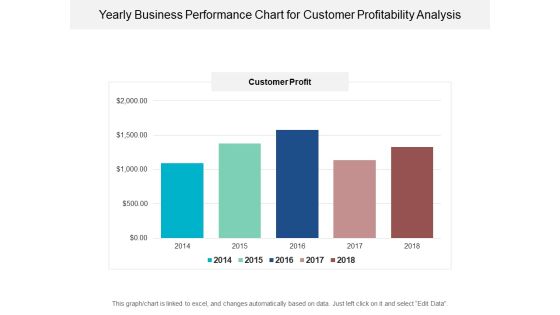
Yearly Business Performance Chart For Customer Profitability Analysis Ppt PowerPoint Presentation Ideas Picture
This is a yearly business performance chart for customer profitability analysis ppt powerpoint presentation ideas picture. This is a five stage process. The stages in this process are financial analysis, quantitative, statistical modelling.
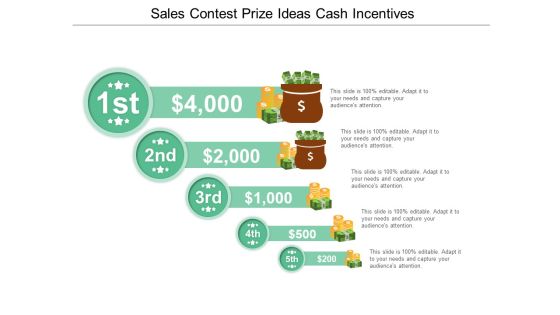
Sales Contest Prize Ideas Cash Incentives Ppt PowerPoint Presentation Styles Portfolio
This is a sales contest prize ideas cash incentives ppt powerpoint presentation styles portfolio. This is a five stage process. The stages in this process are sales contest, sales competition, sales opposition.

Sales Contest To Motivate Team And Increase Productivity Ppt PowerPoint Presentation Inspiration Brochure
This is a sales contest to motivate team and increase productivity ppt powerpoint presentation inspiration brochure. This is a four stage process. The stages in this process are sales contest, sales competition, sales opposition.

January 2000 July 2013 Marketing Ppt PowerPoint Presentation File Slide Download
This is a january 2000 july 2013 marketing ppt powerpoint presentation file slide download. This is a four stage process. The stages in this process are finance, analysis, business, investment, marketing.

Marketing Return On Investment Ppt PowerPoint Presentation Infographics Files
This is a marketing return on investment ppt powerpoint presentation infographics files. This is a three stage process. The stages in this process are marketing investment, impressions, return on investment, finance, marketing.
Our Target Arrow Planning Ppt PowerPoint Presentation Visual Aids Backgrounds
This is a our target arrow planning ppt powerpoint presentation visual aids backgrounds. This is a three stage process. The stages in this process are arrow, marketing, strategy, competition, success.
Magnify Glass Technology Ppt Powerpoint Presentation Icon Slide Portrait
This is a magnify glass technology ppt powerpoint presentation icon slide portrait. This is a four stage process. The stages in this process are magnifying glass, research, marketing, strategy, business.

Web Analytics Dashboard Click Through And Conversion Rate Ppt PowerPoint Presentation Professional
This is a web analytics dashboard click through and conversion rate ppt powerpoint presentation professional. This is a three stage process. The stages in this process are marketing analytics, marketing performance, marketing discovery.

Business Planning Timeline And Financial Forecasting Ppt PowerPoint Presentation Pictures Show
This is a business planning timeline and financial forecasting ppt powerpoint presentation pictures show. This is a three stage process. The stages in this process are year in review, yearly highlights, countdowns.
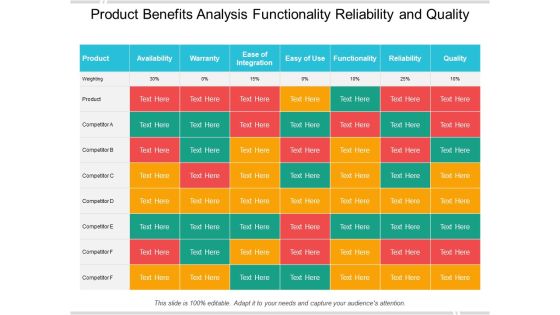
Product Benefits Analysis Functionality Reliability And Quality Ppt PowerPoint Presentation Slides Model
This is a product benefits analysis functionality reliability and quality ppt powerpoint presentation slides model. This is a seven stage process. The stages in this process are competitive analysis, competitive strength assessment.
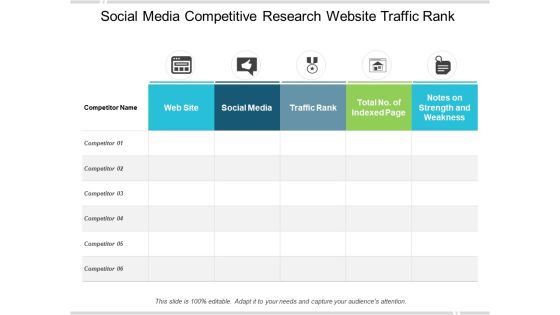
Social Media Competitive Research Website Traffic Rank Ppt PowerPoint Presentation Infographics Professional
This is a social media competitive research website traffic rank ppt powerpoint presentation infographics professional. This is a five stage process. The stages in this process are competitive analysis, competitive strength assessment.

Ways Of Real Estate Online Marketing Ppt PowerPoint Presentation Professional Summary
This is a ways of real estate online marketing ppt powerpoint presentation professional summary. This is a three stage process. The stages in this process are digital marketing real estate, online marketing real estate, internet marketing real estate.

Product Performance And Profitability Report Unit Costs Sales And Revenues Analysis Ppt PowerPoint Presentation Model Show
This is a product performance and profitability report unit costs sales and revenues analysis ppt powerpoint presentation model show. This is a five stage process. The stages in this process are business unit profitability, profitable organization, corporate unit profitability.
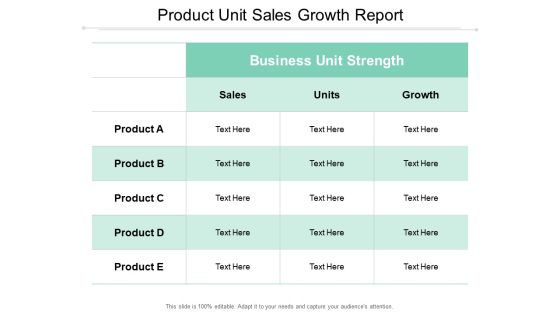
Product Unit Sales Growth Report Ppt PowerPoint Presentation Show Visual Aids
This is a product unit sales growth report ppt powerpoint presentation show visual aids. This is a three stage process. The stages in this process are business unit profitability, profitable organization, corporate unit profitability.

Unit Economic Profitability Cost Volume Analysis Chart Ppt PowerPoint Presentation Styles Graphics Design
This is a unit economic profitability cost volume analysis chart ppt powerpoint presentation styles graphics design. This is a five stage process. The stages in this process are business unit profitability, profitable organization, corporate unit profitability.
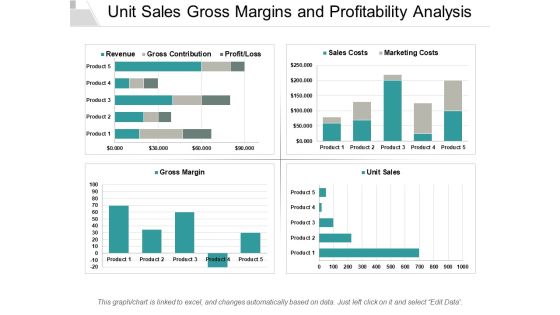
Unit Sales Gross Margins And Profitability Analysis Ppt PowerPoint Presentation Ideas Outfit
This is a unit sales gross margins and profitability analysis ppt powerpoint presentation ideas outfit. This is a four stage process. The stages in this process are business unit profitability, profitable organization, corporate unit profitability.
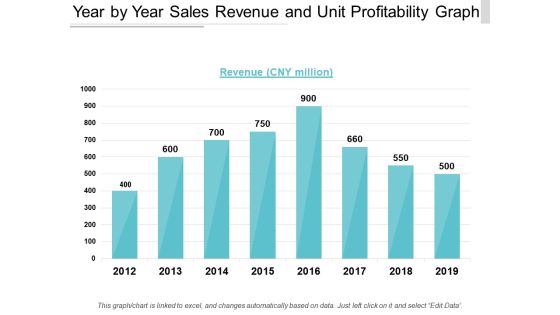
Year By Year Sales Revenue And Unit Profitability Graph Ppt PowerPoint Presentation Show Professional
This is a year by year sales revenue and unit profitability graph ppt powerpoint presentation show professional. This is a eight stage process. The stages in this process are business unit profitability, profitable organization, corporate unit profitability.

Thank You For Watching Software Plus Services Ppt Powerpoint Presentation Portfolio Display
This is a thank you for watching software plus services ppt powerpoint presentation portfolio display. This is a one stage process. The stages in this process are thank you.

Area Chart Finance Marketing Ppt PowerPoint Presentation Summary Icons
This is a area chart finance marketing ppt powerpoint presentation summary icons. This is a three stage process. The stages in this process are area chart, finance, marketing, analysis, investment.
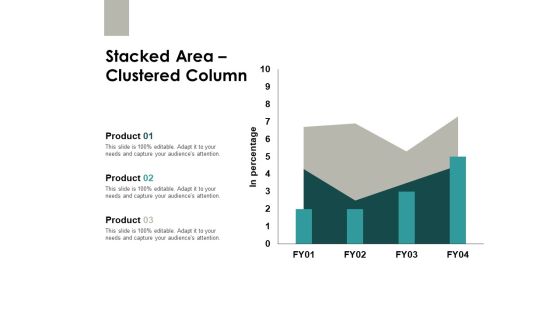
Stacked Area Clustered Column Finance Ppt PowerPoint Presentation Slides Images
This is a stacked area clustered column finance ppt powerpoint presentation slides images. This is a three stage process. The stages in this process are area chart, finance, marketing, analysis, investment.

Thank You Six Building Blocks Of Digital Change Ppt PowerPoint Presentation Infographic Template Good
This is a thank you six building blocks of digital change ppt powerpoint presentation infographic template good. This is a one stage process. The stages in this process are thank you.

Clustered Column Chart Finance Ppt PowerPoint Presentation Gallery Styles
This is a clustered column chart finance ppt powerpoint presentation gallery styles. This is a three stage process. The stages in this process are finance, analysis, business, investment, marketing.

Thank You Six Building Blocks Of Digital Transformation Ppt PowerPoint Presentation Slides Infographics
This is a thank you six building blocks of digital transformation ppt powerpoint presentation slides infographics. This is a one stage process. The stages in this process are thank you.
Networking Icon Circles Connecting Together Ppt PowerPoint Presentation Infographic Template Clipart Images
This is a networking icon circles connecting together ppt powerpoint presentation infographic template clipart images. This is a three stage process. The stages in this process are computer networking, flow networking, traffic flow.

Kpis In Shipping Perfect Order Rate And On Time Shipment Ppt PowerPoint Presentation Show Guide
This is a kpis in shipping perfect order rate and on time shipment ppt powerpoint presentation show guide. This is a six stage process. The stages in this process are logistics performance, logistics dashboard, logistics kpis.
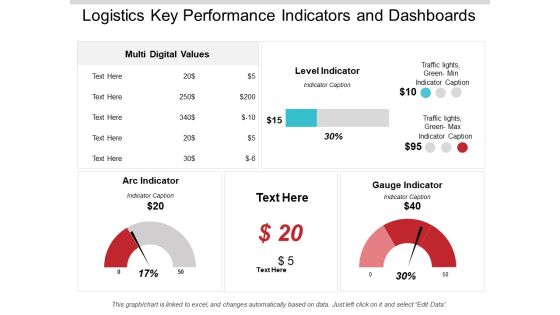
Logistics Key Performance Indicators And Dashboards Ppt PowerPoint Presentation Infographics Background Image
This is a logistics key performance indicators and dashboards ppt powerpoint presentation infographics background image. This is a three stage process. The stages in this process are logistics performance, logistics dashboard, logistics kpis.
Logistics Kpis And Metrics Percentage Of Orders Delivered Ppt PowerPoint Presentation Icon
This is a logistics kpis and metrics percentage of orders delivered ppt powerpoint presentation icon. This is a five stage process. The stages in this process are logistics performance, logistics dashboard, logistics kpis.
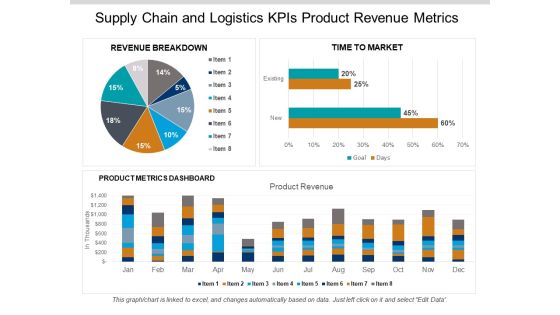
Supply Chain And Logistics Kpis Product Revenue Metrics Ppt PowerPoint Presentation Gallery Aids
This is a supply chain and logistics kpis product revenue metrics ppt powerpoint presentation gallery aids. This is a three stage process. The stages in this process are logistics performance, logistics dashboard, logistics kpis.

Supply Chain Metrics Fleet Efficiency Loading Time And Weight Ppt PowerPoint Presentation Portfolio Guidelines
This is a supply chain metrics fleet efficiency loading time and weight ppt powerpoint presentation portfolio guidelines. This is a four stage process. The stages in this process are logistics performance, logistics dashboard, logistics kpis.

Customer Satisfaction Levels High Medium Low Indicator Dashboard Ppt PowerPoint Presentation Icon Show
This is a customer satisfaction levels high medium low indicator dashboard ppt powerpoint presentation icon show. This is a six stage process. The stages in this process are performance dashboard, performance meter, performance kpi.

Dashboard Vector With Pointer And Text Holders Ppt PowerPoint Presentation Portfolio Format Ideas
This is a dashboard vector with pointer and text holders ppt powerpoint presentation portfolio format ideas. This is a four stage process. The stages in this process are performance dashboard, performance meter, performance kpi.

KPI Dashboards And Operational Metrics Ppt PowerPoint Presentation Portfolio Infographics

Low High Performance Measurement Indicator Dashboard Ppt PowerPoint Presentation Summary Images
This is a low high performance measurement indicator dashboard ppt powerpoint presentation summary images. This is a five stage process. The stages in this process are performance dashboard, performance meter, performance kpi.

Thank You Sample PowerPoint Presentation New Product Ppt PowerPoint Presentation Ideas Inspiration
This is a thank you sample powerpoint presentation new product ppt powerpoint presentation ideas inspiration. This is a one stage process. The stages in this process are thank you, word, greeting.

100 Percent Stacked Bar Finance Ppt PowerPoint Presentation Model Templates
This is a 100 percent stacked bar finance ppt powerpoint presentation model templates. This is a three stage process. The stages in this process are finance, analysis, business, investment, marketing.

Clustered Bar Investment Planning Ppt PowerPoint Presentation Infographic Template Deck
This is a clustered bar investment planning ppt powerpoint presentation infographic template deck. This is a three stage process. The stages in this process are finance, analysis, business, investment, marketing.
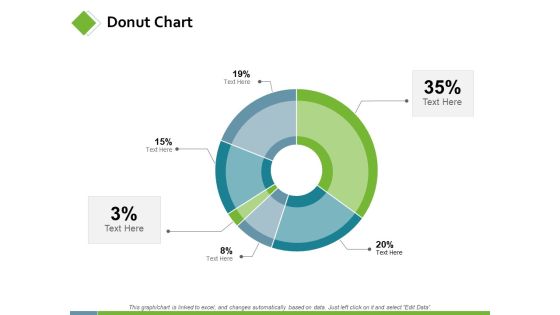
Donut Chart Marketing Planning Ppt PowerPoint Presentation Model Slideshow
This is a donut chart marketing planning ppt powerpoint presentation model slideshow. This is a six stage process. The stages in this process are finance, analysis, business, investment, marketing.

Future Trends In Multi Channel Retailing Ppt PowerPoint Presentation Infographic Template Rules
This is a future trends in multi channel retailing ppt powerpoint presentation infographic template rules. This is a four stage process. The stages in this process are mobile commerce, online shopping, planning, marketing, business.
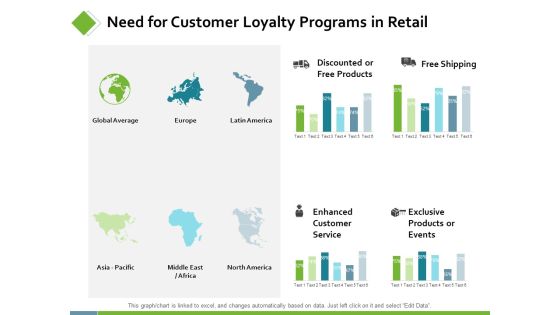
Need For Customer Loyalty Programs In Retail Ppt PowerPoint Presentation Infographic Template Introduction
This is a need for customer loyalty programs in retail ppt powerpoint presentation infographic template introduction. This is a four stage process. The stages in this process are finance, analysis, business, investment, marketing.
 Home
Home