Turnover Dashboard
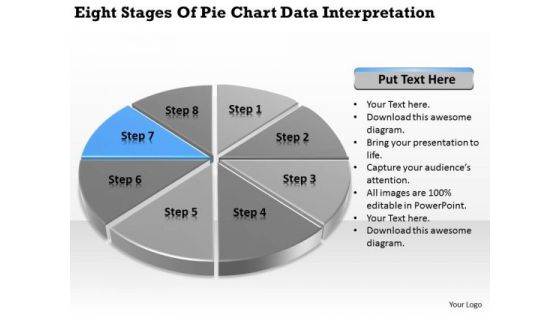
Stages Of Pie Chart Data Interpretation Business Plan Template PowerPoint Templates
We present our stages of pie chart data interpretation business plan template PowerPoint templates.Download and present our Circle Charts PowerPoint Templates because You can Stir your ideas in the cauldron of our PowerPoint Templates and Slides. Cast a magic spell on your audience. Download our Marketing PowerPoint Templates because Our PowerPoint Templates and Slides will let you Hit the target. Go the full distance with ease and elan. Use our Business PowerPoint Templates because Our PowerPoint Templates and Slides are truly out of this world. Even the MIB duo has been keeping tabs on our team. Download our Shapes PowerPoint Templates because Watching this your Audience will Grab their eyeballs, they wont even blink. Download our Process and Flows PowerPoint Templates because It will Give impetus to the hopes of your colleagues. Our PowerPoint Templates and Slides will aid you in winning their trust.Use these PowerPoint slides for presentations relating to achievement, analysis, background, bank, banking, business, calculation, chart, circle, commerce, commercial, commission, concept, credit, crisis, debt, deposit, design, detail, diagram, earnings, economics, economy, element, finance, goal, gold, golden, graph, graphic, growth, icon, idea, illustration, income, increase, invest, isolated, level, loss, market, marketing, metal, modern, money, new, object, part, percent, percentage, pie, plot, politics, profit, progress, ratio, reflection, reflective. The prominent colors used in the PowerPoint template are Blue, Gray, Black.
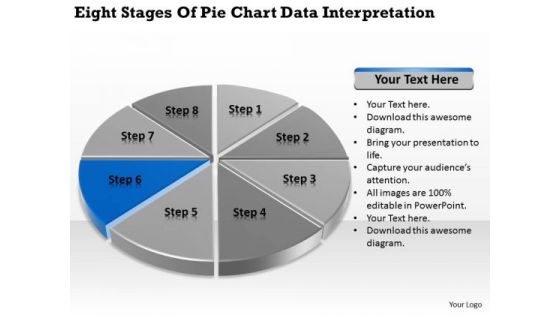
Stages Of Pie Chart Data Interpretation Example Business Plan PowerPoint Slides
We present our stages of pie chart data interpretation example business plan PowerPoint Slides.Download and present our Circle Charts PowerPoint Templates because It will let you Set new benchmarks with our PowerPoint Templates and Slides. They will keep your prospects well above par. Download our Marketing PowerPoint Templates because Our PowerPoint Templates and Slides will weave a web of your great ideas. They are gauranteed to attract even the most critical of your colleagues. Use our Business PowerPoint Templates because It will Strengthen your hand with your thoughts. They have all the aces you need to win the day. Present our Shapes PowerPoint Templates because It will get your audience in sync. Present our Process and Flows PowerPoint Templates because Our PowerPoint Templates and Slides will generate and maintain the level of interest you desire. They will create the impression you want to imprint on your audience.Use these PowerPoint slides for presentations relating to achievement, analysis, background, bank, banking, business, calculation, chart, circle, commerce, commercial, commission, concept, credit, crisis, debt, deposit, design, detail, diagram, earnings, economics, economy, element, finance, goal, gold, golden, graph, graphic, growth, icon, idea, illustration, income, increase, invest, isolated, level, loss, market, marketing, metal, modern, money, new, object, part, percent, percentage, pie, plot, politics, profit, progress, ratio, reflection, reflective. The prominent colors used in the PowerPoint template are Blue navy, Gray, Black.

Stages Of Pie Chart Data Interpretation How To Write Business Plan PowerPoint Templates
We present our stages of pie chart data interpretation how to write business plan PowerPoint templates.Present our Circle Charts PowerPoint Templates because Our PowerPoint Templates and Slides will provide you a launch platform. Give a lift off to your ideas and send them into orbit. Present our Marketing PowerPoint Templates because Our PowerPoint Templates and Slides will let you Hit the right notes. Watch your audience start singing to your tune. Use our Business PowerPoint Templates because Our PowerPoint Templates and Slides come in all colours, shades and hues. They help highlight every nuance of your views. Download our Shapes PowerPoint Templates because It can Leverage your style with our PowerPoint Templates and Slides. Charm your audience with your ability. Use our Process and Flows PowerPoint Templates because You can Connect the dots. Fan expectations as the whole picture emerges.Use these PowerPoint slides for presentations relating to achievement, analysis, background, bank, banking, business, calculation, chart, circle, commerce, commercial, commission, concept, credit, crisis, debt, deposit, design, detail, diagram, earnings, economics, economy, element, finance, goal, gold, golden, graph, graphic, growth, icon, idea, illustration, income, increase, invest, isolated, level, loss, market, marketing, metal, modern, money, new, object, part, percent, percentage, pie, plot, politics, profit, progress, ratio, reflection, reflective. The prominent colors used in the PowerPoint template are Blue, Gray, Black.
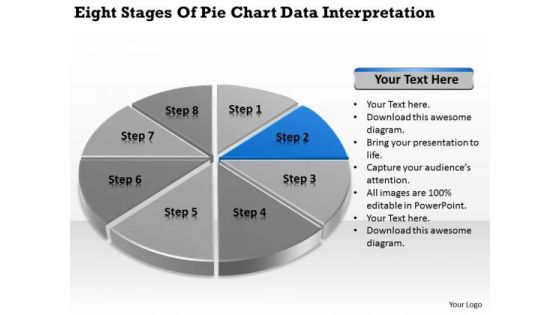
Stages Of Pie Chart Data Interpretation Vending Machine Business Plan PowerPoint Slides
We present our stages of pie chart data interpretation vending machine business plan PowerPoint Slides.Present our Circle Charts PowerPoint Templates because You should Bet on your luck with our PowerPoint Templates and Slides. Be assured that you will hit the jackpot. Present our Marketing PowerPoint Templates because Our PowerPoint Templates and Slides will provide you the cutting edge. Slice through the doubts in the minds of your listeners. Download our Business PowerPoint Templates because you should Experience excellence with our PowerPoint Templates and Slides. They will take your breath away. Download our Shapes PowerPoint Templates because It will Raise the bar of your Thoughts. They are programmed to take you to the next level. Present our Process and Flows PowerPoint Templates because Our PowerPoint Templates and Slides will give good value for money. They also have respect for the value of your time.Use these PowerPoint slides for presentations relating to achievement, analysis, background, bank, banking, business, calculation, chart, circle, commerce, commercial, commission, concept, credit, crisis, debt, deposit, design, detail, diagram, earnings, economics, economy, element, finance, goal, gold, golden, graph, graphic, growth, icon, idea, illustration, income, increase, invest, isolated, level, loss, market, marketing, metal, modern, money, new, object, part, percent, percentage, pie, plot, politics, profit, progress, ratio, reflection, reflective. The prominent colors used in the PowerPoint template are Blue, Gray, Black.
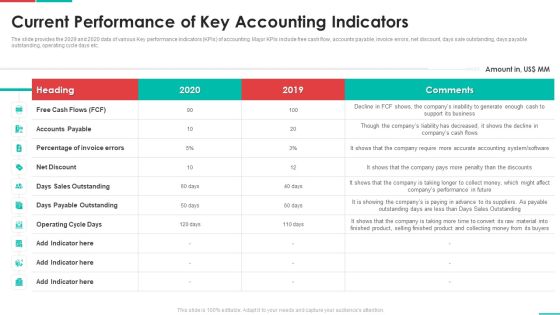
Roadmap For Financial Accounting Transformation Current Performance Of Key Accounting Indicators Elements PDF
The slide provides the 2029 and 2020 data of various Key performance indicators KPIs of accounting. Major KPIs include free cash flow, accounts payable, invoice errors, net discount, days sale outstanding, days payable outstanding, operating cycle days etc. Deliver an awe inspiring pitch with this creative roadmap for financial accounting transformation current performance of key accounting indicators elements pdf bundle. Topics like accounts payable, operating cycle days, days payable outstanding, net discount can be discussed with this completely editable template. It is available for immediate download depending on the needs and requirements of the user.

Competitive Analysis Financial And Operational Data Ppt Infographic Template Structure PDF
The slide provides the Competitive landscape of the company on the basis of financial data sales and profit and operational data employee count, locations, number of branches, year of existence, interest rate etc.Deliver an awe-inspiring pitch with this creative competitive analysis financial and operational data ppt infographic template structure pdf. bundle. Topics like revenue, interest income, employee count can be discussed with this completely editable template. It is available for immediate download depending on the needs and requirements of the user.

Predictive Data Model Predictive Analytics In Marketing Automation Demonstration PDF
This slide talks about marketing automation by predictive analytics, and this will reshape the market industry. It also includes how this process will work and how automatic systems will detect the searched keywords and will inform the sales team about the leads in the funnel when they will make any social activity. This Predictive Data Model Predictive Analytics In Marketing Automation Demonstration PDF from Slidegeeks makes it easy to present information on your topic with precision. It provides customization options, so you can make changes to the colors, design, graphics, or any other component to create a unique layout. It is also available for immediate download, so you can begin using it right away. Slidegeeks has done good research to ensure that you have everything you need to make your presentation stand out. Make a name out there for a brilliant performance.

Integrating Data Privacy System Data Privacy Vs Data Security Ppt Icon Guidelines PDF
This slide compares data privacy with data security, indicating that security is concerned with safeguarding data, and privacy is about responsible data usage. Make sure to capture your audiences attention in your business displays with our gratis customizable Integrating Data Privacy System Data Privacy Vs Data Security Ppt Icon Guidelines PDF. These are great for business strategies, office conferences, capital raising or task suggestions. If you desire to acquire more customers for your tech business and ensure they stay satisfied, create your own sales presentation with these plain slides.

Business Process PowerPoint Templates Sales Measuring Growth Ppt Slides
Business Process PowerPoint Templates Sales Measuring Growth PPT Slides-This Diagram shows growing plants that is a conceptual representation for measuring growth -Business Process PowerPoint Templates Sales Measuring Growth PPT Slides-This template can be used for presentations relating to Accounting, Accounts, Analysis, Business, Capital, Cash, Coins, Concept, Conceptual, Corporate, Data, Detail, Earnings, Evaluate, Finance, Financial, Gains, Golden, Green, Growing, Growth, Hand, Income, Increasing, Indicator, Measuring

Analysis Techniques For Sales Growth Sales Target Metrics Pictures PDF
This slide presents multiple techniques to analyse Sales Target Metrics for sales growth helpful to investigate underlying data and look for efficiencies. It includes methods such as net working capital, sales growth, affordable growth rate and break even percentage that can prove to be highly effective. Presenting Analysis Techniques For Sales Growth Sales Target Metrics Pictures PDF to dispense important information. This template comprises four stages. It also presents valuable insights into the topics including Net Working Capital, Affordable Growth Rate, Break Even Percentage. This is a completely customizable PowerPoint theme that can be put to use immediately. So, download it and address the topic impactfully.

Business Diagram Seven Staged Reverse Pyramid For Data Presentation Template
This business slide is designed with seven staged pyramid diagram. Download this professional slide to depict sales and marketing analysis. This image slide is best to present your newer thoughts.
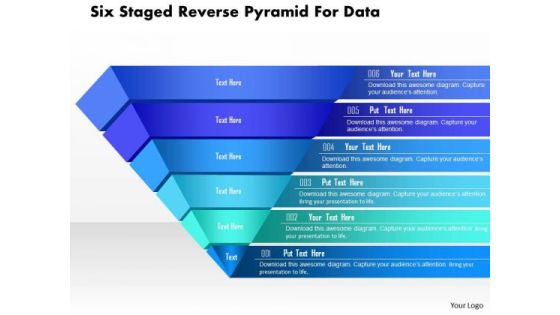
Business Diagram Six Staged Reverse Pyramid For Data Presentation Template
This business slide is designed with six staged pyramid diagram. Download this professional slide to depict sales and marketing analysis. This image slide is best to present your newer thoughts.

Corporate Financial Statement To Report Income Of Historical And Forecasted Period Graphics PDF
This slide consists of income statement which communicates the net earnings of a company to make forecasts about future financial position. The key elements are revenue, gross profit, expenses, earnings before tax and net earnings. Showcasing this set of slides titled Corporate Financial Statement To Report Income Of Historical And Forecasted Period Graphics PDF. The topics addressed in these templates are Revenue, Gross Profit, Marketing Expenses. All the content presented in this PPT design is completely editable. Download it and make adjustments in color, background, font etc. as per your unique business setting.

Quantitative Data Analysis Icon For Product Sales Evaluation Ppt Visual Aids Deck PDF
Showcasing this set of slides titled Quantitative Data Analysis Icon For Product Sales Evaluation Ppt Visual Aids Deck PDF. The topics addressed in these templates are Quantitative Data, Analysis Icon, Product Sales Evaluation. All the content presented in this PPT design is completely editable. Download it and make adjustments in color, background, font etc. as per your unique business setting.

Key Evaluation Metrics Ppt PowerPoint Presentation Show Guide
This is a key evaluation metrics ppt powerpoint presentation show guide. This is a five stage process. The stages in this process are donut, icons, business, strategy, analysis.

Guide For Marketing Analytics To Improve Decisions Perform Marketing Performance Competitive Analysis Sample PDF
The following slide covers comparison of company performance with key industry leaders to gain key insights and required data. It includes elements such as market share, product price, target audience, customer satisfaction, weaknesses, marketing strategy etc. Make sure to capture your audiences attention in your business displays with our gratis customizable Guide For Marketing Analytics To Improve Decisions Perform Marketing Performance Competitive Analysis Sample PDF. These are great for business strategies, office conferences, capital raising or task suggestions. If you desire to acquire more customers for your tech business and ensure they stay satisfied, create your own sales presentation with these plain slides.

Sales Trend Assessment Diagram Powerpoint Slides Show
This is a sales trend assessment diagram powerpoint slides show. This is a four stage process. The stages in this process are relationships, teams, sales productivity, leadership.
Healthcare Equipment Sale Trends Icon Download PDF
Presenting Healthcare Equipment Sale Trends Icon Download PDF to dispense important information. This template comprises three stages. It also presents valuable insights into the topics including Healthcare Equipment, Sale Trends Icon. This is a completely customizable PowerPoint theme that can be put to use immediately. So, download it and address the topic impactfully.

Essential Features Of Customer Relationship Management Software Formats PDF
This slide shows the essential features of customer relationship management software which includes customer contact management, managing prospects, opportunity management, forecasting sales, marketing technology, sales data analysis, statistical reports, etc. Presenting Essential Features Of Customer Relationship Management Software Formats PDF to dispense important information. This template comprises tweleve stages. It also presents valuable insights into the topics including Marketing Technology, Sales Data Analysis, Statistical Reports. This is a completely customizable PowerPoint theme that can be put to use immediately. So, download it and address the topic impactfully.

Sales Seasonal Trends Ppt Example 2015
This is a sales seasonal trends ppt example 2015. This is a six stage process. The stages in this process are process, marketing, analysis, management, arrows.

Reshaping Sales Trends Diagram Ppt Files
This is a reshaping sales trends diagram ppt files. This is a twelve stage process. The stages in this process are relationships, transactions, teams, individuals, sales productivity, sales volume, leadership, management, entrepreneurial, administrative, global, local.
Projection Of Major Kpis Related To Customer Onboarding Ppt Icon Example PDF
This slide provides the projections of key performance indicators KPIs related to customer onboarding. KPIs covered in this slide include number of customers, customer churn rate, customer retention rate etc. Deliver an awe-inspiring pitch with this creative projection of major kpis related to customer onboarding ppt icon example pdf. bundle. Topics like customer churn rate, customer retention rate, indicator, number of customers can be discussed with this completely editable template. It is available for immediate download depending on the needs and requirements of the user.

Recruitment Metrics For Data Driven Selection Process Ppt PowerPoint Presentation Inspiration Graphics Download PDF
This slide highlights the key performance indicators to analyze hiring process in organization which includes time to fill, first year attrition rate, cost per hire, candidate job satisfaction and interview to hire ratio. Persuade your audience using this Recruitment Metrics For Data-Driven Selection Process Ppt PowerPoint Presentation Inspiration Graphics Download PDF. This PPT design covers one stage, thus making it a great tool to use. It also caters to a variety of topics including Candidate Job, Satisfaction, Attrition Rate. Download this PPT design now to present a convincing pitch that not only emphasizes the topic but also showcases your presentation skills.

Customer Data Analysis Matrix For Assessment Of Sales Channel Template PDF
This slide shows the win loss analysis matrix for the assessment of best sales channel in terms of development resources and costs and revenue potential. Presenting customer data analysis matrix for assessment of sales channel template pdf to dispense important information. This template comprises four stages. It also presents valuable insights into the topics including customer data analysis matrix for assessment of sales channel. This is a completely customizable PowerPoint theme that can be put to use immediately. So, download it and address the topic impactfully.
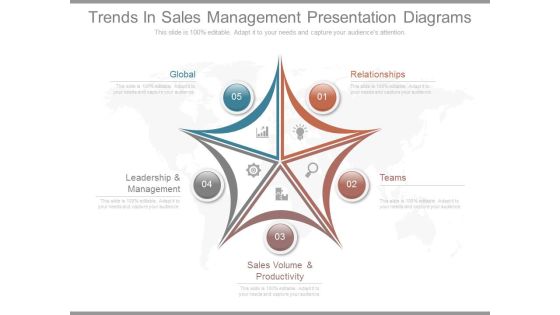
Trends In Sales Management Presentation Diagrams
This is a trends in sales management presentation diagrams. This is a five stage process. The stages in this process are global, leadership and management, sales volume and productivity, relationships, teams.
Sales Kpis With Lead Status By Owner Ppt PowerPoint Presentation Icon Shapes PDF
Presenting this set of slides with name sales kpis with lead status by owner ppt powerpoint presentation icon shapes pdf. The topics discussed in these slides are top campaigns, expected revenue by marketing channel, new leads this month, reasons for unqualified leads, lead status by owner. This is a completely editable PowerPoint presentation and is available for immediate download. Download now and impress your audience.
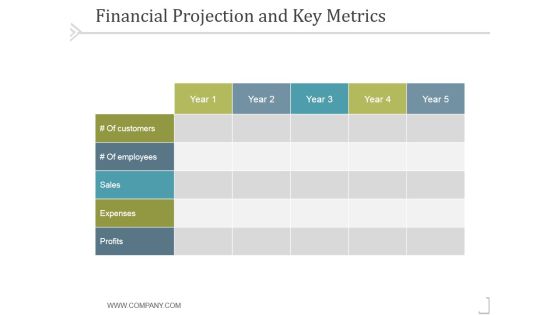
Financial Projection And Key Metrics Ppt PowerPoint Presentation Images
This is a financial projection and key metrics ppt powerpoint presentation images. This is a five stage process. The stages in this process are business, strategy, marketing, success, analysis, table.

Identify Right Customer Segments Example Ppt Slides Download
This is a identify right customer segments example ppt slides download. This is a five stage process. The stages in this process are other solutions, sales forecasting, churn modeling, customer analysis, measure data.

Quantitative Sales Data Analysis To Examine Ordered Shipments And Revenue Information PDF
This slide showcases the sales pattern analysis to track progress towards companys sales goals. It includes sales and orders shipped in different periods and the revenue generated over time. Showcasing this set of slides titled Quantitative Sales Data Analysis To Examine Ordered Shipments And Revenue Information PDF. The topics addressed in these templates are Sales And Orders, Month, Vessel Delays. All the content presented in this PPT design is completely editable. Download it and make adjustments in color, background, font etc. as per your unique business setting.
Stages To Prevent Revenue Loss Ppt PowerPoint Presentation Icon File Formats PDF
Persuade your audience using this stages to prevent revenue loss ppt powerpoint presentation icon file formats pdf. This PPT design covers one stages, thus making it a great tool to use. It also caters to a variety of topics including encourage higher product registration rate, revaluate how to capture customer data, conduct ongoing installed based data analysis, deliver actionable business intelligence, address low cost contract renewals with automation. Download this PPT design now to present a convincing pitch that not only emphasizes the topic but also showcases your presentation skills.

Data Quality Kpis Metrics Scorecard For Core Business Processes Topics PDF
This slide covers score for data obtained from core business activities and process. It includes quality metrics such as accuracy, completeness, consistency, integrity, timeliness, uniqueness and validity for data from business partners, finance, material management, sales, etc. Showcasing this set of slides titled Data Quality Kpis Metrics Scorecard For Core Business Processes Topics PDF. The topics addressed in these templates are Data Quality, Errors, Reports. All the content presented in this PPT design is completely editable. Download it and make adjustments in color, background, font etc. as per your unique business setting.

Defining Key Metrics To Analyse Current Sales Performance Background PDF
The following slide showcases some metrics to evaluate existing sales performance due to execute effective risk management strategies. It includes elements such as opportunities, win rate, average time to win, average value per win, sales velocity etc. Want to ace your presentation in front of a live audience Our Defining Key Metrics To Analyse Current Sales Performance Background PDF can help you do that by engaging all the users towards you. Slidegeeks experts have put their efforts and expertise into creating these impeccable powerpoint presentations so that you can communicate your ideas clearly. Moreover, all the templates are customizable, and easy to edit and downloadable. Use these for both personal and commercial use.

Last 90 Days Results Ppt PowerPoint Presentation Introduction
This is a last 90 days results ppt powerpoint presentation introduction. This is a six stage process. The stages in this process are revenue, new customers, gross profit, sales comparison.
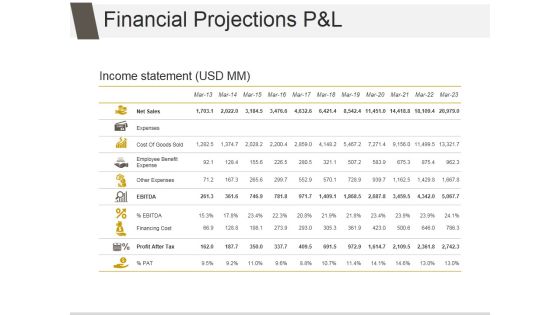
Financial Projections P And L Ppt PowerPoint Presentation Design Ideas
This is a financial projections p and l ppt powerpoint presentation design ideas. This is a eleven stage process. The stages in this process are net sales, expenses, cost of goods sold, employee benefit expense, other expenses, financing cost.
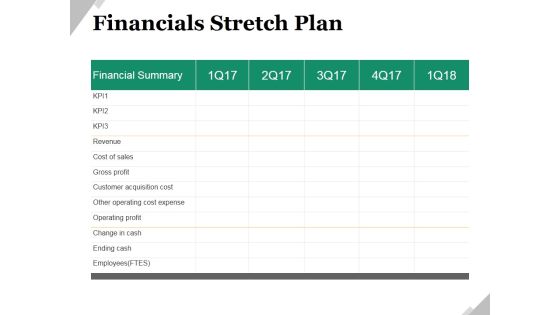
Financials Stretch Plan Ppt PowerPoint Presentation Ideas Shapes
This is a financials stretch plan ppt powerpoint presentation ideas shapes. This is a five stage process. The stages in this process are revenue, cost of sales, gross profit, customer acquisition cost, other operating cost expense, operating profit.

Financials Base Plan Template 2 Ppt PowerPoint Presentation Outline Backgrounds
This is a financials base plan template 2 ppt powerpoint presentation outline backgrounds. This is a three stage process. The stages in this process are cost of sales, gross profit, customer acquisition cost, other operating cost expense, operating profit.
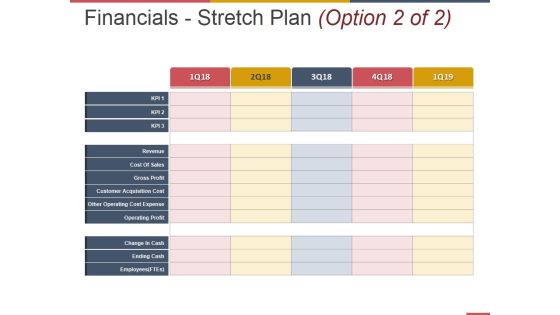
Financials Stretch Plan Template 1 Ppt PowerPoint Presentation Pictures Professional
This is a financials stretch plan template 1 ppt powerpoint presentation pictures professional. This is a three stage process. The stages in this process are cost of sales, gross profit, customer acquisition cost, other operating cost expense, operating profit.
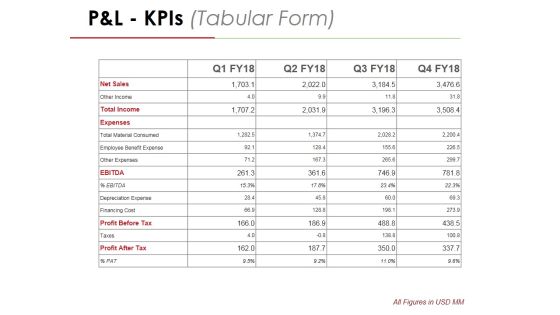
P And L Kpis Template 2 Ppt PowerPoint Presentation Professional Graphics
This is a p and l kpis template 2 ppt powerpoint presentation professional graphics. This is a four stage process. The stages in this process are net sales, other income, total income, expenses, total material consumed.

P And L Kpis Tabular Form Ppt PowerPoint Presentation Outline Aids
This is a p and l kpis tabular form ppt powerpoint presentation outline aids. This is a four stage process. The stages in this process are net sales, other income, total income, expenses, taxes.

Predictive Analytics Methods Overview Of Predictive Analytics Framework Introduction PDF
This slide outlines the overview of the predictive analytics framework and its components, including wide area network, openflow, forecasting, software-defined networking controller, predictive models, elastic cluster, data acquisition and application servers. Slidegeeks is here to make your presentations a breeze with Predictive Analytics Methods Overview Of Predictive Analytics Framework Introduction PDF With our easy to use and customizable templates, you can focus on delivering your ideas rather than worrying about formatting. With a variety of designs to choose from, you are sure to find one that suits your needs. And with animations and unique photos, illustrations, and fonts, you can make your presentation pop. So whether you are giving a sales pitch or presenting to the board, make sure to check out Slidegeeks first.

Defining Key Metrics To Analyse Current Sales Performance Rules PDF
The following slide showcases some metrics to evaluate existing sales performance due to execute effective risk management strategies. It includes elements such as opportunities, win rate, average time to win, average value per win, sales velocity etc. Do you know about Slidesgeeks Defining Key Metrics To Analyse Current Sales Performance Rules PDF These are perfect for delivering any kind od presentation. Using it, create PowerPoint presentations that communicate your ideas and engage audiences. Save time and effort by using our pre designed presentation templates that are perfect for a wide range of topic. Our vast selection of designs covers a range of styles, from creative to business, and are all highly customizable and easy to edit. Download as a PowerPoint template or use them as Google Slides themes.

Defining Key Metrics To Analyse Current Sales Performance Summary PDF
The following slide showcases some metrics to evaluate existing sales performance due to execute effective risk management strategies. It includes elements such as opportunities, win rate, average time to win, average value per win, sales velocity etc. Do you know about Slidesgeeks Defining Key Metrics To Analyse Current Sales Performance Summary PDF These are perfect for delivering any kind od presentation. Using it, create PowerPoint presentations that communicate your ideas and engage audiences. Save time and effort by using our pre designed presentation templates that are perfect for a wide range of topic. Our vast selection of designs covers a range of styles, from creative to business, and are all highly customizable and easy to edit. Download as a PowerPoint template or use them as Google Slides themes.

Decision Support System Data Warehouse Is Integrated Ppt Influencers PDF
This slide depicts the integrated feature of the data warehouse and how different subjects are stored within one place in the data warehouse. Presenting Decision Support System Data Warehouse Is Integrated Ppt Influencers PDF to provide visual cues and insights. Share and navigate important information on three stages that need your due attention. This template can be used to pitch topics like Sales Account, Purchase Account, Raw Material Account. In addtion, this PPT design contains high resolution images, graphics, etc, that are easily editable and available for immediate download.

Key Metrics In Software Sales Strategy Pictures PDF
This slide presents key metrics to be tracked in software sales plan, that helps organisations to keep track of growth and profits generated over time. It includes monthly recurring revenue, average revenue per user, customer lifetime value and lead velocity rate Presenting Key Metrics In Software Sales Strategy Pictures PDF to dispense important information. This template comprises four stages. It also presents valuable insights into the topics including Monthly Recurring Revenue, Customer Lifetime Value, Lead Velocity Rate. This is a completely customizable PowerPoint theme that can be put to use immediately. So, download it and address the topic impactfully.

Cognitive Analytics Strategy And Techniques Addressing Cognitive Analytics Architecture Information PDF
This slide provides information regarding cognitive analytics architecture representing different layers such as physical data layer, physical hardware layer, hardware abstraction layer, low level data services layer. Make sure to capture your audiences attention in your business displays with our gratis customizable Cognitive Analytics Strategy And Techniques Addressing Cognitive Analytics Architecture Information PDF. These are great for business strategies, office conferences, capital raising or task suggestions. If you desire to acquire more customers for your tech business and ensure they stay satisfied, create your own sales presentation with these plain slides.

Key Metrics For Customer Behavior Analytics Ppt Model Introduction PDF
The following slide showcases key indicators of ecommerce firm and impact of consumer behavior in the previous and current year. Main KPIs covered are customer acquisition, lead conversion, churn, bounce and click through rate. Showcasing this set of slides titled Key Metrics For Customer Behavior Analytics Ppt Model Introduction PDF. The topics addressed in these templates are Particulars, Previous Year, Current Year. All the content presented in this PPT design is completely editable. Download it and make adjustments in color, background, font etc. as per your unique business setting.
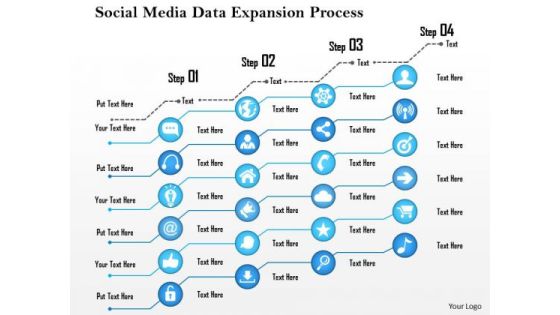
Business Framework Social Media Data Expansion Process PowerPoint Presentation
Four staged data process diagram has been used to decorate this power point template slide. This PPT slide contains the concept of social media data expansion. Display this data expansion in your presentations with this unique PPT slide.

Computer Data Analytics Applications And Opportunities Demonstration PDF
The below slide presents major big data applications in various sectors and industries to improve efficiency and productivity. It covers sectors such as marketing, manufacturing, logistics, research, and finance. Presenting Computer Data Analytics Applications And Opportunities Demonstration PDF to dispense important information. This template comprises five stages. It also presents valuable insights into the topics including Sales And Marketing, Manufacturing, Financial Risk Monitoring . This is a completely customizable PowerPoint theme that can be put to use immediately. So, download it and address the topic impactfully.

Post Implementation Other Operation And Financial Kpis Summary PDF
The slide provides five years graphs 2022F to 2026F forecasted number of major KPIs key performance indicators, that might help to track the performance of ABC Railway. Covered KPIs include Revenue, Total Passengers, operating income, customer satisfaction rate etc.Deliver and pitch your topic in the best possible manner with this post implementation other operation and financial KPIs summary pdf. Use them to share invaluable insights on total passengers, operating income, revenue, 2022 to 2026 and impress your audience. This template can be altered and modified as per your expectations. So, grab it now.

Post Implementation Other Operation And Financial Kpis Inspiration PDF
The slide provides five years graphs 2022F-2026F forecasted number of major KPIs key performance indicators, that might help to track the performance of ABC Railway. Covered KPIs include Revenue, Total Passengers, operating income, customer satisfaction rate etc. Deliver and pitch your topic in the best possible manner with this post implementation other operation and financial kpis inspiration pdf. Use them to share invaluable insights on revenue, operating income, customer satisfaction and impress your audience. This template can be altered and modified as per your expectations. So, grab it now.

Service Promotion Plan Kpis To Monitor Quarterly Marketing Performance Diagrams PDF
This slide shows various metrics which can be used by marketing manager to track performance. These key performance indicators are customer acquisition cost, sales growth, new leads, website traffic, etc. Make sure to capture your audiences attention in your business displays with our gratis customizable Service Promotion Plan Kpis To Monitor Quarterly Marketing Performance Diagrams PDF. These are great for business strategies, office conferences, capital raising or task suggestions. If you desire to acquire more customers for your tech business and ensure they stay satisfied, create your own sales presentation with these plain slides.

Ecommerce Platform Increasing Sales Trends Graphics PDF
Persuade your audience using this ecommerce platform increasing sales trends graphics pdf. This PPT design covers one stages, thus making it a great tool to use. It also caters to a variety of topics including ecommerce platform increasing sales trends. Download this PPT design now to present a convincing pitch that not only emphasizes the topic but also showcases your presentation skills.
Key Questions For Customer Data Analysis Icons PDF
This slide list the win loss questions that must be asked for improving organizations messaging, positioning, packaging, pricing, and sales practices. Persuade your audience using this key questions for customer data analysis icons pdf. This PPT design covers five stages, thus making it a great tool to use. It also caters to a variety of topics including sales, practices, messaging, positioning. Download this PPT design now to present a convincing pitch that not only emphasizes the topic but also showcases your presentation skills.

Key Consumer Service Strategy Metrics To Determine Success Portrait PDF
This slide covers information regarding key metrics that are required to determine CRM program success in terms of customer churn, net promoter score, rate of renewal, etc. This is a Key Consumer Service Strategy Metrics To Determine Success Portrait PDF template with various stages. Focus and dispense information on nine stages using this creative set, that comes with editable features. It contains large content boxes to add your information on topics like Net Promoter Score, Customer Churn, Customer Effort Score. You can also showcase facts, figures, and other relevant content using this PPT layout. Grab it now.

Key Metrics For Client Engagement Loyalty Program Microsoft PDF
This slide shows key metrics to measure customer loyalty program . It includes factors such as retention rate, negative churn, promoter score, and effort score. Persuade your audience using this Key Metrics For Client Engagement Loyalty Program Microsoft PDF. This PPT design covers four stages, thus making it a great tool to use. It also caters to a variety of topics including Retention Rate, Negative Churn, Promoter Score, Effort Score. Download this PPT design now to present a convincing pitch that not only emphasizes the topic but also showcases your presentation skills.

Decision Support System Data Warehouse Is Subject Oriented Ppt Inspiration Objects PDF
This slide represents the subject-oriented feature of data warehouse and various operational applications and data warehouse subjects sales, product, customer, and so on. Presenting Decision Support System Data Warehouse Is Subject Oriented Ppt Inspiration Objects PDF to provide visual cues and insights. Share and navigate important information on one stages that need your due attention. This template can be used to pitch topics like Operational Applications, Data Warehouse Subjects, Order Processing. In addtion, this PPT design contains high resolution images, graphics, etc, that are easily editable and available for immediate download.

Develop Strategic Kpis Powerpoint Slide Templates
This is a develop strategic kpis powerpoint slide templates. This is a four stage process. The stages in this process are visitors, leads, marketing qualified leads, sales qualified leads, buyer s journey, sales and marketing process, kpis, awareness, consideration, decision.

Data Processing Services Delivery The Next Generation Operating Model After Implementing Ai Pictures PDF
This slide represents the next generation operating model after implementing AI in the organization and how it would increase the productivity and profit. This is a Data Processing Services Delivery The Next Generation Operating Model After Implementing Ai Pictures PDF template with various stages. Focus and dispense information on three stages using this creative set, that comes with editable features. It contains large content boxes to add your information on topics like Organization, Sales Reports, Cyber Security. You can also showcase facts, figures, and other relevant content using this PPT layout. Grab it now.

Data Valuation And Monetization Determine Data To Analyze Product Sales Performance Elements PDF
Firm will keep the track of the top worst selling products with the help of consumer data collected. It will increase the production that are in high demand subsequently lower the production of worse selling products in order to leverage its strength. Deliver and pitch your topic in the best possible manner with this Data Valuation And Monetization Determine Data To Analyze Product Sales Performance Elements PDF. Use them to share invaluable insights on Sales Reports, Consumer Data, Data Sourced and impress your audience. This template can be altered and modified as per your expectations. So, grab it now.

Datafy Measures To Maintain Data Security In Datafication Diagrams PDF
This slide talks about the measures to keep data secure in datafication, including legal requirements, technical measures and business practices, containing marketing campaigns, sales operations and customer service. The technical measures include encryption, firewalls, and access controls. Welcome to our selection of the Datafy Measures To Maintain Data Security In Datafication Diagrams PDF. These are designed to help you showcase your creativity and bring your sphere to life. Planning and Innovation are essential for any business that is just starting out. This collection contains the designs that you need for your everyday presentations. All of our PowerPoints are 100 percent editable, so you can customize them to suit your needs. This multi-purpose template can be used in various situations. Grab these presentation templates today.

 Home
Home