Thank You
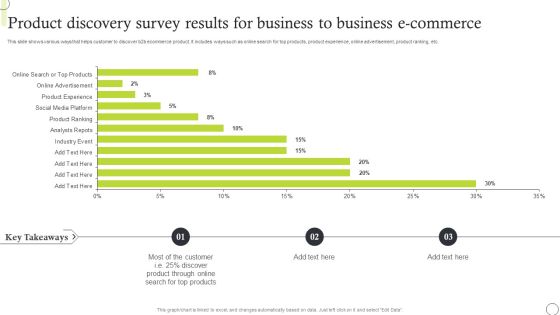
Product Discovery Survey Results For Business To Business E Commerce Elements PDF
Showcasing this set of slides titled Product Discovery Survey Results For Business To Business E Commerce Elements PDF. The topics addressed in these templates are Product Discovery Survey, Results For Business, To Business E-Commerce. All the content presented in this PPT design is completely editable. Download it and make adjustments in color, background, font etc. as per your unique business setting.

Results And Outputs Of 12 Week Innovation Sprint In Safe Slides PDF
Showcasing this set of slides titled Results And Outputs Of 12 Week Innovation Sprint In Safe Slides PDF. The topics addressed in these templates are Time Rich Team, Time Strapped Team, Results And Outputs. All the content presented in this PPT design is completely editable. Download it and make adjustments in color, background, font etc. as per your unique business setting.

Essential Drivers To Maximize Business Result Icon Ppt Inspiration Slide Download PDF
Showcasing this set of slides titled Essential Drivers To Maximize Business Result Icon Ppt Inspiration Slide Download PDF. The topics addressed in these templates are Essential, Drivers To Maximize, Business Result, Icon. All the content presented in this PPT design is completely editable. Download it and make adjustments in color, background, font etc. as per your unique business setting.

Key Accomplishments Of Artificial Intelligence To Increase Efficiency Brochure PDF
This slide highlights latest AI integrated achievements which helps to enhance customer experience and improve service. It provides information regarding face recognition, speech recognition, tumor diagnosing and cancer detection. Presenting Key Accomplishments Of Artificial Intelligence To Increase Efficiency Brochure PDF to dispense important information. This template comprises four stages. It also presents valuable insights into the topics including Face Recognition, Speech Recognition, Tumor Diagnosing. This is a completely customizable PowerPoint theme that can be put to use immediately. So, download it and address the topic impactfully.

Model For Project Delivery To Achieve Operational Excellence Ideas PDF
This slide showcases project delivery excellence framework which helps in process optimization. It provides information regarding stages such as initiation, planning, execution, closing and control. Showcasing this set of slides titled Model For Project Delivery To Achieve Operational Excellence Ideas PDF. The topics addressed in these templates are Planning, Executing, Initiating. All the content presented in this PPT design is completely editable. Download it and make adjustments in color, background, font etc. as per your unique business setting.

Gerber Yellow Flower Beauty PowerPoint Themes And PowerPoint Slides 0311
Microsoft PowerPoint Theme and Slide with close up of a beautiful gerbera flower

Red And Yellow Flower Beauty PowerPoint Themes And Slides 0311
Microsoft PowerPoint Theme and Slide with this is close-up photo from orange flower

Map With Compass Geographical PowerPoint Presentation Slides C
Microsoft PowerPoint Slides and Backgrounds with close up view of the compass on old paper
Map With Compass Geographical PowerPoint Presentation Slides Cc
Microsoft PowerPoint Slides and Backgrounds with close up view of the compass on old paper
Map With Compass Geographical PowerPoint Presentation Slides F
Microsoft PowerPoint Slides and Backgrounds with close up view of the compass on old paper
Map With Compass Geographical PowerPoint Presentation Slides R
Microsoft PowerPoint Slides and Backgrounds with close up view of the compass on old paper
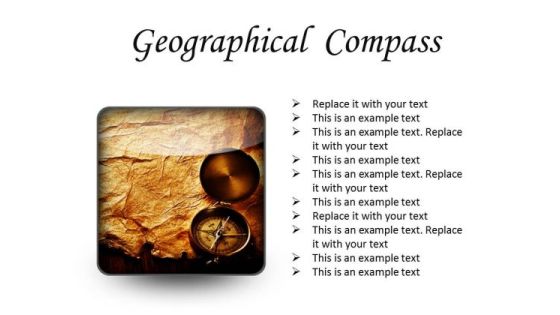
Map With Compass Geographical PowerPoint Presentation Slides S
Microsoft PowerPoint Slides and Backgrounds with close up view of the compass on old paper
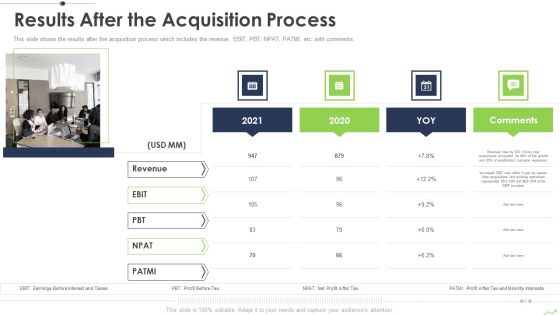
Paths To Inorganic Expansion Results After The Acquisition Process Ppt Summary Background Image PDF
This slide shows the results after the acquisition process which includes the revenue, EBIT, PBT, NPAT, PATMI, etc. with comments. Presenting paths to inorganic expansion results after the acquisition process ppt summary background image pdf to provide visual cues and insights. Share and navigate important information on one stages that need your due attention. This template can be used to pitch topics like results after the acquisition process. In addtion, this PPT design contains high resolution images, graphics, etc, that are easily editable and available for immediate download.

Data Analytics IT Phases Of Data Science Communicate Results Ppt Gallery Slideshow PDF
This slide defines the last phase of the data science, which is communicated results, and, in this phase, all the key findings are communicated to stakeholders to know if the project is a success or not. Presenting data analytics it phases of data science communicate results ppt gallery slideshow pdf to provide visual cues and insights. Share and navigate important information on three stages that need your due attention. This template can be used to pitch topics like phases of data science communicate results. In addtion, this PPT design contains high resolution images, graphics, etc, that are easily editable and available for immediate download.
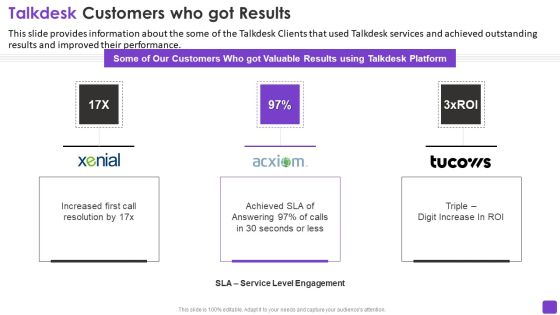
Talkdesk Investor Financing Business Talkdesk Customers Who Got Results Slides PDF
This slide provides information about the some of the Talkdesk Clients that used Talkdesk services and achieved outstanding results and improved their performance. Presenting talkdesk investor financing business talkdesk customers who got results slides pdf to provide visual cues and insights. Share and navigate important information on three stages that need your due attention. This template can be used to pitch topics like talkdesk customers who got results. In addtion, this PPT design contains high resolution images, graphics, etc, that are easily editable and available for immediate download.

Manufacturing Operation Quality Improvement Practices Tools Templates Objectives And Key Results Of Manufacturing Information PDF
Purpose of the following slide is to show the objectives and key results that are expected to gain from the process of managing the manufacturing process. Presenting manufacturing operation quality improvement practices tools templates objectives and key results of manufacturing information pdf to provide visual cues and insights. Share and navigate important information on five stages that need your due attention. This template can be used to pitch topics like executive objectives, business strategies, project objectives, scope, results. In addtion, this PPT design contains high resolution images, graphics, etc, that are easily editable and available for immediate download.
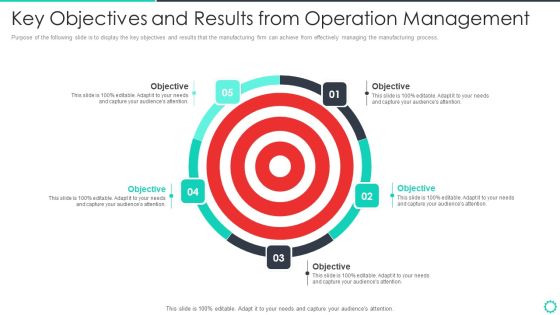
Manufacturing Operation Quality Improvement Practices Tools Templates Key Objectives And Results Pictures PDF
Purpose of the following slide is to display the key objectives and results that the manufacturing firm can achieve from effectively managing the manufacturing process. Presenting manufacturing operation quality improvement practices tools templates key objectives and results pictures pdf to provide visual cues and insights. Share and navigate important information on five stages that need your due attention. This template can be used to pitch topics like key objectives and results from operation management. In addtion, this PPT design contains high resolution images, graphics, etc, that are easily editable and available for immediate download.

Assessing Startup Company Value Startup Valuation Results With Value Per Share Details Information PDF
This slides shows the startup valuation results with value per share details such as NPV of explicit value, enterprise value, equity value, value per share, etc. Presenting assessing startup company value startup valuation results with value per share details information pdf to provide visual cues and insights. Share and navigate important information on two stages that need your due attention. This template can be used to pitch topics like startup valuation results with value per share details. In addtion, this PPT design contains high resolution images, graphics, etc, that are easily editable and available for immediate download.
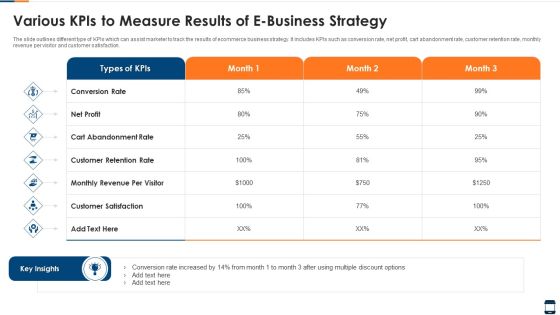
Various Kpis To Measure Results Of E Business Strategy Elements PDF
The slide outlines different type of KPIs which can assist marketer to track the results of ecommerce business strategy. It includes KPIs such as conversion rate, net profit, cart abandonment rate, customer retention rate, monthly revenue per visitor and customer satisfaction. Pitch your topic with ease and precision using this various kpis to measure results of e business strategy elements pdf. This layout presents information on various kpis to measure results of e business strategy. It is also available for immediate download and adjustment. So, changes can be made in the color, design, graphics or any other component to create a unique layout.
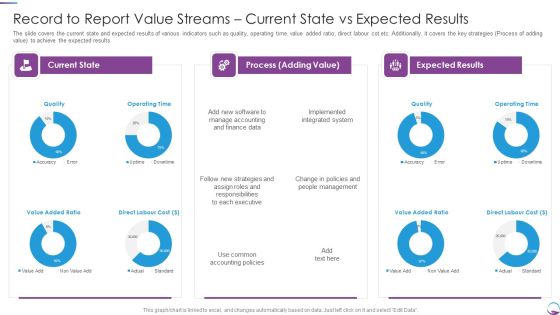
Record To Report Value Streams Current State Vs Expected Results Professional PDF
The slide covers the current state and expected results of various indicators such as quality, operating time, value added ratio, direct labour cot etc. Additionally, it covers the key strategies Process of adding value to achieve the expected results. Deliver and pitch your topic in the best possible manner with this Record To Report Value Streams Current State Vs Expected Results Professional PDF. Use them to share invaluable insights on Management, Strategies, Executive, Finance Data and impress your audience. This template can be altered and modified as per your expectations. So, grab it now.
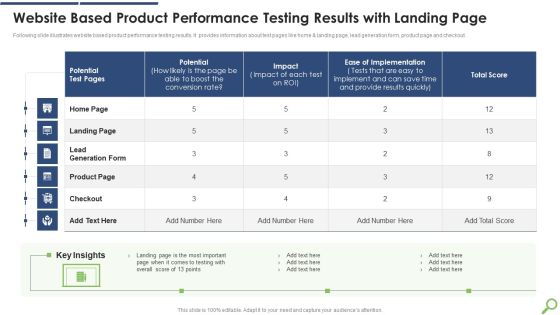
Website Based Product Performance Testing Results With Landing Page Mockup PDF
Following slide illustrates website based product performance testing results. It provides information about test pages like home and landing page, lead generation form, product page and checkout. Pitch your topic with ease and precision using this Website Based Product Performance Testing Results With Landing Page Mockup PDF This layout presents information on Provide Results, Potential Test, Ease Of Implementation It is also available for immediate download and adjustment. So, changes can be made in the color, design, graphics or any other component to create a unique layout.

Business Performance Review Report Highlighting Results Of Marketing Campaign Icons PDF
The following slide highlights a quarterly business review QBR report which can be used by the manager to review marketing campaign results. The QBR report covers information about strategic objectives, KPIs, target and result in various quarters. Pitch your topic with ease and precision using this Business Performance Review Report Highlighting Results Of Marketing Campaign Icons PDF. This layout presents information on Strategic Objectives, Engage Community, Increase Revenue. It is also available for immediate download and adjustment. So, changes can be made in the color, design, graphics or any other component to create a unique layout.

Consumer Journey Mapping Techniques Customer Support Team Performance Audit And Review Results Professional PDF
This slide covers the customer care department audit results. It includes performance evaluation criteria such as agent name, accepted call legs, declined legs, missed, outbound calls, leg talk time, avg leg talk time, live chat issues resolved, video calls, etc. Showcasing this set of slides titled Consumer Journey Mapping Techniques Customer Support Team Performance Audit And Review Results Professional PDF. The topics addressed in these templates are Audit And Review Results, Team Performance, Customer Support. All the content presented in this PPT design is completely editable. Download it and make adjustments in color, background, font etc. as per your unique business setting.

Consumer Journey Mapping Techniques Referral Program Audit And Review Results Sample PDF
This slide covers the referral campaign results tracking sheet. It includes various details such as referral code, name, email, phone, referrals owed, count, rewards earned, promoter rewards redemption, rewards redeemed, etc. Pitch your topic with ease and precision using this Consumer Journey Mapping Techniques Referral Program Audit And Review Results Sample PDF. This layout presents information on Referral Program, Audit And Review Results. It is also available for immediate download and adjustment. So, changes can be made in the color, design, graphics or any other component to create a unique layout.

Onboarding Journey For Effective Client Communication Customer Onboarding Journey Survey Results Infographics PDF
This exhibits the survey results for client onboarding journey. Major results covered are customers change brands if purchase procedure is difficult, customers prefer personalization, highly engaged users make more purchases, etc. Take your projects to the next level with our ultimate collection of Onboarding Journey For Effective Client Communication Customer Onboarding Journey Survey Results Infographics PDF. Slidegeeks has designed a range of layouts that are perfect for representing task or activity duration, keeping track of all your deadlines at a glance. Tailor these designs to your exact needs and give them a truly corporate look with your own brand colors they will make your projects stand out from the rest.

One Page Summary For Business To Business Marketing Analysis Survey Results Survey SS
The purpose of this slide is to summarize the results of a market research survey of potential businesses to take better business decisions. Results provided are related to business, product quality, and performance of technical support representative. Pitch your topic with ease and precision using this One Page Summary For Business To Business Marketing Analysis Survey Results Survey SS. This layout presents information on Business Related, Product Quality, Performance Of Technical, Quality Standards. It is also available for immediate download and adjustment. So, changes can be made in the color, design, graphics or any other component to create a unique layout.

Tactical Employee Engagement Action Planning Analysing Employee Engagement Survey Questionnaire Summary PDF
The following slide depicts the key results of employee engagement survey to evaluate staff connection with their organization. It includes elements such as employees are motivated to meet their targets, healthy relations with colleagues, appreciates work culture etc. Crafting an eye catching presentation has never been more straightforward. Let your presentation shine with this tasteful yet straightforward Tactical Employee Engagement Action Planning Analysing Employee Engagement Survey Questionnaire Summary PDF template. It offers a minimalistic and classy look that is great for making a statement. The colors have been employed intelligently to add a bit of playfulness while still remaining professional. Construct the ideal Tactical Employee Engagement Action Planning Analysing Employee Engagement Survey Questionnaire Summary PDF that effortlessly grabs the attention of your audience Begin now and be certain to wow your customers
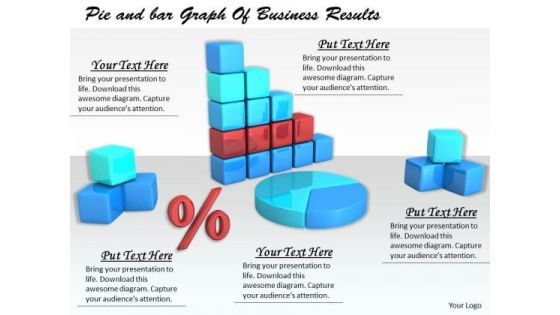
Stock Photo Business Strategy Examples Pie And Bar Graph Of Results Images
Plan For All Contingencies With Our Stock Photo Business Strategy Examples Pie And Bar Graph Of Results Images Powerpoint Templates. Douse The Fire Before It Catches. Generate Camaraderie With Our sales Powerpoint Templates. Good Wishes Will Come Raining Down.
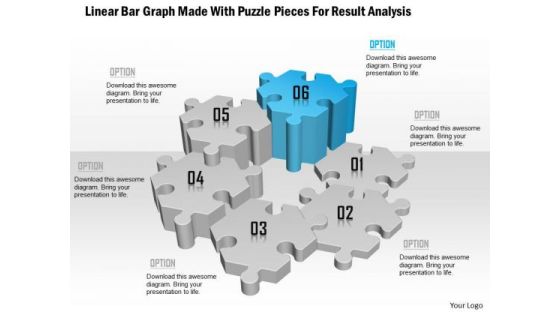
Linear Bar Graph Made With Puzzle Pieces For Result Analysis Presentation Template
This Power Point template has been used to show concept of result analysis. This PPT contains the graphic of linear bar graph made with puzzle. Use this PPT for business and sales presentations.

Business Diagram Six Pie Charts For Result Representation And Percentage Presentation Template
Display the concept of result analysis in your business presentation. This PPT slide contains the graphic of six pie charts. Use this PPT slide for your business and marketing data related presentations.

Stock Photo Computer And Bar Graph For Result Analysis PowerPoint Slide
This Power point template has been crafted with graphic of computer and bar graph. This PPT contains the concept of technology and result analysis. Use this PPT for your business and technology related presentations.

Business Diagram Three Different Pie Charts For Result Analysis Presentation Template
Three different pie charts are used to designed this power point template slide. This PPT slide contains the concept of result analysis. Use this PPT slide for your data and process related presentations.
Four Triangles With Globe Team Result Analysis Report Icons Powerpoint Templates
This good quality business PPT helps in clearly conveying your message to clients and audience. It contains graphics of four triangles. Download this diagram to depict global team planning and result analysis. Present your views using our innovative slide

5 Stage Input Funnel For Results Ppt PowerPoint Presentation Background Designs
This is a 5 stage input funnel for results ppt powerpoint presentation background designs. This is a five stage process. The stages in this process are adapt it to your needs and capture your audiences attention.

Analysing Result Of Brainstorming Session Affinity Diagrams Ppt PowerPoint Presentation Sample
This is a analysing result of brainstorming session affinity diagrams ppt powerpoint presentation sample. This is a three stage process. The stages in this process are icons, analysis, success, strategy, marketing, management.

Analysing Result Of Brainstorming Session Attribute Listing Technique Ppt PowerPoint Presentation Themes
This is a analysing result of brainstorming session attribute listing technique ppt powerpoint presentation themes. This is a four stage process. The stages in this process are voting criteria, idea, business, marketing, strategy.

Analysing Result Of Brainstorming Session Swot Analysis Ppt PowerPoint Presentation Layout
This is a analysing result of brainstorming session swot analysis ppt powerpoint presentation layout. This is a four stage process. The stages in this process are strengths, threats, opportunities, weaknesses.

Analysing Results Of Brainstorming Session Moscow Analysis Ppt PowerPoint Presentation Design Ideas
This is a analysing results of brainstorming session moscow analysis ppt powerpoint presentation design ideas. This is a four stage process. The stages in this process are analysis for skill of business analyst, should, must, could.

Analysing Results Of Brainstorming Session Swot Analysis Ppt PowerPoint Presentation Shapes
This is a analysing results of brainstorming session swot analysis ppt powerpoint presentation shapes. This is a four stage process. The stages in this process are strengths, threats, opportunities, weaknesses.

Analysing Results Of Brainstorming Session Weighted Scoring Model Ppt PowerPoint Presentation Graphics
This is a analysing results of brainstorming session weighted scoring model ppt powerpoint presentation graphics. This is a three stage process. The stages in this process are implications, merits, demerits, probable, score.

Analysing Results Of Brainstorming Session Affinity Diagrams Ppt PowerPoint Presentation Show
This is a analysing results of brainstorming session affinity diagrams ppt powerpoint presentation show. This is a three stage process. The stages in this process are business, marketing, success, management, process.

Analysing Results Of Brainstorming Session Attribute Listing Technique Ppt PowerPoint Presentation Influencers
This is a analysing results of brainstorming session attribute listing technique ppt powerpoint presentation influencers. This is a four stage process. The stages in this process are voting, criteria, idea.
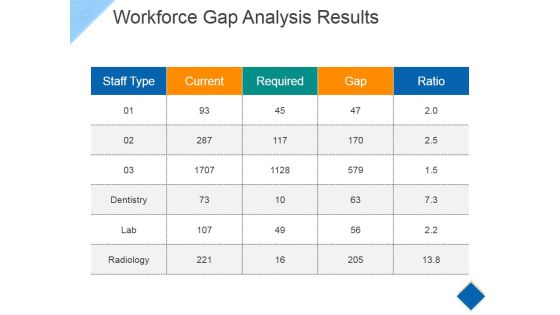
Workforce Gap Analysis Results Ppt PowerPoint Presentation Infographic Template Graphics Tutorials
This is a workforce gap analysis results ppt powerpoint presentation infographic template graphics tutorials. This is a five stage process. The stages in this process are staff type, current, required, gap, ratio.

Analysing Results Of Brainstorming Session Affinity Diagrams Ppt PowerPoint Presentation Ideas Mockup
This is a analysing results of brainstorming session affinity diagrams ppt powerpoint presentation ideas mockup. This is a three stage process. The stages in this process are business, marketing, management, table, theme.

Analysing Results Of Brainstorming Session Attribute Listing Technique Ppt PowerPoint Presentation Gallery Format
This is a analysing results of brainstorming session attribute listing technique ppt powerpoint presentation gallery format. This is a three stage process. The stages in this process are idea, total number of votes, voting criteria, table, compare.

Analysing Results Of Brainstorming Session Moscow Analysis Ppt PowerPoint Presentation Show Slide Download
This is a analysing results of brainstorming session moscow analysis ppt powerpoint presentation show slide download. This is a four stage process. The stages in this process are must, should, could, wont.

Analysing Results Of Brainstorming Session Swot Analysis Ppt PowerPoint Presentation Infographics Slideshow
This is a analysing results of brainstorming session swot analysis ppt powerpoint presentation infographics slideshow. This is a four stage process. The stages in this process are strengths, weaknesses, opportunities, threats.

Analysis Results Of Brainstorming Session Weighted Scoring Model Ppt PowerPoint Presentation File Maker
This is a analysis results of brainstorming session weighted scoring model ppt powerpoint presentation file maker. This is a three stage process. The stages in this process are ideas, merits, demerits, implications, probable.
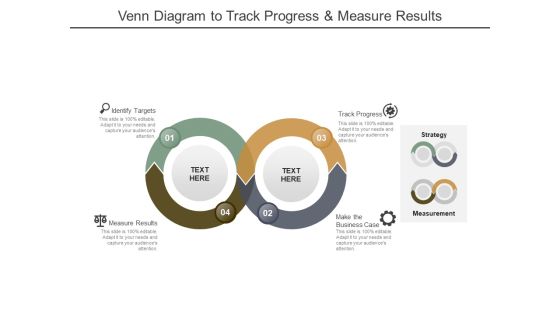
Venn Diagram To Track Progress And Measure Results Ppt PowerPoint Presentation Inspiration Slides
This is a venn diagram to track progress and measure results ppt powerpoint presentation inspiration slides. This is a four stage process. The stages in this process are hared value, shared merit, shared worth.

Business Process Improvement Establish Objectives Review Results Ppt PowerPoint Presentation Show Structure
This is a business process improvement establish objectives review results ppt powerpoint presentation show structure. This is a nine stage process. The stages in this process are diagram of kaizen, diagram of improvements, diagram of enhancement.

Business Process Improvement Identify Issues Check Results Ppt PowerPoint Presentation Pictures Slide Download
This is a business process improvement identify issues check results ppt powerpoint presentation pictures slide download. This is a four stage process. The stages in this process are diagram of kaizen, diagram of improvements, diagram of enhancement.

Action And Result Comparison With Icons Ppt PowerPoint Presentation Summary Slide Portrait
This is a action and result comparison with icons ppt powerpoint presentation summary slide portrait. This is a two stage process. The stages in this process are compare, comparison of two, competitive analysis.

Three Steps Of Result Delivery Ppt PowerPoint Presentation Styles Graphics Design
This is a three steps of result delivery ppt powerpoint presentation styles graphics design. This is a three stage process. The stages in this process are why what how, golden circle, wwh.
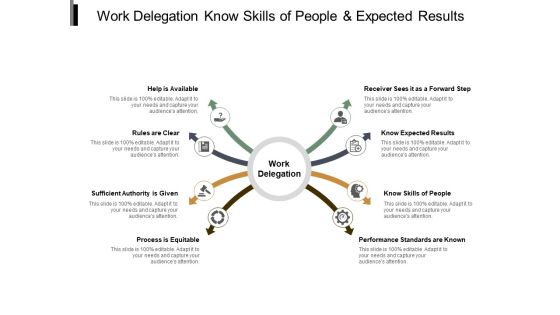
Work Delegation Know Skills Of People And Expected Results Ppt PowerPoint Presentation Styles Brochure
This is a work delegation know skills of people and expected results ppt powerpoint presentation styles brochure. This is a eight stage process. The stages in this process are delegation, deputation, delegacy.

Business Process Management Result Implementation Strategy Ppt PowerPoint Presentation Infographic Template Layout
This is a business process management result implementation strategy ppt powerpoint presentation infographic template layout. This is a three stage process. The stages in this process are business growth, people process product, 3ps.

Business Goals And Results With Icons Ppt PowerPoint Presentation Infographic Template Mockup
This is a business goals and results with icons ppt powerpoint presentation infographic template mockup. This is a five stage process. The stages in this process are objective and benefit, goal and benefit, plan and benefit.

Business Goals And Results With Seven Points Ppt PowerPoint Presentation Slides Show
This is a business goals and results with seven points ppt powerpoint presentation slides show. This is a seven stage process. The stages in this process are objective and benefit, goal and benefit, plan and benefit.

Business Goals And Results With Six Points Ppt PowerPoint Presentation Infographic Template Shapes
This is a business goals and results with six points ppt powerpoint presentation infographic template shapes. This is a six stage process. The stages in this process are objective and benefit, goal and benefit, plan and benefit.

Business Goals And Results With Three Points Ppt PowerPoint Presentation Layouts Grid
This is a business goals and results with three points ppt powerpoint presentation layouts grid. This is a three stage process. The stages in this process are objective and benefit, goal and benefit, plan and benefit.
Goals And Results Client Satisfaction And Financial Strength Ppt PowerPoint Presentation Icon Ideas
This is a goals and results client satisfaction and financial strength ppt powerpoint presentation icon ideas. This is a seven stage process. The stages in this process are objective and benefit, goal and benefit, plan and benefit.
 Home
Home