Success Metrics
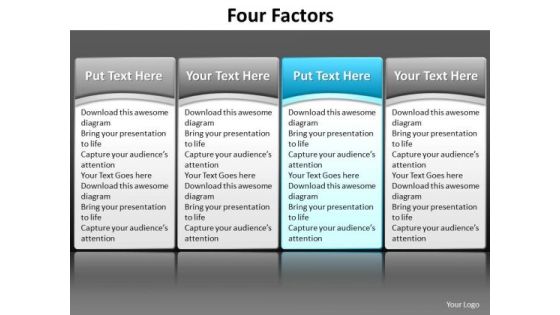
Ppt Red White And Blue PowerPoint Theme Table Listing Its Factors Components Templates
PPT red white and blue powerpoint theme table listing its factors components Templates-Use this Table diagram to show activities that are related to the business plan metrics and monitor the results to determine if the business plan is proceeding as planned. This Blue Table illustrates the concept of Tabular Method.-Can be used for presentations on advertise,amount, badge, banner, bill, blank, business, button, cart, checklist, column, costing, counting, currency, descriptive, design, discount, element, empty, gradient, grid, hosting, illustration, isolated, list, message, nobody, pricing, rectangle, red-PPT red white and blue powerpoint theme table listing its factors components Templates
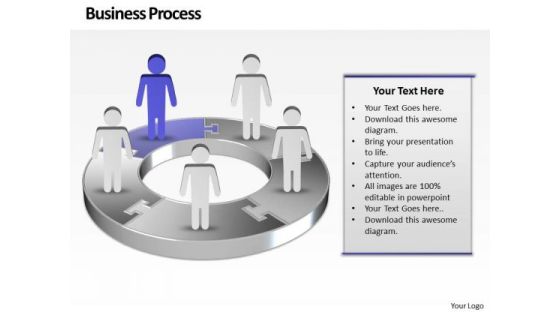
Ppt Purple Men Standing On Free Concept Pie PowerPoint Presentation Chart Templates
PPT purple men standing on free concept pie powerpoint presentation chart Templates-Use this Circular Arrow diagram to show activities that are related to the business plan metrics and monitor the results to determine if the business plan is proceeding as planned.-PPT purple men standing on free concept pie powerpoint presentation chart Templates-3d, arrow, background, blue, chart, circle, circular, clipart, colorful, connection, continuity, cycle, cyclic, diagram, direction, flow, graph, icon, illustration, isolated, loop, motion, process, progress, recycle, ring, round, step, sticker, symbol, teamwork, template, turn, vector
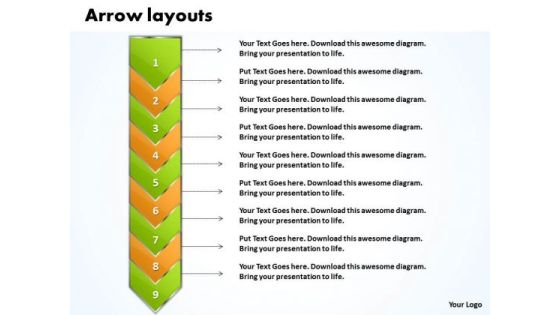
Ppt Go Green Layouts PowerPoint Free And Orange Arrow 9 Stages Templates
PPT go green layouts powerpoint free and orange arrow 9 stages Templates-Use this Curved Arrows diagram to show activities that are related to the business plan metrics and monitor the results to determine if the business plan is proceeding as planned. Our PPT images are so perfectly designed that it reveals the very basis of our PPT diagrams and are an effective tool to make your clients understand.-PPT go green layouts powerpoint free and orange arrow 9 stages Templates-Arrow, Background, Process, Business, Chart, Diagram, Financial, Graphic, Gray, Icon, Illustration, Management, Orange, Perspective, Process, Reflection, 9 Stages, Steps, Text, Transparency
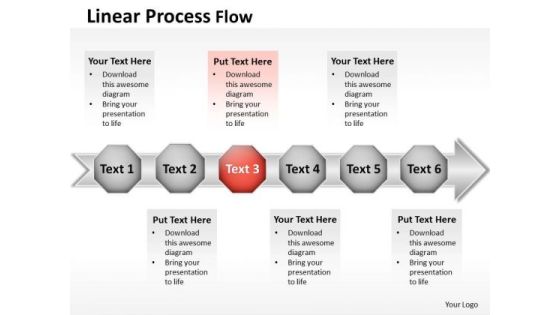
Ppt Horizontal Flow Actions In Diamond Mining Process PowerPoint Presentation Templates
PPT horizontal flow actions in diamond mining process powerpoint presentation Templates-Use this Circular diagram to show activities that are related to the business plan metrics and monitor the results to determine if the business plan is proceeding as planned. Deliver amazing presentations to mesmerize your audience using this Diagram.-PPT horizontal flow actions in diamond mining process powerpoint presentation Templates-3d, Advertisement, Advertising, Arrow, Border, Business, Circles, Collection, Customer, Design, Element, Icon, Idea, Illustration, Info, Information, Isolated, Label, Light, Location, Needle, New, Notification, Notify, Point, Pointer, Promotion, Role, Rounded

Six Steps To Maintain Product Quality Ppt PowerPoint Presentation Professional Good PDF
Presenting six steps to maintain product quality ppt powerpoint presentation professional good pdf to dispense important information. This template comprises six stages. It also presents valuable insights into the topics including create a quality management plan, define a set of metrics to validate quality requirements are met, execute quality assurance activities, monitor and resolve deliverable quality, execute quality control activities, determine the customer requirements for quality. This is a completely customizable PowerPoint theme that can be put to use immediately. So, download it and address the topic impactfully.

Private Video Streaming Platform Capital Fundraising Pitch Deck Key Statistics Associated To Video Mockup PDF
This slide caters details about key statistics associated to video hosting platform in terms of number of employees, estimated annual revenue, amount of equity raised, offices situated across globe. This is a private video streaming platform capital fundraising pitch deck key statistics associated to video mockup pdf template with various stages. Focus and dispense information on six stages using this creative set, that comes with editable features. It contains large content boxes to add your information on topics like private video streaming platform capital fundraising pitch deck various metrics determining download pdf. You can also showcase facts, figures, and other relevant content using this PPT layout. Grab it now.

Private Video Streaming Platform Capital Fundraising Pitch Deck Online Video Hosting Platform Summary PDF
This slide caters details about video hosting platform, in terms of technology utilized, headquarters, mission statement, estimated rise in viewers in US and online video platform market share in US. Deliver and pitch your topic in the best possible manner with this private video streaming platform capital fundraising pitch deck key statistics associated to video mockup pdf. Use them to share invaluable insights on private video streaming platform capital fundraising pitch deck various metrics determining download pdf and impress your audience. This template can be altered and modified as per your expectations. So, grab it now.

Private Video Streaming Platform Capital Fundraising Pitch Deck Solutions Provided By Online Themes PDF
This slide caters details about solutions rendered by video hosting platform in order to solve issues by providing platform to upload videos and video conversion for accessibility. This is a private video streaming platform capital fundraising pitch deck solutions provided by online themes pdf template with various stages. Focus and dispense information on three stages using this creative set, that comes with editable features. It contains large content boxes to add your information on topics like private video streaming platform capital fundraising pitch deck various metrics determining download pdf. You can also showcase facts, figures, and other relevant content using this PPT layout. Grab it now.

Supply Chain Approaches Why Do We Needsupply Chain Modelling Diagrams PDF
This slide shows the need of supply chain modelling which includes greater stock control, greater efficiency and reduces costs, greater accuracy in supply chain logistics, etc.Presenting Supply Chain Approaches Why Do We Needsupply Chain Modelling Diagrams PDF to provide visual cues and insights. Share and navigate important information on three stages that need your due attention. This template can be used to pitch topics like Determining Require, Inventory Level According, Metrics Resulting. In addtion, this PPT design contains high resolution images, graphics, etc, that are easily editable and available for immediate download.

Quarterly Roadmap For Corporate Business Planning Icons PDF
This slide shows marketing strategy quarterly roadmap to enhance efficiency and determine opportunities. It include metrics of goals, revenue, number of devices to sale and strategies to achieve the set objectives. Presenting Quarterly Roadmap For Corporate Business Planning Icons PDF to dispense important information. This template comprises four stages. It also presents valuable insights into the topics including Identify Target Audience, Goal, Revenue. This is a completely customizable PowerPoint theme that can be put to use immediately. So, download it and address the topic impactfully.
Project Tracking Issue Tracker Dashboard Rules PDF
The following slide highlights the project tracking issues in project management to determine and resolve them quickly. It includes metrics such as issue summary, priorities, responsible head, reporting and closing date etc. Showcasing this set of slides titled Project Tracking Issue Tracker Dashboard Rules PDF. The topics addressed in these templates are Inappropriate Supplies, Project, Tracker Dashboard. All the content presented in this PPT design is completely editable. Download it and make adjustments in color, background, font etc. as per your unique business setting.
Hoshin Kanri Strategy Chart With Major Goal S Ppt PowerPoint Presentation Icon Example File PDF
The slide shows the strategic planning X Matrix structure that includes long term goals, annual objectives, and top-level priorities and key metrics to improve the same. Pitch your topic with ease and precision using this hoshin kanri strategy chart with major goal s ppt powerpoint presentation icon example file pdf. This layout presents information on digital, improvement, targets. It is also available for immediate download and adjustment. So, changes can be made in the color, design, graphics or any other component to create a unique layout.

Customer Support Services Impact 2 Declining Ticket Backlogs And Support Cost Microsoft PDF
This slide showcases the impact of good support service on the company. The metrics covered are ticket backlog and support cost. Welcome to our selection of the Customer Support Services Impact 2 Declining Ticket Backlogs And Support Cost Microsoft PDF. These are designed to help you showcase your creativity and bring your sphere to life. Planning and Innovation are essential for any business that is just starting out. This collection contains the designs that you need for your everyday presentations. All of our PowerPoints are 100 percent editable, so you can customize them to suit your needs. This multi-purpose template can be used in various situations. Grab these presentation templates today.
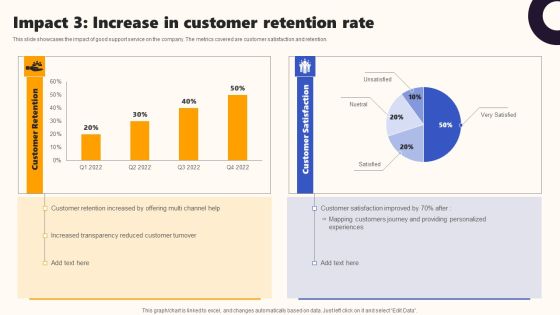
Techniques To Optimize UX Impact 3 Increase In Customer Retention Rate Graphics PDF
This slide showcases the impact of good support service on the company. The metrics covered are customer satisfaction and retention. Welcome to our selection of the Techniques To Optimize UX Impact 3 Increase In Customer Retention Rate Graphics PDF. These are designed to help you showcase your creativity and bring your sphere to life. Planning and Innovation are essential for any business that is just starting out. This collection contains the designs that you need for your everyday presentations. All of our PowerPoints are 100 percent editable, so you can customize them to suit your needs. This multi-purpose template can be used in various situations. Grab these presentation templates today.

Competitive Assessment Of Social Tactical Plan To Enhance Social Media Hiring Process Formats PDF
This slide represents competitive assessment of social recruitment metrics which includes cost per hire, engagement, quality and time to hire, sourcing channel efficiency and candidate experience.Slidegeeks has constructed Competitive Assessment Of Social Tactical Plan To Enhance Social Media Hiring Process Formats PDF after conducting extensive research and examination. These presentation templates are constantly being generated and modified based on user preferences and critiques from editors. Here, you will find the most attractive templates for a range of purposes while taking into account ratings and remarks from users regarding the content. This is an excellent jumping-off point to explore our content and will give new users an insight into our top-notch PowerPoint Templates.
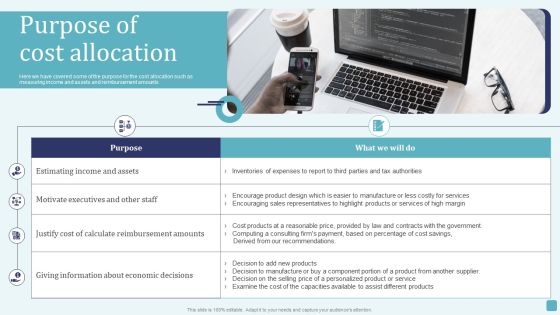
Purpose Of Cost Allocation Stages Of Cost Allocation Procedure Information PDF
The table below provides a general summary of the regional cost allocation through driver, criteria and metrics . Find highly impressive Purpose Of Cost Allocation Stages Of Cost Allocation Procedure Information PDF on Slidegeeks to deliver a meaningful presentation. You can save an ample amount of time using these presentation templates. No need to worry to prepare everything from scratch because Slidegeeks experts have already done a huge research and work for you. You need to download Purpose Of Cost Allocation Stages Of Cost Allocation Procedure Information PDF for your upcoming presentation. All the presentation templates are 100 precent editable and you can change the color and personalize the content accordingly. Download now.

Dashboard For Analyzing Brand Perception Building A Comprehensive Brand Elements PDF
This slide covers the dashboard for tracking brand reputation. It also includes metrics such as new customer lifetime value, customer acquisition cost, target met, above sales target, average weekly sales revenue, etc. Find a pre-designed and impeccable Dashboard For Analyzing Brand Perception Building A Comprehensive Brand Elements PDF. The templates can ace your presentation without additional effort. You can download these easy-to-edit presentation templates to make your presentation stand out from others. So, what are you waiting for Download the template from Slidegeeks today and give a unique touch to your presentation.
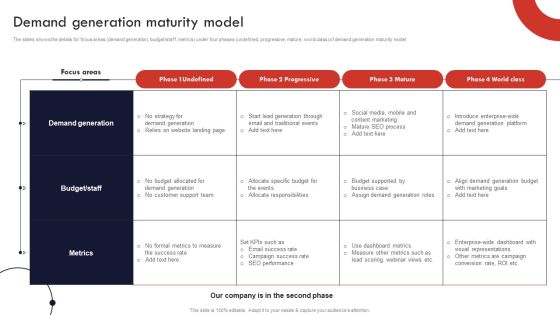
Product And Services Promotion Demand Generation Maturity Model Mockup PDF
The slides shows the details for focus areas demand generation, budget or staff, metrics under four phases undefined, progressive, mature, word-class of demand generation maturity model. Find a pre-designed and impeccable Product And Services Promotion Demand Generation Maturity Model Mockup PDF. The templates can ace your presentation without additional effort. You can download these easy-to-edit presentation templates to make your presentation stand out from others. So, what are you waiting for Download the template from Slidegeeks today and give a unique touch to your presentation.

Search Engine Marketing Evaluate And Forecast Ad Quality Score Pictures PDF
The following slide covers the ad quality score metrics to assess relevance of landing page. It includes key elements such as description, affecting factors, preference, impact strategies, calculation etc. Find a pre-designed and impeccable Search Engine Marketing Evaluate And Forecast Ad Quality Score Pictures PDF. The templates can ace your presentation without additional effort. You can download these easy-to-edit presentation templates to make your presentation stand out from others. So, what are you waiting for Download the template from Slidegeeks today and give a unique touch to your presentation.

Data Flowchart For Project QA Plan Ppt PowerPoint Presentation Gallery Show PDF
This slide depicts the data flowchart of project quality management plan which includes developing project management plan, identifying stakeholders, collecting requirements, identifying risks, project documents, quality metrics for controlling project quality, etc. Presenting data flowchart for project qa plan ppt powerpoint presentation gallery show pdf to dispense important information. This template comprises two stages. It also presents valuable insights into the topics including developing project management plan, identifying stakeholders, collecting requirements, identifying risks, project documents. This is a completely customizable PowerPoint theme that can be put to use immediately. So, download it and address the topic impactfully.
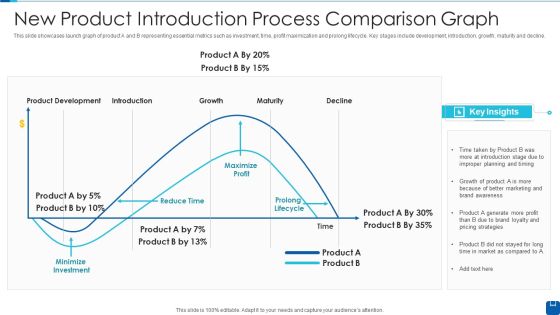
New Product Introduction Process Comparison Graph Slides PDF
This slide showcases launch graph of product A and B representing essential metrics such as investment, time, profit maximization and prolong lifecycle. Key stages include development, introduction, growth, maturity and decline.Showcasing this set of slides titled New Product Introduction Process Comparison Graph Slides PDF The topics addressed in these templates are Product Development, Improper Planning, Minimize Investment All the content presented in this PPT design is completely editable. Download it and make adjustments in color, background, font etc. as per your unique business setting.

Roles And Responsibilities Of SRE Expert Ppt Icon Layouts PDF
The following slide depicts the key roles and responsibilities SRE to manage systems and metrics reporting. It constitutes software development, incident escalation, troubleshooting, documenting processes, managing load, evaluating incidents etc. Persuade your audience using this Roles And Responsibilities Of SRE Expert Ppt Icon Layouts PDF. This PPT design covers six stages, thus making it a great tool to use. It also caters to a variety of topics including Knowledge Software Development, Managin Gload, Evaluating Incidents. Download this PPT design now to present a convincing pitch that not only emphasizes the topic but also showcases your presentation skills.
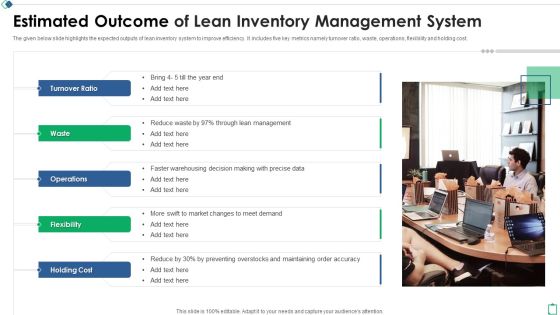
Estimated Outcome Of Lean Inventory Management System Ppt File Themes PDF
The given below slide highlights the expected outputs of lean inventory system to improve efficiency. It includes five key metrics namely turnover ratio, waste, operations, flexibility and holding cost. Persuade your audience using this Estimated Outcome Of Lean Inventory Management System Ppt File Themes PDF. This PPT design covers one stages, thus making it a great tool to use. It also caters to a variety of topics including Turnover Ratio Waste, Operations Flexibility Holding, Cost Precise Data. Download this PPT design now to present a convincing pitch that not only emphasizes the topic but also showcases your presentation skills.

Vehicle Management System KPI Dashboard Introduction PDF
This slide represents the dashboard showing real time data of fleet management to cut down operational costs and improve efficiency. It includes key metrics such as vehicles with errors, warnings, deviation from route, total vehicles, vehicles condition etc. Pitch your topic with ease and precision using this Vehicle Management System KPI Dashboard Introduction PDF. This layout presents information on Vehicle Management System, KPI Dashboard. It is also available for immediate download and adjustment. So, changes can be made in the color, design, graphics or any other component to create a unique layout.
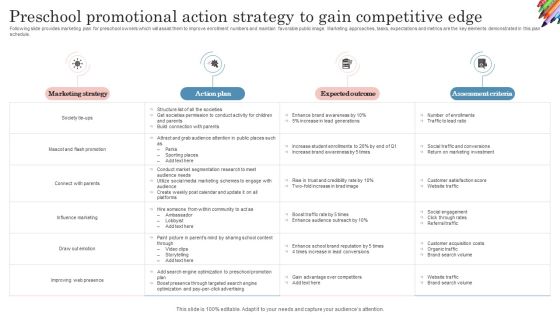
Preschool Promotional Action Strategy To Gain Competitive Edge Download PDF
Following slide provides marketing plan for preschool owners which will assist them to improve enrollment numbers and maintain favorable public image. Marketing approaches, tasks, expectations and metrics are the key elements demonstrated in this plan schedule. Pitch your topic with ease and precision using this Preschool Promotional Action Strategy To Gain Competitive Edge Download PDF. This layout presents information on Marketing Strategy, Action Plan, Expected Outcome, Assessment Criteria. It is also available for immediate download and adjustment. So, changes can be made in the color, design, graphics or any other component to create a unique layout.

Effective Direct Field Marketing Manager Checklist Ideas PDF
This slide presents checklist for field marketing manger to build effective plan and campaign that would help brand outgrow its competitors and improve brand perception. It includes verifying budget, setting SMART goals, evaluating competitors and settings metrics to be tracked. Pitch your topic with ease and precision using this Effective Direct Field Marketing Manager Checklist Ideas PDF. This layout presents information on Effective Direct Field, Marketing Manager, Checklist. It is also available for immediate download and adjustment. So, changes can be made in the color, design, graphics or any other component to create a unique layout.

Big Data In Health Industry Dashboard In Industry Summary PDF
The slide depicts patient KPI dashboard for healthcare which can be used to improve service levels as well as treatment across departments. It include metrics such as bed occupancy rate, patient turnover, satisfaction rate, missed and cancelled appointment rate. Showcasing this set of slides titled Big Data In Health Industry Dashboard In Industry Summary PDF. The topics addressed in these templates are Geriatrics, Gynecology, Internal Medicine. All the content presented in this PPT design is completely editable. Download it and make adjustments in color, background, font etc. as per your unique business setting.

Digitalization Benefits In Healthcare Program Brochure PDF
This slide presents digital transformation benefits in healthcare project that is helpful in getting more accurate patient data, health metrics and providing effective treatment in lesser time. It offers process automation, alert system, better care, continuous improvement and transparency. Showcasing this set of slides titled Digitalization Benefits In Healthcare Program Brochure PDF. The topics addressed in these templates are Process Automation, Alert System, Better Care. All the content presented in this PPT design is completely editable. Download it and make adjustments in color, background, font etc. as per your unique business setting.

Change Readiness Analysis Of Various Departments Portrait PDF
The following slide outlines a heatmap to assess each department multiple times over a time period for conforming whether there is deterioration or improvement in readiness to change. It covers departments and metrics to calculate overall results. Persuade your audience using this Change Readiness Analysis Of Various Departments Portrait PDF. This PPT design covers one stage, thus making it a great tool to use. It also caters to a variety of topics including Change Awareness, Change Acceptance, Overall Preparation. Download this PPT design now to present a convincing pitch that not only emphasizes the topic but also showcases your presentation skills.

Introducing Our New Sales Cycle Business To Business Promotion Sales Lead Template PDF
Developing a new sales cycle is key strategy for any organization as it highlights the new sales cycle of the organization. The provided displays key metrics of the such as sales cycle, technology used etc.This is a Introducing Our New Sales Cycle Business To Business Promotion Sales Lead Template PDF template with various stages. Focus and dispense information on seven stages using this creative set, that comes with editable features. It contains large content boxes to add your information on topics like Prospecting, Prospect Qualification, Sales Presentation You can also showcase facts, figures, and other relevant content using this PPT layout. Grab it now.

BANT Sales Lead Qualification Model Introducing Our New Sales Cycle Download PDF
Developing a new sales cycle is key strategy for any organization as it highlights the new sales cycle of the organization. The provided displays key metrics of the such as sales cycle, technology used etc. Deliver and pitch your topic in the best possible manner with this BANT Sales Lead Qualification Model Introducing Our New Sales Cycle Download PDF. Use them to share invaluable insights on Lead Generation, Prospect Qualification, Sales Presentation and impress your audience. This template can be altered and modified as per your expectations. So, grab it now.

Company Sales Lead Qualification Procedure To Enhance Revenue Introducing Our New Sales Cycle Ideas PDF
Developing a new sales cycle is key strategy for any organization as it highlights the new sales cycle of the organization. The provided displays key metrics of the such as sales cycle, technology used etc.Deliver an awe inspiring pitch with this creative Company Sales Lead Qualification Procedure To Enhance Revenue Introducing Our New Sales Cycle Ideas PDF bundle. Topics like Lead Generation, Prospect Qualification, Sales Presentation can be discussed with this completely editable template. It is available for immediate download depending on the needs and requirements of the user.
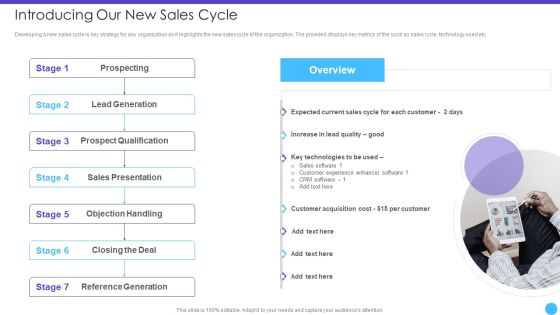
Sales Lead Qualification Rating Framework Introducing Our New Sales Cycle Structure PDF
Developing a new sales cycle is key strategy for any organization as it highlights the new sales cycle of the organization. The provided displays key metrics of the such as sales cycle, technology used etc.This is a Sales Lead Qualification Rating Framework Introducing Our New Sales Cycle Structure PDF template with various stages. Focus and dispense information on seven stages using this creative set, that comes with editable features. It contains large content boxes to add your information on topics like Prospecting, Lead Generation, Prospect Qualification You can also showcase facts, figures, and other relevant content using this PPT layout. Grab it now.

Sales Lead Qualification Procedure And Parameter Introducing Our New Sales Cycle Microsoft PDF
Developing a new sales cycle is key strategy for any organization as it highlights the new sales cycle of the organization. The provided displays key metrics of the such as sales cycle, technology used etc.This is a Sales Lead Qualification Procedure And Parameter Introducing Our New Sales Cycle Microsoft PDF template with various stages. Focus and dispense information on one stage using this creative set, that comes with editable features. It contains large content boxes to add your information on topics like Prospect Qualification, Sales Presentation, Objection Handling You can also showcase facts, figures, and other relevant content using this PPT layout. Grab it now.

SRE Engagement Model With Service Lifecycle Ppt Pictures Microsoft PDF
The following slide highlights the SRE involvement framework to optimize metrics reporting. It also includes elements such as architecture design, active development, general availability, deprecation etc. Persuade your audience using this SRE Engagement Model With Service Lifecycle Ppt Pictures Microsoft PDF. This PPT design covers three stages, thus making it a great tool to use. It also caters to a variety of topics including Limited Availability, Service Lifetime, SRE Involvement. Download this PPT design now to present a convincing pitch that not only emphasizes the topic but also showcases your presentation skills.

Marketing Communication Manager 30 60 90 Day Program Rules PDF
This slide consists of a 30 60 90 day plan which to be followed by marketing communication manager in order to meet organizational. The key elements include meet with operation manager, review feedback, develop metrics etc. Presenting Marketing Communication Manager 30 60 90 Day Program Rules PDF to dispense important information. This template comprises three stages. It also presents valuable insights into the topics including Management, Individuals, Progress. This is a completely customizable PowerPoint theme that can be put to use immediately. So, download it and address the topic impactfully.

KPI Dashboard Showing Results Of Content Formulation Clipart PDF
This slide shows the dashboard which can be used by content manager to represent the impact of content development on the website. It includes metrics such as blog visitors, blog first touch, new customers. Showcasing this set of slides titled KPI Dashboard Showing Results Of Content Formulation Clipart PDF. The topics addressed in these templates are Blog Visitors, Blog First Touch, New Customers. All the content presented in this PPT design is completely editable. Download it and make adjustments in color, background, font etc. as per your unique business setting.

Business Framework How To Measure Key Performance Indicator PowerPoint Presentation
This Power Point diagram slide has been crafted with graphic of flower petal diagram. This PPT slide contains the concept of measuring the key performance and indicate it. Use this PPT slide for your management related presentation.

Business Strategy Scorecard Dashboard Ppt Slides
This is a business strategy scorecard dashboard ppt slides. This is a five stage process. The stages in this process are marketing, logistics, production, planning, combined strategy.

Marketing Kpis Monitor Dashboard Ppt Examples
This is a marketing kpis monitor dashboard ppt examples. This is a five stage process. The stages in this process are awareness, interest, consideration, preference, purchase.

Channel Kpis Ppt PowerPoint Presentation Ideas
This is a channel kpis ppt powerpoint presentation ideas. This is a four stage process. The stages in this process are inspiration, evaluation, purchase, after sales, catalog magazine, call center, instore displays.

Dashboard Depicting Kpis To Track Sales Performance Integrating Technology To Transform Change Portrait PDF
This slide covers the dashboard that depicts metrics to track company sales performance that focuses on number of sales, cost breakdown, accumulated revenues, incremental sales, etc.If you are looking for a format to display your unique thoughts, then the professionally designed Dashboard Depicting Kpis To Track Sales Performance Integrating Technology To Transform Change Portrait PDF is the one for you. You can use it as a Google Slides template or a PowerPoint template. Incorporate impressive visuals, symbols, images, and other charts. Modify or reorganize the text boxes as you desire. Experiment with shade schemes and font pairings. Alter, share or cooperate with other people on your work. Download Dashboard Depicting Kpis To Track Sales Performance Integrating Technology To Transform Change Portrait PDF and find out how to give a successful presentation. Present a perfect display to your team and make your presentation unforgettable.

Business Diagram Pie Chart With Key Performance Indicator Presentation Template
This power point template slide has been crafted with graphic of pie chart and magnifier. This PPT contains the concept of performance indication. Use this PPT for data technology and business related presentations.

Dashboard To Measure Performance Of Social Media Retail Business Growth Marketing Techniques Ideas PDF
This following slide displays the key metrics that can help an organization to measure effectiveness of social media strategies. These can be leads generated, leads by region, web traffic targets etc If you are looking for a format to display your unique thoughts, then the professionally designed Dashboard To Measure Performance Of Social Media Retail Business Growth Marketing Techniques Ideas PDF is the one for you. You can use it as a Google Slides template or a PowerPoint template. Incorporate impressive visuals, symbols, images, and other charts. Modify or reorganize the text boxes as you desire. Experiment with shade schemes and font pairings. Alter, share or cooperate with other people on your work. Download Dashboard To Measure Performance Of Social Media Retail Business Growth Marketing Techniques Ideas PDF and find out how to give a successful presentation. Present a perfect display to your team and make your presentation unforgettable.

Integrating CRM Solution To Acquire Potential Customers CRM Email Nurturing Campaign Dashboard Template PDF
This slide represents key metrics dashboard to analyze, manage and track the performance of email nurturing campaign organized by the enterprise. It incudes details related to KPIs such as conversion rate, average order value etc. If you are looking for a format to display your unique thoughts, then the professionally designed Integrating CRM Solution To Acquire Potential Customers CRM Email Nurturing Campaign Dashboard Template PDF is the one for you. You can use it as a Google Slides template or a PowerPoint template. Incorporate impressive visuals, symbols, images, and other charts. Modify or reorganize the text boxes as you desire. Experiment with shade schemes and font pairings. Alter, share or cooperate with other people on your work. Download Integrating CRM Solution To Acquire Potential Customers CRM Email Nurturing Campaign Dashboard Template PDF and find out how to give a successful presentation. Present a perfect display to your team and make your presentation unforgettable.

Creating Positioning Techniques For Market Research Analyzing Customer Demographics Through Performance Background PDF
The following slide outlines key performance indicator KPI dashboard outlining customer demographics. Information covered in this slide is related to metrics such as gender, education level, technology adoption life cycle, and brand innovation consent. If you are looking for a format to display your unique thoughts, then the professionally designed Creating Positioning Techniques For Market Research Analyzing Customer Demographics Through Performance Background PDF is the one for you. You can use it as a Google Slides template or a PowerPoint template. Incorporate impressive visuals, symbols, images, and other charts. Modify or reorganize the text boxes as you desire. Experiment with shade schemes and font pairings. Alter, share or cooperate with other people on your work. Download Creating Positioning Techniques For Market Research Analyzing Customer Demographics Through Performance Background PDF and find out how to give a successful presentation. Present a perfect display to your team and make your presentation unforgettable.
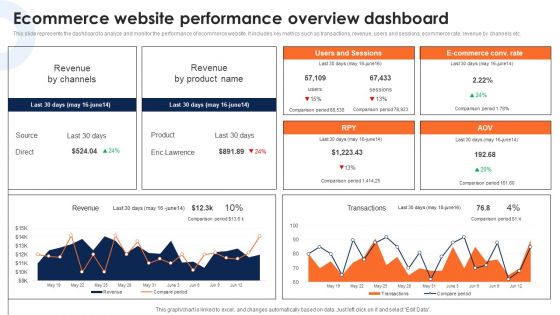
Ecommerce Website Performance Overview Dashboard Deploying Ecommerce Order Management Infographics PDF
This slide represents the dashboard to analyze and monitor the performance of ecommerce website. It includes key metrics such as transactions, revenue, users and sessions, ecommerce rate, revenue by channels etc.If you are looking for a format to display your unique thoughts, then the professionally designed Ecommerce Website Performance Overview Dashboard Deploying Ecommerce Order Management Infographics PDF is the one for you. You can use it as a Google Slides template or a PowerPoint template. Incorporate impressive visuals, symbols, images, and other charts. Modify or reorganize the text boxes as you desire. Experiment with shade schemes and font pairings. Alter, share or cooperate with other people on your work. Download Ecommerce Website Performance Overview Dashboard Deploying Ecommerce Order Management Infographics PDF and find out how to give a successful presentation. Present a perfect display to your team and make your presentation unforgettable.

Search Engine Marketing Refine Keyword List To Improve Click Through Rate Microsoft PDF
The following slide covers the conversion rate metrics to compare and contrast performance. It includes elements such as description, affecting factors, preference, impact, strategies, formula etc. to get more value from customers. If you are looking for a format to display your unique thoughts, then the professionally designed Search Engine Marketing Refine Keyword List To Improve Click Through Rate Microsoft PDF is the one for you. You can use it as a Google Slides template or a PowerPoint template. Incorporate impressive visuals, symbols, images, and other charts. Modify or reorganize the text boxes as you desire. Experiment with shade schemes and font pairings. Alter, share or cooperate with other people on your work. Download Search Engine Marketing Refine Keyword List To Improve Click Through Rate Microsoft PDF and find out how to give a successful presentation. Present a perfect display to your team and make your presentation unforgettable.

Dashboard For Inbound Marketing Efforts Marketing Tactics To Enhance Business Graphics PDF
The following slide displays key metrics that can help the organization to measure effectiveness of inbound marketing strategy, these can be cost per conversion, clicks, impressions, etc. If you are looking for a format to display your unique thoughts, then the professionally designed Dashboard For Inbound Marketing Efforts Marketing Tactics To Enhance Business Graphics PDF is the one for you. You can use it as a Google Slides template or a PowerPoint template. Incorporate impressive visuals, symbols, images, and other charts. Modify or reorganize the text boxes as you desire. Experiment with shade schemes and font pairings. Alter, share or cooperate with other people on your work. Download Dashboard For Inbound Marketing Efforts Marketing Tactics To Enhance Business Graphics PDF and find out how to give a successful presentation. Present a perfect display to your team and make your presentation unforgettable.
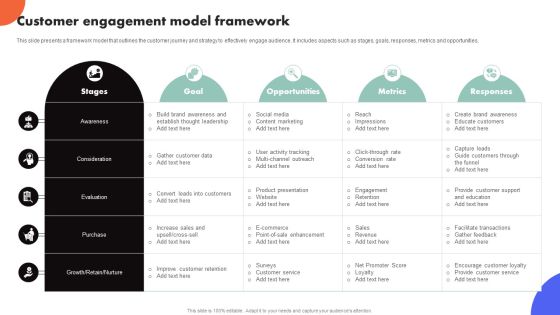
Improving Buyer Journey Through Strategic Customer Engagement Customer Engagement Model Framework Slides PDF
This slide presents a framework model that outlines the customer journey and strategy to effectively engage audience. It includes aspects such as stages, goals, responses, metrics and opportunities. If you are looking for a format to display your unique thoughts, then the professionally designed Improving Buyer Journey Through Strategic Customer Engagement Customer Engagement Model Framework Slides PDF is the one for you. You can use it as a Google Slides template or a PowerPoint template. Incorporate impressive visuals, symbols, images, and other charts. Modify or reorganize the text boxes as you desire. Experiment with shade schemes and font pairings. Alter, share or cooperate with other people on your work. Download Improving Buyer Journey Through Strategic Customer Engagement Customer Engagement Model Framework Slides PDF and find out how to give a successful presentation. Present a perfect display to your team and make your presentation unforgettable.

A B Email Testing Strategy For Generating Higher ROI Slides PDF
This slide covers the A or B testing technique to determine which email variant generates the best results and improves email metrics such as open email rate, click to open, and conversion rates. If you are looking for a format to display your unique thoughts, then the professionally designed A B Email Testing Strategy For Generating Higher ROI Slides PDF is the one for you. You can use it as a Google Slides template or a PowerPoint template. Incorporate impressive visuals, symbols, images, and other charts. Modify or reorganize the text boxes as you desire. Experiment with shade schemes and font pairings. Alter, share or cooperate with other people on your work. Download A B Email Testing Strategy For Generating Higher ROI Slides PDF and find out how to give a successful presentation. Present a perfect display to your team and make your presentation unforgettable.

Dashboard To Manage Marketing Campaigns Of Multiple Brands Structure PDF
This slide showcases dashboard that can help organization to manage the marketing campaigns in multi brand strategy. Its key elements are lead breakdown, total leads, key conversion metrics etc.If you are looking for a format to display your unique thoughts, then the professionally designed Dashboard To Manage Marketing Campaigns Of Multiple Brands Structure PDF is the one for you. You can use it as a Google Slides template or a PowerPoint template. Incorporate impressive visuals, symbols, images, and other charts. Modify or reorganize the text boxes as you desire. Experiment with shade schemes and font pairings. Alter, share or cooperate with other people on your work. Download Dashboard To Manage Marketing Campaigns Of Multiple Brands Structure PDF and find out how to give a successful presentation. Present a perfect display to your team and make your presentation unforgettable.

Top SEO Techniques Seo Reporting Dashboard To Evaluate Website Rank Ideas PDF
The purpose of this slide is to outline mobile search engine optimization SEO reporting dashboard. It covers different metrics such as web traffic overview, total views, content overview, goal value and conversion etc. If you are looking for a format to display your unique thoughts, then the professionally designed Top SEO Techniques Seo Reporting Dashboard To Evaluate Website Rank Ideas PDF is the one for you. You can use it as a Google Slides template or a PowerPoint template. Incorporate impressive visuals, symbols, images, and other charts. Modify or reorganize the text boxes as you desire. Experiment with shade schemes and font pairings. Alter, share or cooperate with other people on your work. Download Top SEO Techniques Seo Reporting Dashboard To Evaluate Website Rank Ideas PDF and find out how to give a successful presentation. Present a perfect display to your team and make your presentation unforgettable.
Effective Lead Generation For Higher Conversion Rates Dashboard For Tracking Leads Generated From Various Guidelines PDF
This slide covers the KPI dashboard for tracking metrics such as leads, ACV wins, customer acquisition cost, click-through rate, and cost per conversion. It also includes leads per various campaigns such as social media, paid marketing, email marketing, etc. If you are looking for a format to display your unique thoughts, then the professionally designed Effective Lead Generation For Higher Conversion Rates Dashboard For Tracking Leads Generated From Various Guidelines PDF is the one for you. You can use it as a Google Slides template or a PowerPoint template. Incorporate impressive visuals, symbols, images, and other charts. Modify or reorganize the text boxes as you desire. Experiment with shade schemes and font pairings. Alter, share or cooperate with other people on your work. Download Effective Lead Generation For Higher Conversion Rates Dashboard For Tracking Leads Generated From Various Guidelines PDF and find out how to give a successful presentation. Present a perfect display to your team and make your presentation unforgettable.

A B Testing Strategy To Effectively Run Facebook Ads Ppt PowerPoint Presentation Diagram PDF
The following slide outlines A or B testing technique through which advertisers can evaluate effectiveness of different ad variations and make data-driven decisions. It provides information about key metrics such as total clicks, reach, and conversion rate. If you are looking for a format to display your unique thoughts, then the professionally designed A B Testing Strategy To Effectively Run Facebook Ads Ppt PowerPoint Presentation Diagram PDF is the one for you. You can use it as a Google Slides template or a PowerPoint template. Incorporate impressive visuals, symbols, images, and other charts. Modify or reorganize the text boxes as you desire. Experiment with shade schemes and font pairings. Alter, share or cooperate with other people on your work. Download A B Testing Strategy To Effectively Run Facebook Ads Ppt PowerPoint Presentation Diagram PDF and find out how to give a successful presentation. Present a perfect display to your team and make your presentation unforgettable.

Kpis For Media Campaigns Evaluation Ppt PowerPoint Presentation Deck
This is a kpis for media campaigns evaluation ppt powerpoint presentation deck. This is a three stage process. The stages in this process are traffic, engagement, conversion, website visitors.
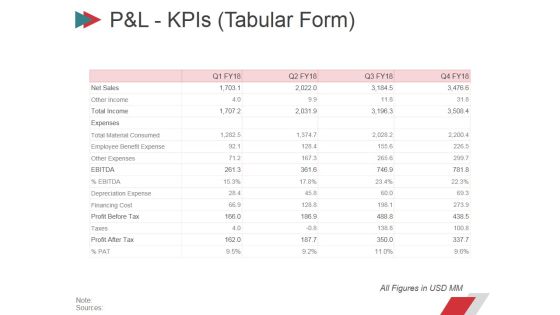
Pandl Kpis Tabular Form Ppt PowerPoint Presentation Summary Layout
This is a pandl kpis tabular form ppt powerpoint presentation summary layout. This is a four stage process. The stages in this process are revenue, cogs, operating profit, net profit.

Pandl Kpis Tabular Form Ppt PowerPoint Presentation File Design Templates
This is a pandl kpis tabular form ppt powerpoint presentation file design templates. This is a four stage process. The stages in this process are revenue, cogs, operating profit, net profit.

Balance Sheet Kpis Ppt PowerPoint Presentation Infographics Good
This is a balance sheet kpis ppt powerpoint presentation infographics good. This is a four stage process. The stages in this process are current assets, current liabilities, total assets, total liabilities.

Cash Flow Statement Kpis Ppt PowerPoint Presentation Model Samples
This is a cash flow statement kpis ppt powerpoint presentation model samples. This is a four stage process. The stages in this process are operations, financing activities, investing activities, increase in cash.
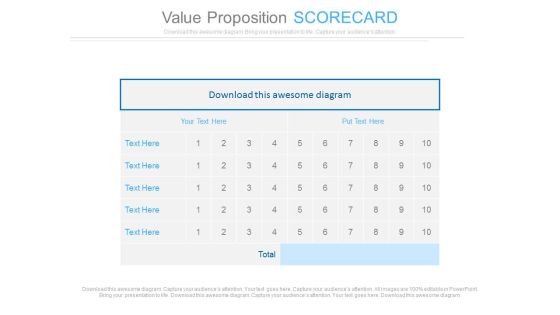
Value Proposition Scorecard Ppt Slides
This is a value proposition scorecard ppt slides. This is a five stage process. The stages in this process are success, business, marketing.

3d Interconnected Puzzle Illustrating 4 Stages Ppt Process Flow Chart Examples PowerPoint Templates
We present our 3d interconnected puzzle illustrating 4 stages ppt process flow chart examples PowerPoint templates.Use our Success PowerPoint Templates because, The success of your venture depends on the performance of every team member. Use our Puzzles or Jigsaws PowerPoint Templates because,Others respect the intrinsic value of your words. Use our Shapes PowerPoint Templates because,This is a wonderful graphics to see the smiles of happiness spread as your audience realizes the value of your words. Use our Business PowerPoint Templates because,Maximising sales of your product is the intended destination. Use our Metaphors-Visual Concepts PowerPoint Templates because,Motivating your team will cross all barriers.Use these PowerPoint slides for presentations relating to Assembly, complete, concept, copy, finish, finished, fit, idea, interlock, jigsaw, match, metaphor, mystery, outline, patience, picture, piece, play, playing, point, pointing, problem, puzzle, quiz, skill, solution, solved, space, struggle, success, support, teamwork. The prominent colors used in the PowerPoint template are Blue, Gray, Black

Steps To Measuring The Business Value Powerpoint Presentation
This is a steps to measuring the business value powerpoint presentation. This is a five stage process. The stages in this process are define business goals, identify user personas, create adoption plan and kpis, execute plan and measure success, refine plan and adjust kpis.

Customer Discovery Scorecard Ppt PowerPoint Presentation Good
This is a customer discovery scorecard ppt powerpoint presentation good. This is a four stage process. The stages in this process are business, strategy, marketing, success, process, analysis.
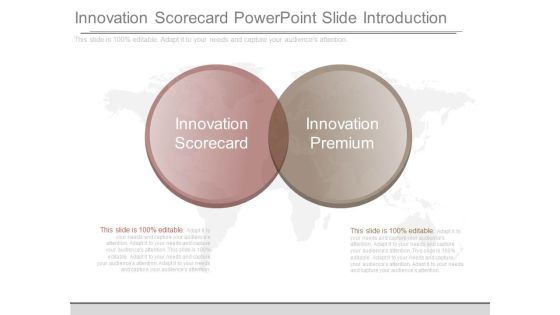
Innovation Scorecard Powerpoint Slide Introduction
This is a innovation scorecard powerpoint slide introduction. This is a two stage process. The stages in this process are innovation scorecard, innovation premium.

Cash Flow Statement Kpis Tabular Form Ppt PowerPoint Presentation Infographics File Formats
This is a cash flow statement kpis tabular form ppt powerpoint presentation infographics file formats. This is a four stage process. The stages in this process are operations, investing activities, financing activities, net increase in cash.

Cash Flow Statement Kpis Tabular Form Ppt PowerPoint Presentation Layouts Grid
This is a cash flow statement kpis tabular form ppt powerpoint presentation layouts grid. This is a four stage process. The stages in this process are operations, financing activities, investing activities, net increase in cash.

Cash Flow Statement Kpis Template 2 Ppt PowerPoint Presentation Summary Guidelines
This is a cash flow statement kpis template 2 ppt powerpoint presentation summary guidelines. This is a four stage process. The stages in this process are operations, investing activities, net increase in cash, financing activities.
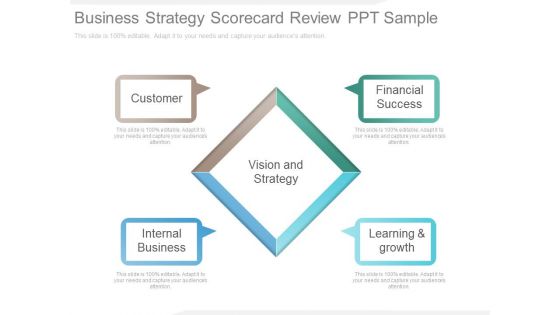
Business Strategy Scorecard Review Ppt Sample
This is a business strategy scorecard review ppt sample. This is a five stage process. The stages in this process are customer, internal business, vision and strategy, financial success, learning and growth.

Balance Scorecard Index Dashboard Ppt Slides
This is a balance scorecard index dashboard ppt slides. This is a one stage process. The stages in this process are sales by month, gross revenue, customer retention, executive scorecard, measures, status, trend, financial, option, customer, internal processes, learning and growth.

Implement Parallel Marketing Process Ppt Nonprofit Business Plan Template PowerPoint Slides
We present our implement parallel marketing process ppt nonprofit business plan template PowerPoint Slides.Download and present our Marketing PowerPoint Templates because networking is an imperative in todays world. You need to access the views of others. Similarly you need to give access to them of your abilities. Present our Business PowerPoint Templates because this layout helps you to bring some important aspects of your business process to the notice of all concerned. Streamline the flow of information across the board. Download and present our Arrows PowerPoint Templates because Our PowerPoint Templates and Slides will let you Clearly mark the path for others to follow. Download and present our Symbol PowerPoint Templates because Your success is our commitment. Our PowerPoint Templates and Slides will ensure you reach your goal. Download our Success PowerPoint Templates because the success of your venture depends on the performance of every team member.Use these PowerPoint slides for presentations relating to 3d, Arrow, Background, Banner, Brochure, Business, Choice, Company, Compare, Content, Corporate, Creative, Description, Design, 10, Goal, Icon, Illustration, Label, Modern, Number, Option, Order, Product, Profit, Progress, Promotion, Red, Rounded, Sequence, Simple, Solution, Special, Standing, Statistic, Step, Success, Symbol, Template. The prominent colors used in the PowerPoint template are Blue, Gray, Black. Customers tell us our implement parallel marketing process ppt nonprofit business plan template PowerPoint Slides are Majestic. Use our Business PowerPoint templates and PPT Slides are Upbeat. PowerPoint presentation experts tell us our implement parallel marketing process ppt nonprofit business plan template PowerPoint Slides are Enchanting. People tell us our Business PowerPoint templates and PPT Slides are Functional. We assure you our implement parallel marketing process ppt nonprofit business plan template PowerPoint Slides are One-of-a-kind. People tell us our Choice PowerPoint templates and PPT Slides are Swanky.
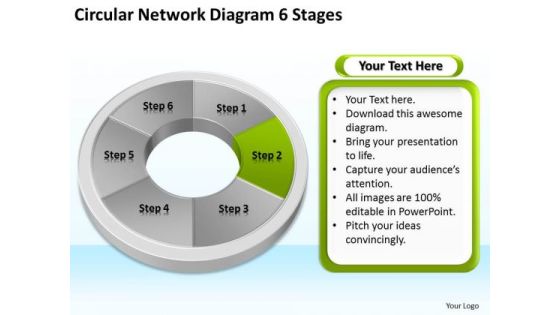
Circular Network Diagram 6 Stages Sales Business Plan Outline PowerPoint Slides
We present our circular network diagram 6 stages sales business plan outline PowerPoint Slides.Download our Process and Flows PowerPoint Templates because You can Zap them with our PowerPoint Templates and Slides. See them reel under the impact. Download and present our Business PowerPoint Templates because You have the co-ordinates for your destination of success. Let our PowerPoint Templates and Slides map out your journey. Present our Marketing PowerPoint Templates because Our PowerPoint Templates and Slides are aesthetically designed to attract attention. We gaurantee that they will grab all the eyeballs you need. Use our Business PowerPoint Templates because You can Be the star of the show with our PowerPoint Templates and Slides. Rock the stage with your ideas. Use our Success PowerPoint Templates because You are an avid believer in ethical practices. Highlight the benefits that accrue with our PowerPoint Templates and Slides.Use these PowerPoint slides for presentations relating to Pie, chart, business, concept, success, icon, account, market, isolated, slice, economy, presentation, diagram, circle, wealth, percentage, graphic,finance, data, report, marketing, analyzing, accounting, partition, management, graph, illustration, earnings, piece, strategy, money, planning, growth, progress,profit, part, information, investment, improvement, statistic, financial, measure, six, savings, performance. The prominent colors used in the PowerPoint template are Green lime, White, Gray.

Balanced Scorecard Strategy Timeline Powerpoint Show
This is a balanced scorecard strategy timeline powerpoint show. This is a four stage process. The stages in this process are balanced scorecard strategy, focused organization, translated strategy, organizational alignment.

Balanced Scorecard Dashboard Illustration Ppt Slides
This is a balanced scorecard dashboard illustration ppt slides. This is a five stage process. The stages in this process are business benefits, financials, schedule, technology, customer.

Balanced Scorecard Customer Dashboard Ppt Slides
This is a balanced scorecard customer dashboard ppt slides. This is a five stage process. The stages in this process are processes, partner, technology, stakeholders, people.
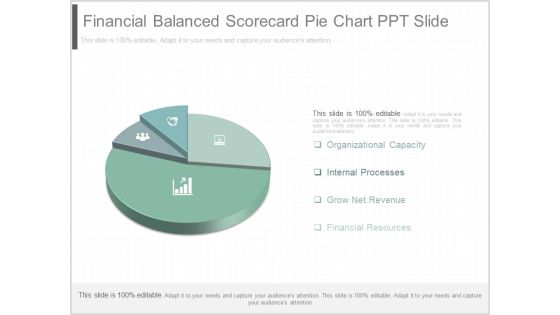
Financial Balanced Scorecard Pie Chart Ppt Slide
This is a financial balanced scorecard pie chart ppt slide. This is a four stage process. The stages in this process are organizational capacity, internal processes, grow net revenue, financial resources.
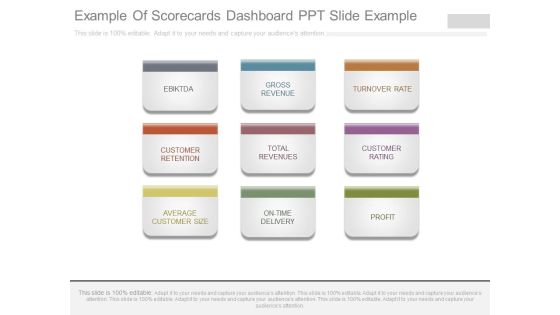
Example Of Scorecards Dashboard Ppt Slide Example
This is a example of scorecards dashboard ppt slide example. This is a nine stage process. The stages in this process are ebiktda, gross revenue, turnover rate, customer retention, total revenues, customer rating, average customer size, on time delivery, profit.

Conduct Baseline Measure Identify Measures Ppt Slides
This is a conduct baseline measure identify measures ppt slides. This is a five stage process. The stages in this process are marketing, business, success.

Achieving High Level Organizational Performance Certification Icon Template PDF
Persuade your audience using this Achieving High Level Organizational Performance Certification Icon Template PDF. This PPT design covers three stages, thus making it a great tool to use. It also caters to a variety of topics including Achieving High Level, Organizational Performance, Certification Icon. Download this PPT design now to present a convincing pitch that not only emphasizes the topic but also showcases your presentation skills.

Download Model Circular Process How Write Business Plan Free PowerPoint Templates
We present our download model circular process how write business plan free PowerPoint templates.Download our Business PowerPoint Templates because everybody knows The world over it is a priority for many. Along with it there are so many oppurtunities waiting to be utilised. Download and present our Arrows PowerPoint Templates because this one depicts the popular chart. Present our Success PowerPoint Templates because the success of your venture depends on the performance of every team member. Present our Marketing PowerPoint Templates because networking is an imperative in todays world. You need to access the views of others. Similarly you need to give access to them of your abilities. Use our Process and Flows PowerPoint Templates because using our templates for your colleagues will impart knowledge to feed.Use these PowerPoint slides for presentations relating to Background, business, chart, circle, colors, concept, cycle, data, development, diagram, graphic, illustration, model, objects, organization, phase, plan, process, product, project, shape, software, steps, strategy, success, system, team, workflow. The prominent colors used in the PowerPoint template are Purple, Gray, Black. Use our download model circular process how write business plan free PowerPoint templates are Fabulous. Customers tell us our development PowerPoint templates and PPT Slides will get their audience's attention. You can be sure our download model circular process how write business plan free PowerPoint templates are Luxuriant. The feedback we get is that our circle PowerPoint templates and PPT Slides are Exuberant. You can be sure our download model circular process how write business plan free PowerPoint templates are aesthetically designed to attract attention. We guarantee that they will grab all the eyeballs you need. People tell us our circle PowerPoint templates and PPT Slides are Adorable.
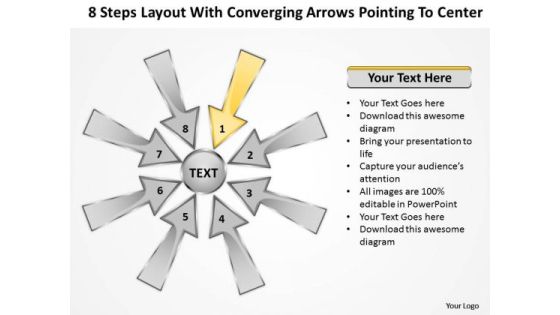
Layout With Converging Arrows Pointing To Center Cycle Flow Network PowerPoint Templates
We present our layout with converging arrows pointing to center Cycle Flow Network PowerPoint templates.Download our Success PowerPoint Templates because the success of your venture depends on the performance of every team member. Download and present our Symbol PowerPoint Templates because it shows them how to persistently hit bullseye. Download our Arrows PowerPoint Templates because your team and you always raise a toast. Use our Process and Flows PowerPoint Templates because with the help of our Slides you can Illustrate your plans on using the many social media modes available to inform soceity at large of the benefits of your product. Download our Shapes PowerPoint Templates because this template with an image of helps you chart the course of your presentation.Use these PowerPoint slides for presentations relating to Arrow, Art, Business, Chart, Design, Development, Diagram, Flow, Flowchart, Graphic, Gray, Idea, Info, Graphic, Management, Method, Model, Process, Quality, Rainbow, Research, Sign, Software, Strategy, Success, System, Template, Text, Vector, Website, Work. The prominent colors used in the PowerPoint template are Yellow, Gray, Black. Customers tell us our layout with converging arrows pointing to center Cycle Flow Network PowerPoint templates are Wistful. Customers tell us our Diagram PowerPoint templates and PPT Slides are Zippy. Presenters tell us our layout with converging arrows pointing to center Cycle Flow Network PowerPoint templates will help them to explain complicated concepts. PowerPoint presentation experts tell us our Design PowerPoint templates and PPT Slides are Swanky. Customers tell us our layout with converging arrows pointing to center Cycle Flow Network PowerPoint templates are Stunning. Professionals tell us our Diagram PowerPoint templates and PPT Slides are Magnificent.

Five Outcomes Of Business Model Circular Process Ppt 1 Mock Plan PowerPoint Templates
We present our five outcomes of business model circular process ppt 1 mock plan PowerPoint templates.Download our Business PowerPoint Templates because this is the unerring accuracy in reaching the target. the effortless ability to launch into flight. Use our Arrows PowerPoint Templates because there is a very good saying that prevention is better than cure, either way you have a store of knowledge for sure. Download and present our Success PowerPoint Templates because the success of your venture depends on the performance of every team member. Download our Marketing PowerPoint Templates because you can Ring them out loud with your brilliant ideas. Present our Process and Flows PowerPoint Templates because they are logical, accurate and to the point.Use these PowerPoint slides for presentations relating to Background, business, chart, circle, colors, concept, cycle, data, development, diagram, graphic, illustration, model, objects, organization, phase, plan, process, product, project, shape, software, steps, strategy, success, system, team, workflow. The prominent colors used in the PowerPoint template are Green, Black, Gray. Use our five outcomes of business model circular process ppt 1 mock plan PowerPoint templates are Lush. Customers tell us our data PowerPoint templates and PPT Slides are effectively colour coded to prioritise your plans They automatically highlight the sequence of events you desire. You can be sure our five outcomes of business model circular process ppt 1 mock plan PowerPoint templates are Royal. The feedback we get is that our cycle PowerPoint templates and PPT Slides are Liberated. You can be sure our five outcomes of business model circular process ppt 1 mock plan PowerPoint templates are Swanky. People tell us our circle PowerPoint templates and PPT Slides are Excellent.

Circular Arrow In PowerPoint 3 Stages Baseline To Measure Improvements Templates
We present our circular arrow in powerpoint 3 stages baseline to measure improvements templates.Use our Flow Charts PowerPoint Templates because You have gained great respect for your brilliant ideas. Use our PowerPoint Templates and Slides to strengthen and enhance your reputation. Use our Arrows PowerPoint Templates because Our PowerPoint Templates and Slides are endowed to endure. Ideas conveyed through them will pass the test of time. Use our Business PowerPoint Templates because Our PowerPoint Templates and Slides will provide you a launch platform. Give a lift off to your ideas and send them into orbit. Download and present our Success PowerPoint Templates because Our PowerPoint Templates and Slides offer you the widest possible range of options. Present our Shapes PowerPoint Templates because You can Create a matrix with our PowerPoint Templates and Slides. Feel the strength of your ideas click into place.Use these PowerPoint slides for presentations relating to Advertising, arrow, background, banner, green, concept, creative, design, direction, flow, illustration, info graphic, layout, manual, marketing, process, product, promotion, special, step, symbol, template, version, website. The prominent colors used in the PowerPoint template are Green, Gray, White. People tell us our circular arrow in powerpoint 3 stages baseline to measure improvements templates are visually appealing. Presenters tell us our design PowerPoint templates and PPT Slides are designed by a team of presentation professionals. Customers tell us our circular arrow in powerpoint 3 stages baseline to measure improvements templates are designed by a team of presentation professionals. Customers tell us our background PowerPoint templates and PPT Slides are specially created by a professional team with vast experience. They diligently strive to come up with the right vehicle for your brilliant Ideas. Professionals tell us our circular arrow in powerpoint 3 stages baseline to measure improvements templates are aesthetically designed to attract attention. We guarantee that they will grab all the eyeballs you need. Use our banner PowerPoint templates and PPT Slides will make you look like a winner.
Four Icons For Scorecard Performance Management Powerpoint Template
Our above template has been designed with four circles and icons This PowerPoint template is suitable to present scorecard performance management. Use this business diagram to present your work in a more smart and precise manner.
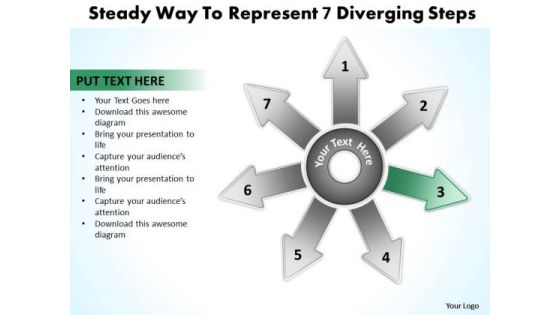
Steady Way To Represent 7 Diverging Steps Circular Chart PowerPoint Slides
We present our steady way to represent 7 diverging steps Circular Chart PowerPoint Slides.Present our Business PowerPoint Templates because spell out your advertising plans to increase market share. The feedback has been positive and productive. Download and present our Shapes PowerPoint Templates because you can Raise your Company stocks at the Opening Bell. Download our Success PowerPoint Templates because the success of your venture depends on the performance of every team member. Use our Process and Flows PowerPoint Templates because you should explain the process by which you intend to right it. Present our Arrows PowerPoint Templates because you know what it takes to keep it fit and healthy.Use these PowerPoint slides for presentations relating to Arrow, Background, Center, Chart, Clip, Communication, Competition, Computer, Concept, Connect, Connection, Diagram, Direction, Group, Illustration, Information, Network, Process, Progress, Purpose, Strategy, Symbol, Target. The prominent colors used in the PowerPoint template are Green dark , Gray, White. People tell us our steady way to represent 7 diverging steps Circular Chart PowerPoint Slides are Handsome. People tell us our Computer PowerPoint templates and PPT Slides are Precious. The feedback we get is that our steady way to represent 7 diverging steps Circular Chart PowerPoint Slides are Detailed. Presenters tell us our Communication PowerPoint templates and PPT Slides are Appealing. Customers tell us our steady way to represent 7 diverging steps Circular Chart PowerPoint Slides are Glamorous. The feedback we get is that our Computer PowerPoint templates and PPT Slides are Precious.

3 Steps Converging Arrow Process Layout Circular Diagram PowerPoint Templates
We present our 3 steps converging arrow process layout Circular Diagram PowerPoint templates.Use our Flow Charts PowerPoint Templates because it helps you to satiate the brains of your team with a taste of the final product. Download and present our Business PowerPoint Templates because project your ideas to you colleagues and complete the full picture. Use our Shapes PowerPoint Templates because you can Ring them out loud with your brilliant ideas. Use our Success PowerPoint Templates because your quest has taken you well onto the path of success. Present our Arrows PowerPoint Templates because you have the people in place, selected the team leaders and all are raring to go.Use these PowerPoint slides for presentations relating to Arrow, Business, Chart, Circular, Concept, Diagram, Informative, Internet, Market, Marketing, Member, Performance, Process, Profit, Profitable, Project, Refer, Referral, Referring, Revenue, Socialize, Steps, Strategy, Web, Websites. The prominent colors used in the PowerPoint template are Blue light, White, Gray. People tell us our 3 steps converging arrow process layout Circular Diagram PowerPoint templates are readymade to fit into any presentation structure. Customers tell us our Informative PowerPoint templates and PPT Slides are Majestic. People tell us our 3 steps converging arrow process layout Circular Diagram PowerPoint templates are Fancy. Professionals tell us our Concept PowerPoint templates and PPT Slides are Chic. Customers tell us our 3 steps converging arrow process layout Circular Diagram PowerPoint templates will impress their bosses and teams. Use our Chart PowerPoint templates and PPT Slides are Efficacious.
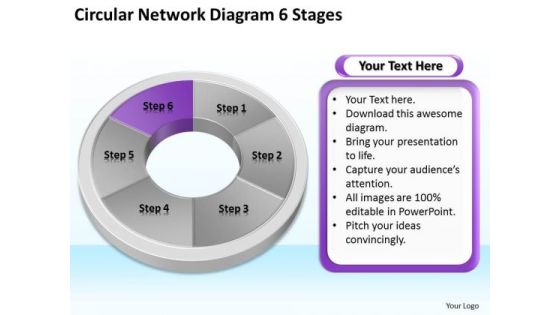
Circular Network Diagram 6 Stages Business Plan PowerPoint Slides
We present our circular network diagram 6 stages business plan PowerPoint Slides.Download our Circle Charts PowerPoint Templates because You have a driving passion to excel in your field. Our PowerPoint Templates and Slides will prove ideal vehicles for your ideas. Download our Business PowerPoint Templates because Our PowerPoint Templates and Slides are created with admirable insight. Use them and give your group a sense of your logical mind. Download and present our Process and Flows PowerPoint Templates because Our PowerPoint Templates and Slides will provide you the cutting edge. Slice through the doubts in the minds of your listeners. Present our Marketing PowerPoint Templates because Our PowerPoint Templates and Slides will fulfill your every need. Use them and effectively satisfy the desires of your audience. Present our Success PowerPoint Templates because Our PowerPoint Templates and Slides has conjured up a web of all you need with the help of our great team. Use them to string together your glistening ideas.Use these PowerPoint slides for presentations relating to Pie, chart, business, concept, success, icon, account, market, isolated, slice, economy, presentation, diagram, circle, wealth, percentage, graphic,finance, data, report, marketing, analyzing, accounting, partition, management, graph, illustration, earnings, piece, strategy, money, planning, growth, progress,profit, part, information, investment, improvement, statistic, financial, measure, six, savings, performance. The prominent colors used in the PowerPoint template are Gray, Purple, White.

Circular Network Diagram 6 Stages Business Plans That PowerPoint Slides
We present our circular network diagram 6 stages business plans that PowerPoint Slides.Download our Circle Charts PowerPoint Templates because It will Give impetus to the hopes of your colleagues. Our PowerPoint Templates and Slides will aid you in winning their trust. Download and present our Business PowerPoint Templates because It will mark the footprints of your journey. Illustrate how they will lead you to your desired destination. Download our Process and Flows PowerPoint Templates because Our PowerPoint Templates and Slides will bullet point your ideas. See them fall into place one by one. Download our Success PowerPoint Templates because You can Inspire your team with our PowerPoint Templates and Slides. Let the force of your ideas flow into their minds. Download and present our Shapes PowerPoint Templates because Our PowerPoint Templates and Slides are truly out of this world. Even the MIB duo has been keeping tabs on our team.Use these PowerPoint slides for presentations relating to Pie, chart, business, concept, success, icon, account, market, isolated, slice, economy, presentation, diagram, circle, wealth, percentage, graphic,finance, data, report, marketing, analyzing, accounting, partition, management, graph, illustration, earnings, piece, strategy, money, planning, growth, progress,profit, part, information, investment, improvement, statistic, financial, measure, six, savings, performance. The prominent colors used in the PowerPoint template are White, Gray, Yellow.
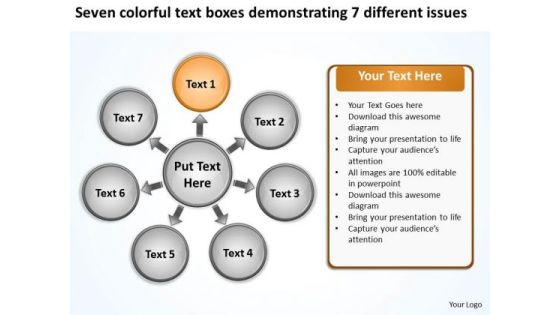
Text Boxes Demonstrating 7 Different Issues Ppt Circular Diagram PowerPoint Templates
We present our text boxes demonstrating 7 different issues ppt Circular Diagram PowerPoint templates.Download and present our Success PowerPoint Templates because iT outlines the entire thought process for the benefit of others. Tell it to the world with your characteristic aplomb. Download and present our Ring Charts PowerPoint Templates because this PPt slide helps you to measure key aspects of the current process and collect relevant data. Download our Business PowerPoint Templates because Building castles in the sand is a danger and you are aware of. You have taken the precaution of building strong fundamentals. Use our Shapes PowerPoint Templates because generation of sales is the core of any business. Download our Process and Flows PowerPoint Templates because you can Churn the wheels of the brains of your colleagues.Use these PowerPoint slides for presentations relating to Account, Arrow, Blog, Business, Chart, Description, Diagram, Illustration, Marketing, Process, Profit, Resource, Strategy, Success, Template, Trend. The prominent colors used in the PowerPoint template are Orange, Gray, White. Professionals tell us our text boxes demonstrating 7 different issues ppt Circular Diagram PowerPoint templates are Fashionable. Customers tell us our Illustration PowerPoint templates and PPT Slides are Luxuriant. Use our text boxes demonstrating 7 different issues ppt Circular Diagram PowerPoint templates are Appealing. The feedback we get is that our Blog PowerPoint templates and PPT Slides are Amazing. Professionals tell us our text boxes demonstrating 7 different issues ppt Circular Diagram PowerPoint templates are Quaint. Presenters tell us our Description PowerPoint templates and PPT Slides are incredible easy to use.

Process Workflow Diagram 2 Stages Sample Business Plan Template PowerPoint Templates
We present our process workflow diagram 2 stages sample business plan template PowerPoint templates.Download and present our Process and Flows PowerPoint Templates because You can Connect the dots. Fan expectations as the whole picture emerges. Download our Business PowerPoint Templates because our PowerPoint Templates and Slides are the string of your bow. Fire of your ideas and conquer the podium. Download and present our Marketing PowerPoint Templates because Our PowerPoint Templates and Slides will Embellish your thoughts. They will help you illustrate the brilliance of your ideas. Download and present our Success PowerPoint Templates because Our PowerPoint Templates and Slides are conceived by a dedicated team. Use them and give form to your wondrous ideas. Download our Shapes PowerPoint Templates because Your ideas provide food for thought. Our PowerPoint Templates and Slides will help you create a dish to tickle the most discerning palate.Use these PowerPoint slides for presentations relating to Accountant, accounting, analyst, annual, bank, bar, benefit, bonus, building, business, calculation, chart, company, concept, corporate, diagram, two,factor, figures, finance, financial, firm, forecast, future, gain, goal, gold, graph, grow, growth, holder, market, measure, money, numbers, office, presentation, profile,profit, progress, report, statistic, stock, succeed, success, symbol, up. The prominent colors used in the PowerPoint template are Green lime, White, Yellow.
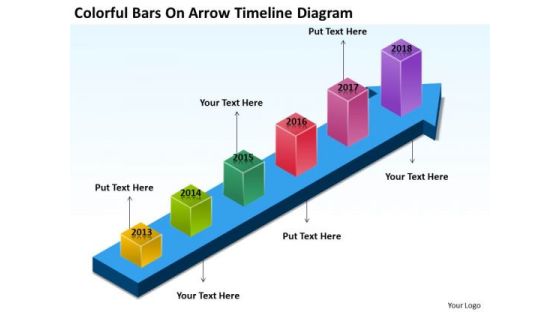
Colorful Bars On Arrow Timeline Diagram Catering Business Plan PowerPoint Templates
We present our colorful bars on arrow timeline diagram catering business plan PowerPoint templates.Present our Process and Flows PowerPoint Templates because You can Double your output with our PowerPoint Templates and Slides. They make beating deadlines a piece of cake. Use our Arrows PowerPoint Templates because Our PowerPoint Templates and Slides will let your words and thoughts hit bullseye everytime. Present our Business PowerPoint Templates because Your ideas provide food for thought. Our PowerPoint Templates and Slides will help you create a dish to tickle the most discerning palate. Use our Marketing PowerPoint Templates because Our PowerPoint Templates and Slides will provide you the cutting edge. Slice through the doubts in the minds of your listeners. Use our Success PowerPoint Templates because Our PowerPoint Templates and Slides are specially created by a professional team with vast experience. They diligently strive to come up with the right vehicle for your brilliant Ideas. Use these PowerPoint slides for presentations relating to Graph, chart, bar, growth, arrow, color,colorful,colour,colourful,market, grow, success, diagram, gain, stock, up, forecast, profile, holder, succeed, corporate, future, finance, analyst, goal,calculation, building, accounting, factor, company, progress, profit, firm, figures, statistic, financial, measure. The prominent colors used in the PowerPoint template are Purple, Pink, Blue.

Strategies For Acquiring Online And Offline Clients 2023 Trends To Increase Online Customer Acquisition Topics PDF
This slide covers digital marketing trends impacting customer acquisition rates. The highlighted industry dynamics are visual search, increased customer data collection, rising voice search shopping, and mobile-first marketing. This Performance Metrics For Project Management Office Ppt PowerPoint Presentation Complete Deck With Slides acts as backup support for your ideas, vision, thoughts, etc. Use it to present a thorough understanding of the topic. This PPT slideshow can be utilized for both in-house and outside presentations depending upon your needs and business demands. Entailing twelve slides with a consistent design and theme, this template will make a solid use case. As it is intuitively designed, it suits every business vertical and industry. All you have to do is make a few tweaks in the content or any other component to design unique presentations. The biggest advantage of this complete deck is that it can be personalized multiple times once downloaded. The color, design, shapes, and other elements are free to modify to add personal touches. You can also insert your logo design in this PPT layout. Therefore a well-thought and crafted presentation can be delivered with ease and precision by downloading this Performance Metrics For Project Management Office Ppt PowerPoint Presentation Complete Deck With Slides PPT slideshow.
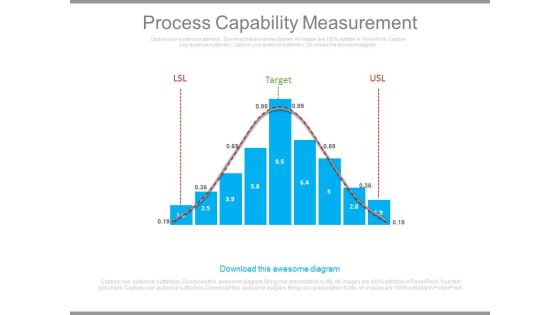
Process Capability Measurement Ppt Slides
This is a process capability measurement ppt slides. This is a nine stage process. The stages in this process are success, business.\n\n
Famous Business People On Bar Graph New PowerPoint Presentation Templates
We present our famous business people on bar graph new powerpoint presentation templates.Present our Business PowerPoint Templates because you should once Tap the ingenuity of our PowerPoint Templates and Slides. They are programmed to succeed. Present our Teamwork PowerPoint Templates because Our PowerPoint Templates and Slides will fulfill your every need. Use them and effectively satisfy the desires of your audience. Use our Success PowerPoint Templates because It will Give impetus to the hopes of your colleagues. Our PowerPoint Templates and Slides will aid you in winning their trust. Use our Flow Charts PowerPoint Templates because Our PowerPoint Templates and Slides are Clear and concise. Use them and dispel any doubts your team may have. Download our Shapes PowerPoint Templates because Our PowerPoint Templates and Slides will fulfill your every need. Use them and effectively satisfy the desires of your audience.Use these PowerPoint slides for presentations relating to 3d, abstract, achievement, bar, business, cartoon, character, chart, climb,communication, concept, goal, graph, hand, help, hold, human,humanoid, icon, idea, idiom, illustration,isolated, measure, mentor, metaphor,over, partner, partnership, person,presentation, profit, prospectus, puppet,render, report, stair, success, team,teamwork, together. The prominent colors used in the PowerPoint template are Red, White, Yellow. Professionals tell us our famous business people on bar graph new powerpoint presentation templates will save the presenter time. People tell us our achievement PowerPoint templates and PPT Slides are designed by professionals We assure you our famous business people on bar graph new powerpoint presentation templates will get their audience's attention. Presenters tell us our climb PowerPoint templates and PPT Slides will help them to explain complicated concepts. We assure you our famous business people on bar graph new powerpoint presentation templates will make the presenter successul in his career/life. PowerPoint presentation experts tell us our bar PowerPoint templates and PPT Slides are incredible easy to use.

Business Objects Strategy Management Diagram Presentation Slides
This is a business objects strategy management diagram presentation slides. This is a three stage process. The stages in this process are goals, decisions, kpis, initiatives.

Defacto Performance Management Plan Ppt Example
This is a defacto performance management plan ppt example. This is a five stage process. The stages in this process are model, goals, plan, kpis, analyze.
Top Marketing Priorities Measure Results Ppt Icon
This is a top marketing priorities measure results ppt icon. This is a four stage process. The stages in this process are arrows, success.
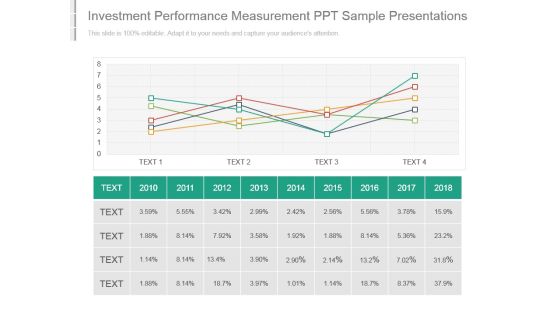
Investment Performance Measurement Ppt Sample Presentations
This is a investment performance measurement ppt sample presentations. This is a five stage process. The stages in this process are business, management, marketing, presentation, success.

Consulting Performance Measurement Ppt Slides
This is a consulting performance measurement ppt slides. This is a six stage process. The stages in this process are improve, plan, follow up, monitor, strategy, measurer.
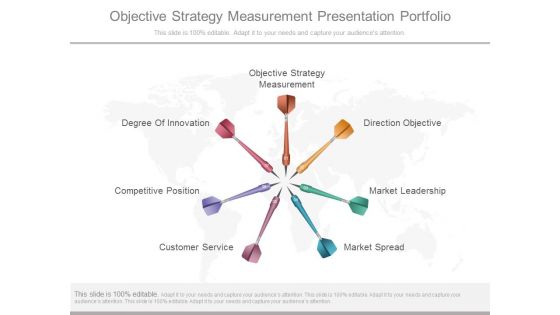
Objective Strategy Measurement Presentation Portfolio
This is a objective strategy measurement presentation portfolio. This is a seven stage process. The stages in this process are objective strategy measurement, direction objective, market leadership, market spread, customer service, competitive position, degree of innovation.

Project Performance Measurement With Revenue And Efficiency Ppt PowerPoint Presentation Infographics Elements PDF
Presenting this set of slides with name project performance measurement with revenue and efficiency ppt powerpoint presentation infographics elements pdf. This is a four stage process. The stages in this process are productivity, cost, efficiency, revenue. This is a completely editable PowerPoint presentation and is available for immediate download. Download now and impress your audience.

Agency Performance Measures Powerpoint Templates
This is a agency performance measures powerpoint templates. This is a four stage process. The stages in this process are industry snapshot, brand safety, ad fraud, viewability, tra score.
Ruler For Drawing And Measurement Powerpoint Templates
Create dynamic presentations with our professional template containing diagram of ruler. This diagram is useful to display drawing and measurement. Download this template to leave permanent impression on your audience.

Circular Arrow PowerPoint Parallel Process 3 Impacts Of Improvements Ppt Slides
We present our circular arrow powerpoint parallel process 3 impacts of improvements ppt Slides.Use our Arrows PowerPoint Templates because Our PowerPoint Templates and Slides will let you Leave a lasting impression to your audiences. They possess an inherent longstanding recall factor. Download our Marketing PowerPoint Templates because Our PowerPoint Templates and Slides will let you Leave a lasting impression to your audiences. They possess an inherent longstanding recall factor. Download and present our Business PowerPoint Templates because These PowerPoint Templates and Slides will give the updraft to your ideas. See them soar to great heights with ease. Download our Process and Flows PowerPoint Templates because You are an avid believer in ethical practices. Highlight the benefits that accrue with our PowerPoint Templates and Slides. Download and present our Success PowerPoint Templates because You are well armed with penetrative ideas. Our PowerPoint Templates and Slides will provide the gunpowder you need.Use these PowerPoint slides for presentations relating to Accounting, arrow, bar, blue, business, chart, collection, company, diagram, directive, finance, forecast, future, growth, icon, illustration, market, measure, profit, progress, statistic, stock, success. The prominent colors used in the PowerPoint template are Blue, Gray, White. People tell us our circular arrow powerpoint parallel process 3 impacts of improvements ppt Slides are second to none. Presenters tell us our blue PowerPoint templates and PPT Slides are topically designed to provide an attractive backdrop to any subject. Customers tell us our circular arrow powerpoint parallel process 3 impacts of improvements ppt Slides are specially created by a professional team with vast experience. They diligently strive to come up with the right vehicle for your brilliant Ideas. Customers tell us our collection PowerPoint templates and PPT Slides will save the presenter time. Professionals tell us our circular arrow powerpoint parallel process 3 impacts of improvements ppt Slides will help them to explain complicated concepts. Use our chart PowerPoint templates and PPT Slides will generate and maintain the level of interest you desire. They will create the impression you want to imprint on your audience.

Prospect Needs Analysis Powerpoint Slides Themes
This is a prospect needs analysis powerpoint slides themes. This is a four stage process. The stages in this process are prospect needs analysis, online market access, digital marketing, roadmap, marketing kpis, action plan.

Business Kpi Dashboard Diagram Powerpoint Templates
This is a business kpi dashboard diagram powerpoint templates. This is a six stage process. The stages in this process are analytics, cost per sales, reporting, kpis, dashboard, visualization.

Strategic Management Framework Ppt Slide Template
This is a strategic management framework ppt slide template. This is a five stage process. The stages in this process are portfolio management geographic scope market, strategic management framework, measure and scorecards, corporate business functional, competitive advantage generic strategy.
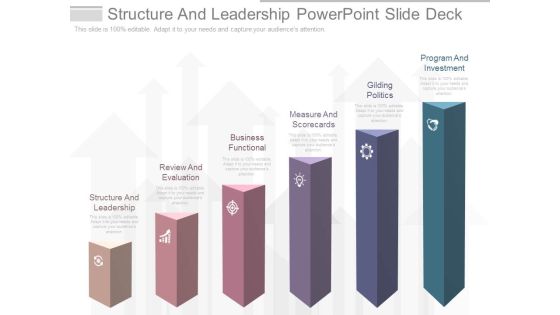
Structure And Leadership Powerpoint Slide Deck
This is a structure and leadership powerpoint slide deck. This is a six stage process. The stages in this process are structure and leadership, review and evaluation, business functional, measure and scorecards, gilding politics, program and investment.
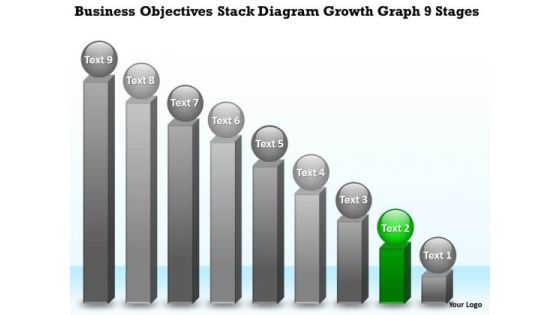
Stack Diagram Growth Graph 9 Stages Small Business Plan PowerPoint Templates
We present our stack diagram growth graph 9 stages small business plan PowerPoint templates.Download our Circle Charts PowerPoint Templates because Our PowerPoint Templates and Slides provide you with a vast range of viable options. Select the appropriate ones and just fill in your text. Download our Process and Flows PowerPoint Templates because It will Give impetus to the hopes of your colleagues. Our PowerPoint Templates and Slides will aid you in winning their trust. Present our Business PowerPoint Templates because Our PowerPoint Templates and Slides will let you Clearly mark the path for others to follow. Present our Success PowerPoint Templates because You can Be the star of the show with our PowerPoint Templates and Slides. Rock the stage with your ideas. Use our Marketing PowerPoint Templates because These PowerPoint Templates and Slides will give the updraft to your ideas. See them soar to great heights with ease.Use these PowerPoint slides for presentations relating to achievement, analyst, analyzing, arrow, aspirations, bar, bull, business, calculating, concepts, currency, development, diagram, dollar, factor, finance, financial, future, graph, graphic, growth, height, horizontal, illustration, improvement, investment, making, marketing, measuring, money, number, positivity, price, progress, savings, sign. The prominent colors used in the PowerPoint template are Green, Gray, Black.
Testing Product Performance Ppt PowerPoint Presentation Slides
This is a testing product performance ppt powerpoint presentation slides. This is a three stage process. The stage in this process are venn, business, process, circular, arrows.

Measurement Of Portfolio Analysis Ppt PowerPoint Presentation Inspiration
This is a measurement of portfolio analysis ppt powerpoint presentation inspiration. This is a seven stage process. The stages in this process are business, strategy, marketing, analysis, success, finance.
Scale With Four Business Icons Powerpoint Templates
Develop competitive advantage with our above template which contains scale diagram with four business icons. This diagram helps to display how to measure business performance. You can edit text, color, shade and style as per you need.
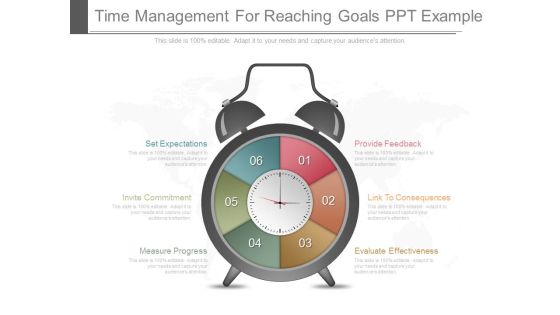
Time Management For Reaching Goals Ppt Example
This is a time management for reaching goals ppt example. This is a six stage process. The stages in this process are set expectations, invite commitment, measure progress, evaluate effectiveness, link to consequences, provide feedback.
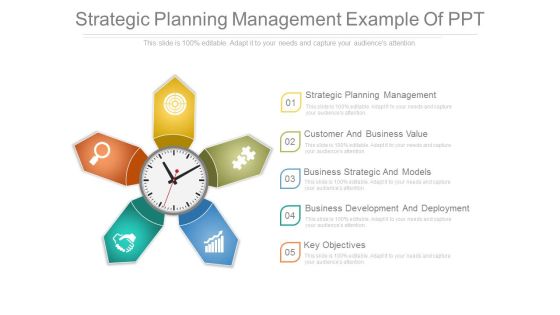
Strategic Planning Management Example Of Ppt
This is a strategic planning management example of ppt. This is a five stage process. The stages in this process are strategic planning management, customer and business value, business strategic and models, business development and deployment, key objectives.

Clock With Planning Icons Powerpoint Template
This professionally designed business diagram is as an effective tool for communicating time planning related concepts. You can also use this diagram to visually support your content. Above slide is suitable for business presentation.

Four Option Display With Clock Diagram Powerpoint Template
Time planning strategies can be displayed with this business diagram slide. This PowerPoint template contains clock diagram with four options display. Download this diagram slide to make impressive presentations.

Alarm Clock With Speed Meter Powerpoint Templates
Our above PPT slide contains graphics of alarm clock with speed meter. This PowerPoint template helps to display concept of deadlines and performance. Use this diagram to create more sound impact on viewers.
Stop Watch With Strategy Icons Powerpoint Templates
This PPT slide displays graphics of stopwatch with strategy icons. Download this PowerPoint template to depict deadlines to meet business targets. You can present your opinions using this impressive slide.
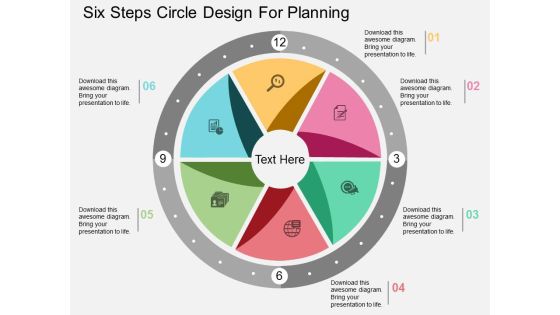
Six Steps Circle Design For Planning Powerpoint Template
This PowerPoint template has been designed with six steps circle design. Download this PPT slide to display business planning steps. Use this diagram slide to make interactive presentations.
Two Web User Element Diagram Powerpoint Template
Visually support your presentation with our above template of modern business infographic. This slide has been professionally designed to display business information. This template offers an excellent background to build impressive presentation.
 Home
Home