Success Metrics
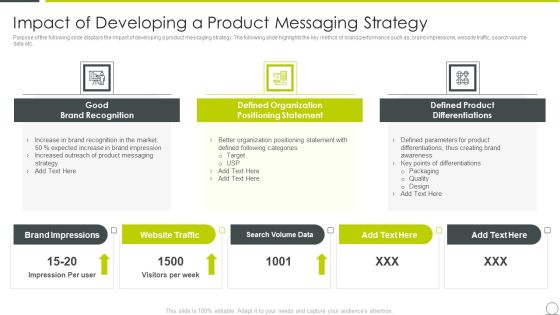
Examining Product Characteristics Brand Messaging Impact Of Developing A Product Slides PDF
Purpose of the following slide displays the impact of developing a product messaging strategy. The following slide highlights the key metrics of brand performance such as brand impressions, website traffic, search volume data etc. This is a examining product characteristics brand messaging impact of developing a product slides pdf template with various stages. Focus and dispense information on three stages using this creative set, that comes with editable features. It contains large content boxes to add your information on topics like recognition, positioning, organization, outreach, brand. You can also showcase facts, figures, and other relevant content using this PPT layout. Grab it now.

Marketing Communication Channels For Increasing Brand Awarenes Impact Of Developing A Product Introduction PDF
Purpose of the following slide displays the impact of developing a product messaging strategy. The following slide highlights the key metrics of brand performance such as brand impressions, website traffic, search volume data etc. This is a marketing communication channels for increasing brand awarenes impact of developing a product introduction pdf template with various stages. Focus and dispense information on three stages using this creative set, that comes with editable features. It contains large content boxes to add your information on topics like recognition, positioning, organization, outreach, brand. You can also showcase facts, figures, and other relevant content using this PPT layout. Grab it now.

Company Product Quarterly Sales Performance Analysis Introduction PDF
This slide depicts quarterly product sales performance which helps managers to encourage productivity and increases representatives accountability. It includes performance metrics such as average profit margin, booking, conversion rate, average sales price, win rate, total ACV and average ACV.Showcasing this set of slides titled Company Product Quarterly Sales Performance Analysis Introduction PDF. The topics addressed in these templates are Average Profit Margin, Conversion Rate. All the content presented in this PPT design is completely editable. Download it and make adjustments in color, background, font etc. as per your unique business setting.

Online Marketing Tactics To Enhance Sales Defining Kpis To Measure Social Media Performance Elements PDF
This slide focuses on metrics to measure social media performance which includes engagement rate, total reach, follower growth and customer satisfaction with frequency, responsible person and expected outcome. Presenting Online Marketing Tactics To Enhance Sales Defining Kpis To Measure Social Media Performance Elements PDF to provide visual cues and insights. Share and navigate important information on one stages that need your due attention. This template can be used to pitch topics like Frequency To Measure, Responsible Person, Kpis. In addtion, this PPT design contains high resolution images, graphics, etc, that are easily editable and available for immediate download.

Deploying B2C Social Media Defining Kpis To Measure Social Media Performance Guidelines PDF
This slide focuses on metrics to measure social media performance which includes engagement rate, total reach, follower growth and customer satisfaction with frequency, responsible person and expected outcome.Deliver and pitch your topic in the best possible manner with this Deploying B2C Social Media Defining Kpis To Measure Social Media Performance Guidelines PDF. Use them to share invaluable insights on Frequency To Measure, Responsible Person, Expected Outcome and impress your audience. This template can be altered and modified as per your expectations. So, grab it now.

Social Networking Program Defining Kpis To Measure Social Media Performance Inspiration PDF
This slide focuses on metrics to measure social media performance which includes engagement rate, total reach, follower growth and customer satisfaction with frequency, responsible person and expected outcome. Deliver and pitch your topic in the best possible manner with this Social Networking Program Defining Kpis To Measure Social Media Performance Inspiration PDF. Use them to share invaluable insights on Frequency To Measure, Responsible Person, Expected Outcome and impress your audience. This template can be altered and modified as per your expectations. So, grab it now.
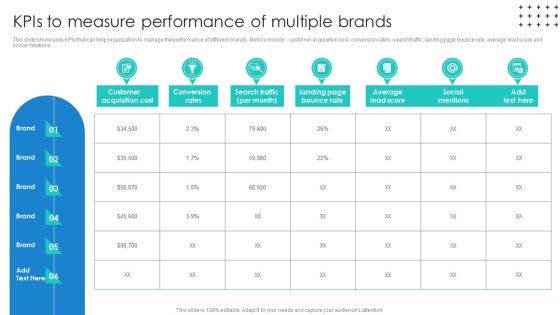
Promotional Techniques To Market Several Brands Among Target Groups Kpis To Measure Performance Mockup PDF
This slide showcases KPIs that can help organization to manage the performance of different brands. Metrics include - customer acquisition cost, conversion rates, search traffic, landing page bounce rate, average lead score and social mentions. If your project calls for a presentation, then Slidegeeks is your go-to partner because we have professionally designed, easy-to-edit templates that are perfect for any presentation. After downloading, you can easily edit Promotional Techniques To Market Several Brands Among Target Groups Kpis To Measure Performance Mockup PDF and make the changes accordingly. You can rearrange slides or fill them with different images. Check out all the handy templates

Application Performance Dashboard Ppt Icon Template PDF
This slide covers application performance in market KPIs and metrics such as impressions, clicks, searches for app, conversion rate etc. This Application Performance Dashboard Ppt Icon Template PDF from Slidegeeks makes it easy to present information on your topic with precision. It provides customization options, so you can make changes to the colors, design, graphics, or any other component to create a unique layout. It is also available for immediate download, so you can begin using it right away. Slidegeeks has done good research to ensure that you have everything you need to make your presentation stand out. Make a name out there for a brilliant performance.

Dashboard To Measure Social Media Campaign Performance One Pager Documents
This slide displays a dashboard for measuring social media campaign performance of the firm. Metrics covered are social media followers, user engaged, page likes and page impressions. Presenting you a fantastic Dashboard To Measure Social Media Campaign Performance One Pager Documents. This piece is crafted on hours of research and professional design efforts to ensure you have the best resource. It is completely editable and its design allow you to rehash its elements to suit your needs. Get this Dashboard To Measure Social Media Campaign Performance One Pager Documents A4 One-pager now.

Payroll Service Provision With Performance Measure One Pager Documents
This one pager includes provisions that for payroll service with performance metrics which are actual and standard. These measures are accuracy, timeliness , quality. Presenting you an exemplary Payroll Service Provision With Performance Measure One Pager Documents. Our one-pager comprises all the must-have essentials of an inclusive document. You can edit it with ease, as its layout is completely editable. With such freedom, you can tweak its design and other elements to your requirements. Download this Payroll Service Provision With Performance Measure One Pager Documents brilliant piece now.
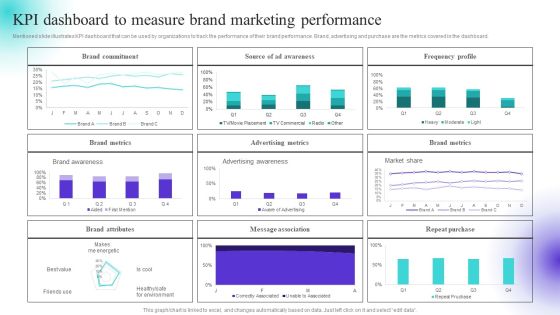
KPI Dashboard To Measure Brand Marketing Performance Inspiration PDF
Mentioned slide illustrates KPI dashboard that can be used by organizations to track the performance of their brand performance. Brand, advertising and purchase are the metrics covered in the dashboard. Boost your pitch with our creative KPI Dashboard To Measure Brand Marketing Performance Inspiration PDF. Deliver an awe inspiring pitch that will mesmerize everyone. Using these presentation templates you will surely catch everyones attention. You can browse the ppts collection on our website. We have researchers who are experts at creating the right content for the templates. So you do not have to invest time in any additional work. Just grab the template now and use them.
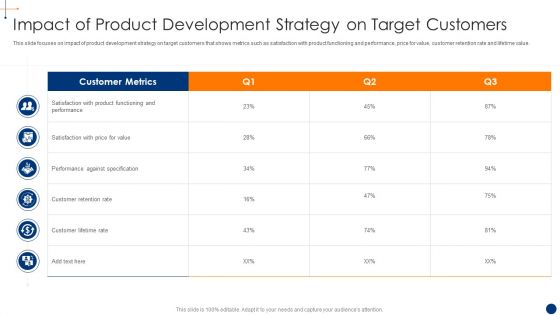
New Product Development Process Optimization Impact Of Product Development Mockup PDF
This slide focuses on impact of product development strategy on target customers that shows metrics such as satisfaction with product functioning and performance, price for value, customer retention rate and lifetime value. Deliver an awe inspiring pitch with this creative new product development process optimization impact of product development mockup pdf bundle. Topics like target customer profiling, target product evaluation, product differentiation, market access monitoring can be discussed with this completely editable template. It is available for immediate download depending on the needs and requirements of the user.

Team Performance Measurement After Agile Implementation Inspiration PDF
This slide shows team iteration metrics for the measurement of team performance based on parameters such as actual and planned velocity, planned and accepted stories, number of defects and test cases, percentage of automated tests etc. Deliver and pitch your topic in the best possible manner with this team performance measurement after agile implementation inspiration pdf. Use them to share invaluable insights on functionality, quality, velocity planned and impress your audience. This template can be altered and modified as per your expectations. So, grab it now.
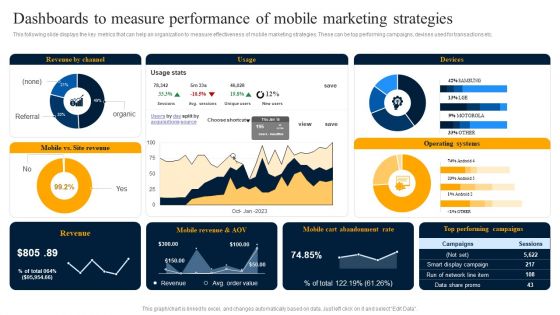
Dashboards To Measure Performance Of Mobile Marketing Strategies Rules PDF
This following slide displays the key metrics that can help an organization to measure effectiveness of mobile marketing strategies. These can be top performing campaigns, devises used for transactions etc. If your project calls for a presentation, then Slidegeeks is your go to partner because we have professionally designed, easy to edit templates that are perfect for any presentation. After downloading, you can easily edit Dashboards To Measure Performance Of Mobile Marketing Strategies Rules PDF and make the changes accordingly. You can rearrange slides or fill them with different images. Check out all the handy templates.

Dashboards To Measure Performance Of Google Shopping Ads Summary PDF
This following slide displays the key metrics that can help an organization to measure effectiveness of google shopping strategies. These can be keyword quality score, clicks and conversions etc.Want to ace your presentation in front of a live audience Our Dashboards To Measure Performance Of Google Shopping Ads Summary PDF can help you do that by engaging all the users towards you. Slidegeeks experts have put their efforts and expertise into creating these impeccable powerpoint presentations so that you can communicate your ideas clearly. Moreover, all the templates are customizable, and easy-to-edit and downloadable. Use these for both personal and commercial use.

Go To Market Approach For New Product Dashboard To Measure Sales Rep Performance Formats PDF
This slide illustrates sales representative performance measurement dashboard with key metrics such as average first contact resolution rate, occupancy rate, NPS and top agents by solved tickets.Deliver and pitch your topic in the best possible manner with this Go To Market Approach For New Product Dashboard To Measure Sales Rep Performance Formats PDF Use them to share invaluable insights on Dashboard To Measure Sales Rep Performance and impress your audience. This template can be altered and modified as per your expectations. So, grab it now.

Dashboard To Measure Business Performance Creating And Offering Multiple Product Ranges In New Business Introduction PDF
This slide illustrates a dashboard that can be used by a product manager to measure the business performance. Metrics covered in the dashboard are revenue, launches, cash flow, EPS, average revenue by product and average cost by phase.There are so many reasons you need a Dashboard To Measure Business Performance Creating And Offering Multiple Product Ranges In New Business Introduction PDF. The first reason is you can notspend time making everything from scratch, Thus, Slidegeeks has made presentation templates for you too. You can easily download these templates from our website easily.

Effective Sales Technique For New Product Launch Dashboard To Measure Sales Rep Performance Themes PDF
This slide illustrates sales representative performance measurement dashboard with key metrics such as average first contact resolution rate, occupancy rate, NPS and top agents by solved tickets.Deliver and pitch your topic in the best possible manner with this Effective Sales Technique For New Product Launch Dashboard To Measure Sales Rep Performance Themes PDF Use them to share invaluable insights on Contact Resolution, Feature Request, Promoters and impress your audience. This template can be altered and modified as per your expectations. So, grab it now.

Creating New Product Launch Campaign Strategy Dashboard To Measure Sales Rep Performance Introduction PDF
This slide illustrates sales representative performance measurement dashboard with key metrics such as average first contact resolution rate, occupancy rate, NPS and top agents by solved tickets. Make sure to capture your audiences attention in your business displays with our gratis customizable Creating New Product Launch Campaign Strategy Dashboard To Measure Sales Rep Performance Introduction PDF. These are great for business strategies, office conferences, capital raising or task suggestions. If you desire to acquire more customers for your tech business and ensure they stay satisfied, create your own sales presentation with these plain slides.
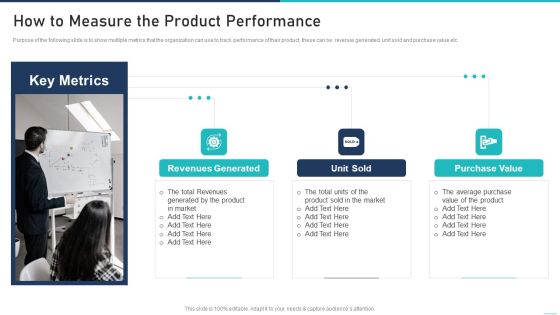
Generic Growth Playbook How To Measure The Product Performance Topics PDF
Purpose of the following slide is to show multiple metrics that the organization can use to track performance of their product, these can be revenue generated, unit sold and purchase value etc.This is a generic growth playbook how to measure the product performance topics pdf template with various stages. Focus and dispense information on three stages using this creative set, that comes with editable features. It contains large content boxes to add your information on topics like revenues generated, purchase value, generated by the product You can also showcase facts, figures, and other relevant content using this PPT layout. Grab it now.

Playbook For Sales Growth Strategies How To Measure The Product Performance Mockup PDF
Purpose of the following slide is to show multiple metrics that the organization can use to track performance of their product, these can be revenue generated, unit sold and purchase value etc. This is a Playbook For Sales Growth Strategies How To Measure The Product Performance Mockup PDF template with various stages. Focus and dispense information on three stages using this creative set, that comes with editable features. It contains large content boxes to add your information on topics like Revenues Generated, Unit Sold, Purchase Value. You can also showcase facts, figures, and other relevant content using this PPT layout. Grab it now.

Promoting Growth Internal Operations Techniques Playbook How To Measure The Product Performance Ideas PDF
Purpose of the following slide is to show multiple metrics that the organization can use to track performance of their product, these can be revenue generated, unit sold and purchase value etc. This is a Promoting Growth Internal Operations Techniques Playbook How To Measure The Product Performance Ideas PDF template with various stages. Focus and dispense information on three stages using this creative set, that comes with editable features. It contains large content boxes to add your information on topics like Unit Sold, Revenues Generated, Purchase Value. You can also showcase facts, figures, and other relevant content using this PPT layout. Grab it now.
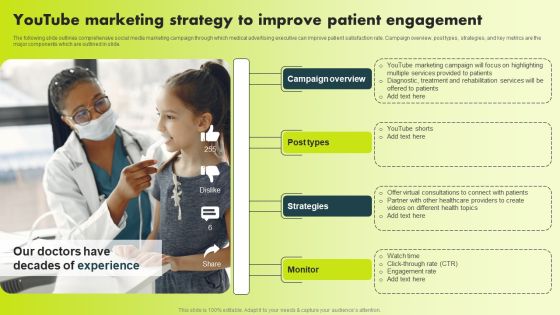
Youtube Marketing Strategy To Improve Patient Engagement Summary PDF
The following slide outlines comprehensive social media marketing campaign through which medical advertising executive can improve patient satisfaction rate. Campaign overview, post types, strategies, and key metrics are the major components which are outlined in slide. From laying roadmaps to briefing everything in detail, our templates are perfect for you. You can set the stage with your presentation slides. All you have to do is download these easy-to-edit and customizable templates. Youtube Marketing Strategy To Improve Patient Engagement Summary PDF will help you deliver an outstanding performance that everyone would remember and praise you for. Do download this presentation today.

Employee Overall Performance Progress Scorecard Sample PDF
This slide covers overall performance score of employee appraised by reporting manager. It includes scores based on metrics such as departmental performance, downtime, efficiency, setup. Utilization, quality failures as per goals, actual output etc. Pitch your topic with ease and precision using this Employee Overall Performance Progress Scorecard Sample PDF. This layout presents information on Employee Performance, Progress Scorecard. It is also available for immediate download and adjustment. So, changes can be made in the color, design, graphics or any other component to create a unique layout.
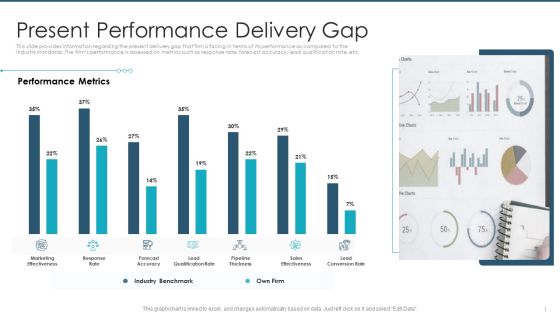
Present Performance Delivery Gap Professional PDF
This slide provides information regarding the present delivery gap that firm is facing in terms of its performance as compared to the industry standards. The firms performance is assessed on metrics such as response rate, forecast accuracy, lead qualification rate, etc. Deliver and pitch your topic in the best possible manner with this present performance delivery gap professional pdf. Use them to share invaluable insights on marketing effectiveness, response rate lead qualification rate, sales effectivenessand impress your audience. This template can be altered and modified as per your expectations. So, grab it now.

Analyzing Present Performance Delivery Gap Information PDF
This slide provides information regarding the present delivery gap that firm is facing in terms of its performance as compared to the industry standards. The firms performance is assessed on metrics such as response rate, forecast accuracy, lead qualification rate, etc. This is a analyzing present performance delivery gap information pdf template with various stages. Focus and dispense information on three stages using this creative set, that comes with editable features. It contains large content boxes to add your information on topics like marketing effectiveness, lead conversion rate, response rate . You can also showcase facts, figures, and other relevant content using this PPT layout. Grab it now.

Call Center Performance KPI Dashboard Formats PDF
This slide covers contact center performance metrics KPI dashboard. It involves details such as number of total calls, average answer speed, abandon rate, data of agents performance and call abandon rate by departments. Showcasing this set of slides titled Call Center Performance KPI Dashboard Formats PDF. The topics addressed in these templates are Department, Dashboard, Agreement Limits. All the content presented in this PPT design is completely editable. Download it and make adjustments in color, background, font etc. as per your unique business setting.

Performance Kpi Dashboard To Analyze Instagram Marketing Strategy Performance Introduction PDF
The following slide outlines KPI metrics dashboard of instagram video marketing. The kpis covered in the slide are followers, engagement, likes, comments, impressions, reach, video views and saves. The best PPT templates are a great way to save time, energy, and resources. Slidegeeks have 100 percent editable powerpoint slides making them incredibly versatile. With these quality presentation templates, you can create a captivating and memorable presentation by combining visually appealing slides and effectively communicating your message. Download Performance Kpi Dashboard To Analyze Instagram Marketing Strategy Performance Introduction PDF from Slidegeeks and deliver a wonderful presentation.

Value Based Merchant Performance Oversight Ideas PDF
The purpose of this slide is to outline the guidelines for value-based performance ranking on certain metrics based on vendor category. Certain vendor types include strategic, tactical, operational and commodity. Presenting Value Based Merchant Performance Oversight Ideas PDF to dispense important information. This template comprises four stages. It also presents valuable insights into the topics including Operational Vendor, Commodity Vendor, Tactical Vendor. This is a completely customizable PowerPoint theme that can be put to use immediately. So, download it and address the topic impactfully.

Product Development Status Icon With Bulb Ideas PDF
The following slide showcases dashboard that helps to track key performance indicators of product development. Key metrics covered overall progress, planning, design, development, testing, risks, summary, average handle time, overdue tasks, upcoming deadlines and projected launch date. Showcasing this set of slides titled Product Development Status Icon With Bulb Ideas PDF. The topics addressed in these templates are Design, Development, Planning. All the content presented in this PPT design is completely editable. Download it and make adjustments in color, background, font etc. as per your unique business setting.
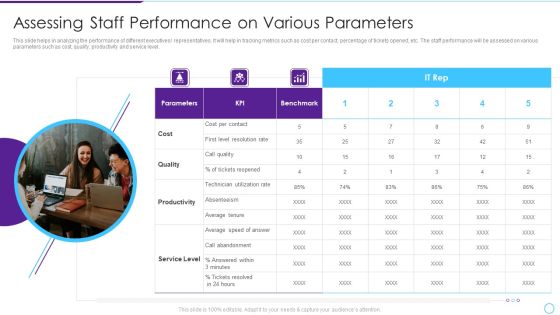
Intelligent Infrastructure Assessing Staff Performance On Various Parameters Summary PDF
This slide helps in analyzing the performance of different executives or representatives. It will help in tracking metrics such as cost per contact, percentage of tickets opened, etc. The staff performance will be assessed on various parameters such as cost, quality, productivity and service level. This is a Intelligent Infrastructure Assessing Staff Performance On Various Parameters Summary PDF template with various stages. Focus and dispense information on three stages using this creative set, that comes with editable features. It contains large content boxes to add your information on topics like Parameters, Cost, KPI, Productivity, Service Level. You can also showcase facts, figures, and other relevant content using this PPT layout. Grab it now.
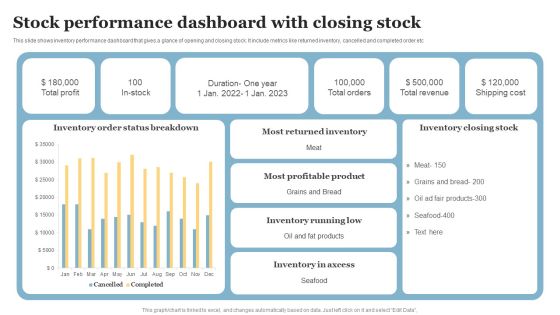
Stock Performance Dashboard With Closing Stock Diagrams PDF
This slide shows inventory performance dashboard that gives a glance of opening and closing stock. It include metrics like returned inventory, cancelled and completed order etc. Pitch your topic with ease and precision using this Stock Performance Dashboard With Closing Stock Diagrams PDF. This layout presents information on Most Returned Inventory, Most Profitable Product, Inventory Running Low. It is also available for immediate download and adjustment. So, changes can be made in the color, design, graphics or any other component to create a unique layout.

Strategies To Improve Customer Support Services Issue 1 Increasing Average Response Time Elements PDF
This slide provides an overview of major KPIs of customer service team. The metrics covered are average response time and first call resolution. From laying roadmaps to briefing everything in detail, our templates are perfect for you. You can set the stage with your presentation slides. All you have to do is download these easy to edit and customizable templates. Strategies To Improve Customer Support Services Issue 1 Increasing Average Response Time Elements PDF will help you deliver an outstanding performance that everyone would remember and praise you for. Do download this presentation today.
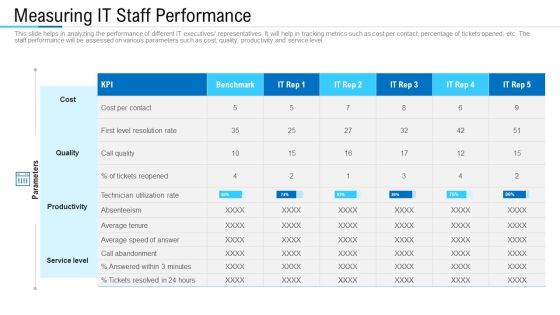
Information Technology Facility Flow Administration Measuring IT Staff Performance Structure PDF
This slide helps in analyzing the performance of different IT executives or representatives. It will help in tracking metrics such as cost per contact, percentage of tickets opened, etc. The staff performance will be assessed on various parameters such as cost, quality, productivity and service level. Deliver an awe-inspiring pitch with this creative information technology facility flow administration measuring it staff performance structure pdf bundle. Topics like cost, quality, productivity, service level can be discussed with this completely editable template. It is available for immediate download depending on the needs and requirements of the user.

Information Technology Facilities Governance Measuring IT Staff Performance Ppt Infographic Template Graphics Download PDF
This slide helps in analyzing the performance of different IT executives representatives. It will help in tracking metrics such as cost per contact, percentage of tickets opened, etc. The staff performance will be assessed on various parameters such as cost, quality, productivity and service level. Deliver and pitch your topic in the best possible manner with this information technology facilities governance measuring IT staff performance ppt infographic template graphics download pdf. Use them to share invaluable insights on cost per contact, productivity, service level, technician, parameters and impress your audience. This template can be altered and modified as per your expectations. So, grab it now.
Impeccable Information Technology Facility Measuring IT Staff Performance Ppt Icon Design Templates PDF
This slide helps in analyzing the performance of different IT executives or representatives. It will help in tracking metrics such as cost per contact, percentage of tickets opened, etc. The staff performance will be assessed on various parameters such as cost, quality, productivity and service level. Deliver an awe-inspiring pitch with this creative impeccable information technology facility measuring it staff performance ppt icon design templates pdf bundle. Topics like service level, productivity, quality, cost can be discussed with this completely editable template. It is available for immediate download depending on the needs and requirements of the user.
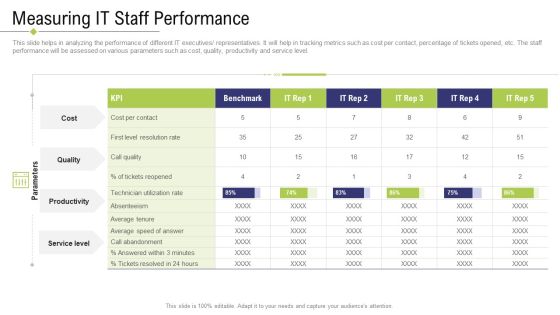
Technology Facility Maintenance And Provider Measuring IT Staff Performance Guidelines PDF
This slide helps in analyzing the performance of different IT executives representatives. It will help in tracking metrics such as cost per contact, percentage of tickets opened, etc. The staff performance will be assessed on various parameters such as cost, quality, productivity and service level. Deliver an awe inspiring pitch with this creative technology facility maintenance and provider measuring IT staff performance guidelines pdf bundle. Topics like cost per contact, parameters, productivity, service level, technician utilization rate can be discussed with this completely editable template. It is available for immediate download depending on the needs and requirements of the user.

Inspecting Sales Optimization Areas Sales Analysis Dashboard To Measure Performance Demonstration PDF
This slide showcases a dashboard presenting various metrics to measure and analyze sales performance for revenue growth. It includes key components such as number of annual new customer, sales revenue, customer satisfaction, customer acquisition cost, product wise sales, month wise sales and sales comparison. From laying roadmaps to briefing everything in detail, our templates are perfect for you. You can set the stage with your presentation slides. All you have to do is download these easy-to-edit and customizable templates. Inspecting Sales Optimization Areas Sales Analysis Dashboard To Measure Performance Demonstration PDF will help you deliver an outstanding performance that everyone would remember and praise you for. Do download this presentation today.

Lean Operational Excellence Strategy Manufacturing Dashboard To Check Production System Efficiency Pictures PDF
This slide showcases manufacturing dashboard to track KPIs defined under lean and kaizen process improvement plans. Key performance metrics included here are TEEP, OEE, loading time, production quality, losses by hours, losses by categories etc. Pitch your topic with ease and precision using this Lean Operational Excellence Strategy Manufacturing Dashboard To Check Production System Efficiency Pictures PDF. This layout presents information on Loading, Availability, Performance. It is also available for immediate download and adjustment. So, changes can be made in the color, design, graphics or any other component to create a unique layout.
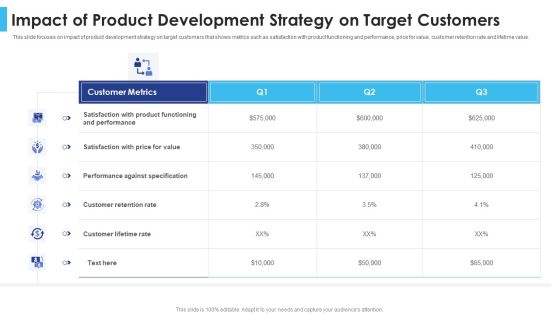
Satisfying Consumers Through Strategic Product Building Plan Impact Of Product Development Strategy Topics PDF
This slide focuses on impact of product development strategy on target customers that shows metrics such as satisfaction with product functioning and performance, price for value, customer retention rate and lifetime value. Deliver an awe inspiring pitch with this creative satisfying consumers through strategic product building plan impact of product development strategy topics pdf bundle. Topics like impact of product development strategy on target customers can be discussed with this completely editable template. It is available for immediate download depending on the needs and requirements of the user.

QA Modification For Product Quality Development And Consumer Satisfaction Implement Code Quality Brochure PDF
This slide shows the details about Code Quality Measurements Approach for Effective QA Transformation along with details on Software Quality Indicators and Test Metrics such as Reliability, Security, Testability, Rate of Delivery etc. Presenting qa modification for product quality development and consumer satisfaction implement code quality brochure pdf to provide visual cues and insights. Share and navigate important information on seven stages that need your due attention. This template can be used to pitch topics like reliability, performance efficiency, security, maintainability, rate of delivery. In addtion, this PPT design contains high resolution images, graphics, etc, that are easily editable and available for immediate download.

Best Techniques To Enhance New Product Management Efficiency Impact Of Product Development Introduction PDF
This slide focuses on impact of product development strategy on target customers that shows metrics such as satisfaction with product functioning and performance, price for value, customer retention rate and lifetime value. Presenting best techniques to enhance new product management efficiency how to create product demonstration pdf to provide visual cues and insights. Share and navigate important information on three stages that need your due attention. This template can be used to pitch topics like impact of product development strategy on target customers. In addtion, this PPT design contains high resolution images, graphics, etc, that are easily editable and available for immediate download.

Performance KPI Dashboard To Analyze Healthcare Marketing Strategies Performance Elements PDF
The following slide showcases a comprehensive dashboard which can be used to evaluate the effectiveness of marketing strategies. The key metrics are total searches, brand mentions, customer value, total spending on advertisement etc. If your project calls for a presentation, then Slidegeeks is your go to partner because we have professionally designed, easy to edit templates that are perfect for any presentation. After downloading, you can easily edit Performance KPI Dashboard To Analyze Healthcare Marketing Strategies Performance Elements PDF and make the changes accordingly. You can rearrange slides or fill them with different images. Check out all the handy templates.

Dashboard To Track And Analyse Change Management Training Kpis Ppt PowerPoint Presentation File Gallery PDF
This slide represents the KPI dashboard to track and monitor the effectiveness of change management training program conducted by the organization. It includes key metrics such as active employees, no.of trainings, cost etc. From laying roadmaps to briefing everything in detail, our templates are perfect for you. You can set the stage with your presentation slides. All you have to do is download these easy to edit and customizable templates. Dashboard To Track And Analyse Change Management Training Kpis Ppt PowerPoint Presentation File Gallery PDF will help you deliver an outstanding performance that everyone would remember and praise you for. Do download this presentation today.

Cyber Protection Kpis To Track Actual And Expected Performance Structure PDF
This slide shows various metrics to measure cyber protection level of company. These key performance indicators are level of preparedness, intrusion attempts, days to patch, incidents reported, etc. Pitch your topic with ease and precision using this Cyber Protection Kpis To Track Actual And Expected Performance Structure PDF. This layout presents information on Cyber Protection Kpis, Track Actual Expected Performance. It is also available for immediate download and adjustment. So, changes can be made in the color, design, graphics or any other component to create a unique layout.

Performance Indicators For Strategic Resource Evaluation Icons PDF
This slide provides an overview of the various sourcing performance metrics used to analyze and measure the status. Major KPIs covered are purchase order cycle time, inventory turnover, total supply chain cost, number of suppliers and supplier lead time. Showcasing this set of slides titled Performance Indicators For Strategic Resource Evaluation Icons PDF. The topics addressed in these templates are Purchasing, Supply Chain Management, Vendor Management. All the content presented in this PPT design is completely editable. Download it and make adjustments in color, background, font etc. as per your unique business setting.
Planning Sales Campaign To Improve Understanding Qualification Criteria For Prospective Icons PDF
This slide provides glimpse about creating and setting criteria that can help the business to qualify the prospective leads. It includes metrics such as good fit, interest, purchase capability, significance, etc. From laying roadmaps to briefing everything in detail, our templates are perfect for you. You can set the stage with your presentation slides. All you have to do is download these easy-to-edit and customizable templates. Planning Sales Campaign To Improve Understanding Qualification Criteria For Prospective Icons PDF will help you deliver an outstanding performance that everyone would remember and praise you for. Do download this presentation today.
Google Keyword Assessment KPI Dashboard For Tracking Improvement In Website Traffic Infographics PDF
Following slide demonstrates keyword analysis dashboard which can be used by business to track website traffic performance. It includes metrics such as average keyword position, keyword ranking distribution, keyword ranking, keyword in top 3, top 10, top 20 and top 100. Showcasing this set of slides titled Google Keyword Assessment KPI Dashboard For Tracking Improvement In Website Traffic Infographics PDF. The topics addressed in these templates are Keyword Ranking, Keyword Ranking Distribution, Average Keyword Position. All the content presented in this PPT design is completely editable. Download it and make adjustments in color, background, font etc. as per your unique business setting.

Customer Support Services Track Kpis To Evaluate Team Performance Icons PDF
The following slide depicts key metrics to evaluate support team performance. Major KPIs covered are customer satisfaction score, first contact resolution, employee engagement and negative response rate. Create an editable Customer Support Services Track Kpis To Evaluate Team Performance Icons PDF that communicates your idea and engages your audience. Whether youre presenting a business or an educational presentation, pre-designed presentation templates help save time. Customer Support Services Track Kpis To Evaluate Team Performance Icons PDF is highly customizable and very easy to edit, covering many different styles from creative to business presentations. Slidegeeks has creative team members who have crafted amazing templates. So, go and get them without any delay.

Action Plan To Enhance Client Service Track Kpis To Evaluate Team Performance Download PDF
The following slide depicts key metrics to evaluate support team performance. Major KPIs covered are customer satisfaction score, first contact resolution, employee engagement and negative response rate From laying roadmaps to briefing everything in detail, our templates are perfect for you. You can set the stage with your presentation slides. All you have to do is download these easy to edit and customizable templates. Action Plan To Enhance Client Service Track Kpis To Evaluate Team Performance Download PDF will help you deliver an outstanding performance that everyone would remember and praise you for. Do download this presentation today.
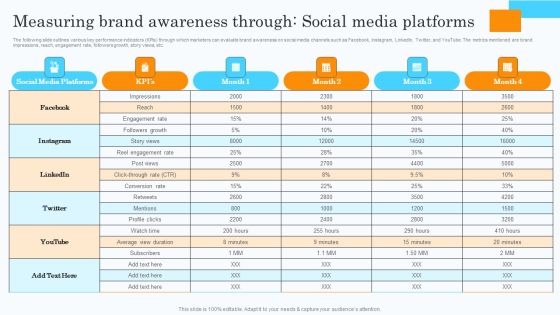
Market Research Assessment Of Target Market Requirements Measuring Brand Awareness Through Social Media Download PDF
The following slide outlines various key performance indicators KPIs through which marketers can evaluate brand awareness on social media channels such as Facebook, Instagram, LinkedIn, Twitter, and YouTube. The metrics mentioned are brand impressions, reach, engagement rate, followers growth, story views, etc. Find a pre designed and impeccable Market Research Assessment Of Target Market Requirements Measuring Brand Awareness Through Social Media Download PDF. The templates can ace your presentation without additional effort. You can download these easy to edit presentation templates to make your presentation stand out from others. So, what are you waiting for Download the template from Slidegeeks today and give a unique touch to your presentation.
Steps To Effectively Conduct Market Research Measuring Brand Awareness Through Social Media Platforms Icons PDF
The following slide outlines various key performance indicators KPIs through which marketers can evaluate brand awareness on social media channels such as Facebook, Instagram, LinkedIn, Twitter, and YouTube. The metrics mentioned are brand impressions, reach, engagement rate, followers growth, story views, etc. Find a pre designed and impeccable Steps To Effectively Conduct Market Research Measuring Brand Awareness Through Social Media Platforms Icons PDF. The templates can ace your presentation without additional effort. You can download these easy to edit presentation templates to make your presentation stand out from others. So, what are you waiting for Download the template from Slidegeeks today and give a unique touch to your presentation.
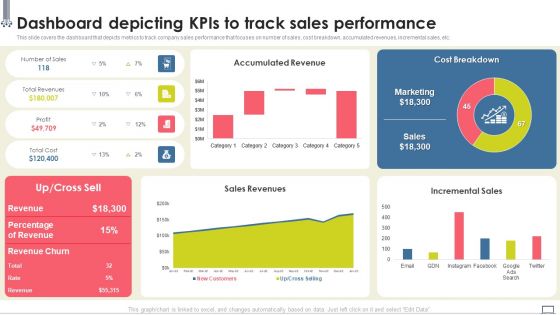
Change Management Strategy Dashboard Depicting Kpis To Track Sales Performance Ideas PDF
This slide covers the dashboard that depicts metrics to track company sales performance that focuses on number of sales, cost breakdown, accumulated revenues, incremental sales, etc. From laying roadmaps to briefing everything in detail, our templates are perfect for you. You can set the stage with your presentation slides. All you have to do is download these easy-to-edit and customizable templates. Change Management Strategy Dashboard Depicting Kpis To Track Sales Performance Ideas PDF will help you deliver an outstanding performance that everyone would remember and praise you for. Do download this presentation today.

Transition Plan For Business Management Dashboard Depicting Kpis To Track Sales Performance Template PDF
This slide covers the dashboard that depicts metrics to track company sales performance that focuses on number of sales, cost breakdown, accumulated revenues, incremental sales, etc. From laying roadmaps to briefing everything in detail, our templates are perfect for you. You can set the stage with your presentation slides. All you have to do is download these easy-to-edit and customizable templates. Transition Plan For Business Management Dashboard Depicting Kpis To Track Sales Performance Template PDF will help you deliver an outstanding performance that everyone would remember and praise you for. Do download this presentation today.

Service Promotion Plan Kpis To Monitor Quarterly Marketing Performance Diagrams PDF
This slide shows various metrics which can be used by marketing manager to track performance. These key performance indicators are customer acquisition cost, sales growth, new leads, website traffic, etc. Make sure to capture your audiences attention in your business displays with our gratis customizable Service Promotion Plan Kpis To Monitor Quarterly Marketing Performance Diagrams PDF. These are great for business strategies, office conferences, capital raising or task suggestions. If you desire to acquire more customers for your tech business and ensure they stay satisfied, create your own sales presentation with these plain slides.

Change Management Process Dashboard Depicting Kpis To Track Sales Performance Introduction PDF
This slide covers the dashboard that depicts metrics to track company sales performance that focuses on number of sales, cost breakdown, accumulated revenues, incremental sales, etc. From laying roadmaps to briefing everything in detail, our templates are perfect for you. You can set the stage with your presentation slides. All you have to do is download these easy-to-edit and customizable templates. Change Management Process Dashboard Depicting Kpis To Track Sales Performance Introduction PDF will help you deliver an outstanding performance that everyone would remember and praise you for. Do download this presentation today.

Enhancing Client Experience Track Kpis To Evaluate Team Performance Rules PDF
The following slide depicts key metrics to evaluate support team performance. Major KPIs covered are customer satisfaction score, first contact resolution, employee engagement and negative response rate. Make sure to capture your audiences attention in your business displays with our gratis customizable Enhancing Client Experience Track Kpis To Evaluate Team Performance Rules PDF. These are great for business strategies, office conferences, capital raising or task suggestions. If you desire to acquire more customers for your tech business and ensure they stay satisfied, create your own sales presentation with these plain slides.
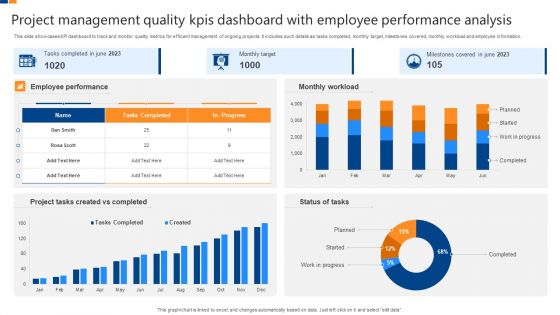
Project Management Quality Kpis Dashboard With Employee Performance Analysis Professional PDF
This slide showcases KPI dashboard to track and monitor quality metrics for efficient management of ongoing projects. It includes such details as tasks completed, monthly target, milestones covered, monthly workload and employee information. Showcasing this set of slides titled Project Management Quality Kpis Dashboard With Employee Performance Analysis Professional PDF. The topics addressed in these templates are Employee Performance, Monthly Workload, Milestones Covered, Monthly Target, Project Tasks Created Completed. All the content presented in this PPT design is completely editable. Download it and make adjustments in color, background, font etc. as per your unique business setting.
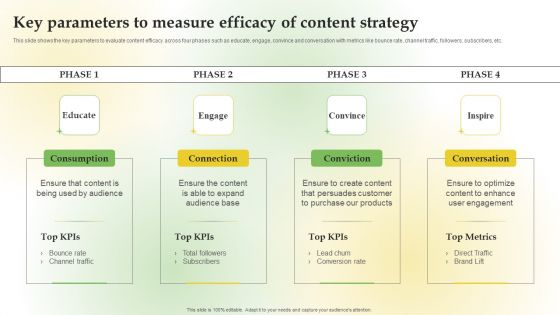
Content Marketing Applications For Nurturing Leads Key Parameters Measure Efficacy Content Strategy Sample PDF
This slide shows the key parameters to evaluate content efficacy across four phases such as educate, engage, convince and conversation with metrics like bounce rate, channel traffic, followers, subscribers, etc. From laying roadmaps to briefing everything in detail, our templates are perfect for you. You can set the stage with your presentation slides. All you have to do is download these easy to edit and customizable templates. Content Marketing Applications For Nurturing Leads Key Parameters Measure Efficacy Content Strategy Sample PDF will help you deliver an outstanding performance that everyone would remember and praise you for. Do download this presentation today.
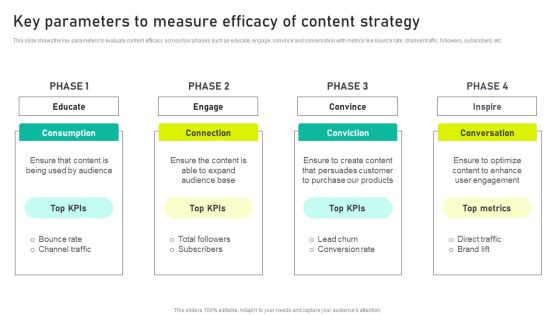
Key Parameters To Measure Efficacy Of Content Strategy Ppt Pictures Graphic Images PDF
This slide shows the key parameters to evaluate content efficacy across four phases such as educate, engage, convince and conversation with metrics like bounce rate, channel traffic, followers, subscribers, etc. From laying roadmaps to briefing everything in detail, our templates are perfect for you. You can set the stage with your presentation slides. All you have to do is download these easy to edit and customizable templates. Key Parameters To Measure Efficacy Of Content Strategy Ppt Pictures Graphic Images PDF will help you deliver an outstanding performance that everyone would remember and praise you for. Do download this presentation today.

Measure Lead Conversion Rate With Its Impact Ppt Portfolio Example PDF
The following slide covers the conversion rate metrics to compare and contrast performance. It includes elements such as description, affecting factors, preference, impact, strategies, formula etc. to get more value from customers. The best PPT templates are a great way to save time, energy, and resources. Slidegeeks have 100 percent editable powerpoint slides making them incredibly versatile. With these quality presentation templates, you can create a captivating and memorable presentation by combining visually appealing slides and effectively communicating your message. Download Measure Lead Conversion Rate With Its Impact Ppt Portfolio Example PDF from Slidegeeks and deliver a wonderful presentation.
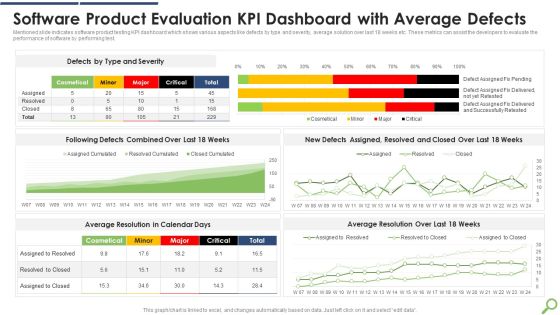
Software Product Evaluation KPI Dashboard With Average Defects Infographics PDF
Mentioned slide indicates software product testing KPI dashboard which shows various aspects like defects by type and severity, average solution over last 18 weeks etc. These metrics can assist the developers to evaluate the performance of software by performing test.Showcasing this set of slides titled Software Product Evaluation KPI Dashboard With Average Defects Infographics PDF The topics addressed in these templates are Software Product, Evaluation Dashboard, Average Defects All the content presented in this PPT design is completely editable. Download it and make adjustments in color, background, font etc. as per your unique business setting.
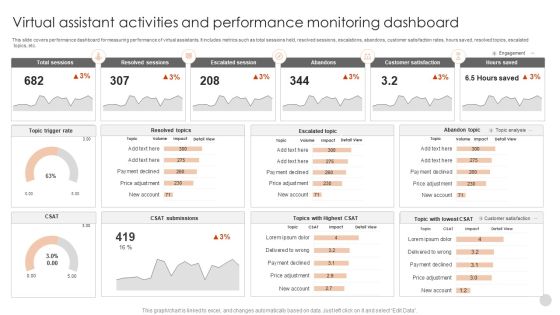
Virtual Assistant Activities And Performance Monitoring Dashboard Guidelines PDF
This slide covers performance dashboard for measuring performance of virtual assistants. It includes metrics such as total sessions held, resolved sessions, escalations, abandons, customer satisfaction rates, hours saved, resolved topics, escalated topics, etc.Pitch your topic with ease and precision using this Virtual Assistant Activities And Performance Monitoring Dashboard Guidelines PDF. This layout presents information on Total Sessions, Resolved Sessions, Escalated Session. It is also available for immediate download and adjustment. So, changes can be made in the color, design, graphics or any other component to create a unique layout.

Merchant Performance Report With Rating And Status Diagrams PDF
The purpose of this slide is to measure the performance and effectiveness of vendors and suppliers who provides goods or services to the company. Certain metrics include quality, delivery, cost, local factors, and order count. Showcasing this set of slides titled Merchant Performance Report With Rating And Status Diagrams PDF. The topics addressed in these templates are Merchant Performance Report, Rating And Status. All the content presented in this PPT design is completely editable. Download it and make adjustments in color, background, font etc. as per your unique business setting.
Online Ad Campaign Performance Tracking Dashboard Demonstration PDF
This slide covers the KPI dashboard for measuring digital campaign results. It includes metrics such as Ad cost, clicks, impressions, CTR, cost per click, conversions, conversion rate, cost per click, cost per thousand impressions, etc. Deliver and pitch your topic in the best possible manner with this Online Ad Campaign Performance Tracking Dashboard Demonstration PDF. Use them to share invaluable insights on Online Ad Campaign Performance, Tracking Dashboard and impress your audience. This template can be altered and modified as per your expectations. So, grab it now.
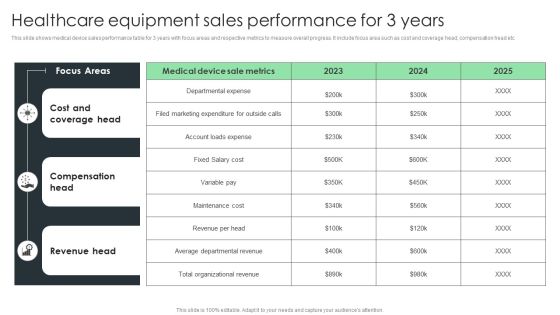
Healthcare Equipment Sales Performance For 3 Years Sample PDF
This slide shows medical device sales performance table for 3 years with focus areas and respective metrics to measure overall progress. It include focus area such as cost and coverage head, compensation head etc. Showcasing this set of slides titled Healthcare Equipment Sales Performance For 3 Years Sample PDF. The topics addressed in these templates are Cost Coverage Head, Compensation Head, Revenue Head. All the content presented in this PPT design is completely editable. Download it and make adjustments in color, background, font etc. as per your unique business setting.
Monthly Sales Performance Tracking And Monitoring Dashboard Diagrams PDF
This slide showcases a dashboard presenting various metrics to measure and analyze sales performance for revenue growth. It includes key components such as number of sales, revenue, profit, cost, sales revenue, sales increment, cost analysis and cross sell. Make sure to capture your audiences attention in your business displays with our gratis customizable Monthly Sales Performance Tracking And Monitoring Dashboard Diagrams PDF. These are great for business strategies, office conferences, capital raising or task suggestions. If you desire to acquire more customers for your tech business and ensure they stay satisfied, create your own sales presentation with these plain slides.
Monthly Sales Performance Tracking And Monitoring Dashboard Designs PDF
This slide showcases a dashboard presenting various metrics to measure and analyze sales performance for revenue growth. It includes key components such as number of sales, revenue, profit, cost, sales revenue, sales increment, cost analysis and cross sell. Make sure to capture your audiences attention in your business displays with our gratis customizable Monthly Sales Performance Tracking And Monitoring Dashboard Designs PDF. These are great for business strategies, office conferences, capital raising or task suggestions. If you desire to acquire more customers for your tech business and ensure they stay satisfied, create your own sales presentation with these plain slides.

E Mail Marketing Performance Goals Achieved Survey Analysis Sample PDF
The purpose of this slide is to illustrate the survey outcomes in order to measure the effectiveness of e-mail campaigns. Certain metrics include an increase in ROI, conversions, list growth, etc. Pitch your topic with ease and precision using this E Mail Marketing Performance Goals Achieved Survey Analysis Sample PDF. This layout presents information on E Mail Marketing Performance, Goals Achieved Survey Analysis. It is also available for immediate download and adjustment. So, changes can be made in the color, design, graphics or any other component to create a unique layout.
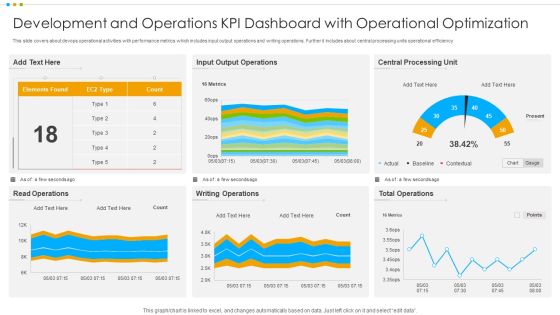
Development And Operations KPI Dashboard With Operational Optimization Pictures PDF
This slide covers about devops operational activities with performance metrics which includes input output operations and writing operations. Further it includes about central processing units operational efficiency.Pitch your topic with ease and precision using this Development And Operations KPI Dashboard With Operational Optimization Pictures PDF This layout presents information on Output Operations, Central Processing, Total Operations It is also available for immediate download and adjustment. So, changes can be made in the color, design, graphics or any other component to create a unique layout.

Go To Market Approach For New Product KPI Dashboard To Monitor Sales Performance Clipart PDF
This slide shows sales performance monitoring dashboard. Metrics included in the dashboard are sales revenue, sales growth, average revenue per unit, customer lifetime value and customer acquisition cost.Deliver and pitch your topic in the best possible manner with this Go To Market Approach For New Product KPI Dashboard To Monitor Sales Performance Clipart PDF Use them to share invaluable insights on Kpi Dashboard To Monitor Sales Performance and impress your audience. This template can be altered and modified as per your expectations. So, grab it now.

New Product Sales Strategy And Marketing KPI Dashboard To Monitor Sales Performance Information PDF
This slide shows sales performance monitoring dashboard. Metrics included in the dashboard are sales revenue, sales growth, average revenue per unit, customer lifetime value and customer acquisition cost. Deliver an awe inspiring pitch with this creative New Product Sales Strategy And Marketing KPI Dashboard To Monitor Sales Performance Information PDF bundle. Topics like Sales Revenue, Monthly Sales Growth, Sales Country Performance can be discussed with this completely editable template. It is available for immediate download depending on the needs and requirements of the user.

Offline Marketing Techniques To Elevate Brand Visibility Organization Performance Analysis Background PDF
This slide shows various KPIs which can be used organizations to evaluate annual marketing performance. It includes metrics such as brand awareness, website traffic, click through rate, lead conversion rate, etc. This Offline Marketing Techniques To Elevate Brand Visibility Organization Performance Analysis Background PDF is perfect for any presentation, be it in front of clients or colleagues. It is a versatile and stylish solution for organizing your meetings. The product features a modern design for your presentation meetings. The adjustable and customizable slides provide unlimited possibilities for acing up your presentation. Slidegeeks has done all the homework before launching the product for you. So, do not wait, grab the presentation templates today

KPI Dashboard To Monitor Beauty Care Products Sales Performance Ppt Outline Example Topics PDF
This slide shows the key performance indicators dashboard which can be used to analyze current financial position of cosmetic business. It includes metrics such as sales, expenses, profit, cash in hand, etc. Showcasing this set of slides titled KPI Dashboard To Monitor Beauty Care Products Sales Performance Ppt Outline Example Topics PDF. The topics addressed in these templates are Accounts Receivable, Profit Margin, Expense. All the content presented in this PPT design is completely editable. Download it and make adjustments in color, background, font etc. as per your unique business setting.

KPI Dashboard To Track Beauty Care Products Sales Performance Ppt Outline Pictures PDF
This slide shows the key performance indicators dashboard which can be used to analyze current financial position of cosmetic business. It includes metrics such as sales, expenses, profit, cash in hand, etc. Showcasing this set of slides titled KPI Dashboard To Track Beauty Care Products Sales Performance Ppt Outline Pictures PDF. The topics addressed in these templates are Sales Number, Total Sales, Total Profit, Cost. All the content presented in this PPT design is completely editable. Download it and make adjustments in color, background, font etc. as per your unique business setting.
Project Performance Dashboard With Tracking And Control Phase Background PDF
Following slide exhibits project performance dashboard with monitoring and control phase which can be used by project managers to review the overall project. It includes metrics like project cost performance, project performance, time vs project phase and percentage of project phase completed. Pitch your topic with ease and precision using this Project Performance Dashboard With Tracking And Control Phase Background PDF This layout presents information on Earned Value, Project Cost Performance, Project Performance. It is also available for immediate download and adjustment. So, changes can be made in the color, design, graphics or any other component to create a unique layout.

Agile Methodologies Team Performance Measurement After Agile Implementation Infographics Ppt Infographic Template Ideas PDF
This slide shows team iteration metrics for the measurement of team performance based on parameters such as actual and planned velocity, planned and accepted stories, number of defects and test cases, percentage of automated tests etc. Deliver an awe inspiring pitch with this creative agile methodologies team performance measurement after agile implementation infographics ppt infographic template ideas pdf bundle. Topics like Team Performance Measurement After Agile Implementation can be discussed with this completely editable template. It is available for immediate download depending on the needs and requirements of the user.

Matrix To Measurement Brand Performance For Small And Medium Business Introduction PDF
Mentioned slide highlights matrix which can be used by enterprise to measure brand performance. It provides information about key stakeholders and brand promises. The metrics covered in the slide are employee satisfaction, tools availability, response quality, response time etc. Pitch your topic with ease and precision using this matrix to measurement brand performance for small and medium business introduction pdf. This layout presents information on matrix to measurement brand performance for small and medium business. It is also available for immediate download and adjustment. So, changes can be made in the color, design, graphics or any other component to create a unique layout.

IT Service Incorporation And Administration Dashboard To Measure Business Performance Portrait PDF
Mentioned slide portrays a dashboard for measuring business performance. Performance metrics covered in the slide are average weekly sales revenue, average revenue per unit, customer lifetime value and customer acquisition cost. Deliver and pitch your topic in the best possible manner with this it service incorporation and administration dashboard to measure business performance portrait pdf. Use them to share invaluable insights on sales, revenue, target, acquisition cost and impress your audience. This template can be altered and modified as per your expectations. So, grab it now.
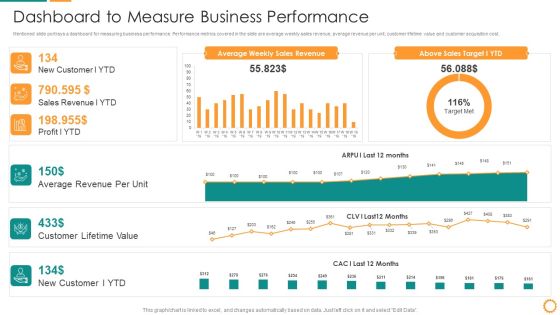
IT Consolidation Post Mergers And Acquisition Dashboard To Measure Business Performance Clipart PDF
Mentioned slide portrays a dashboard for measuring business performance. Performance metrics covered in the slide are average weekly sales revenue, average revenue per unit, customer lifetime value and customer acquisition cost. Deliver and pitch your topic in the best possible manner with this IT Consolidation Post Mergers And Acquisition Dashboard To Measure Business Performance Clipart PDF. Use them to share invaluable insights on Average Revenue, Customer Lifetime Value, Sales Revenue, Sales Target and impress your audience. This template can be altered and modified as per your expectations. So, grab it now.
Employee Performance Analysis Tracking Scorecard Ppt Summary Influencers PDF
This slide covers overall performance score of employee appraised by reporting manager. It includes scores based on metrics such as departmental performance, downtime, efficiency, setup, utilization, quality failures as per goals, actual output etc. Showcasing this set of slides titled Employee Performance Analysis Tracking Scorecard Ppt Summary Influencers PDF. The topics addressed in these templates are Employee Performance Card, Actual Performance, Goal. All the content presented in this PPT design is completely editable. Download it and make adjustments in color, background, font etc. as per your unique business setting.

Dashboard To Measure Performance Of E Commerce Marketing Strategies Structure PDF
This following slide displays the key metrics that can help an organization to measure effectiveness of e-commerce strategies. These can be revenue generated using e-commerce platform, conversion rates etc.Create an editable Dashboard To Measure Performance Of E Commerce Marketing Strategies Structure PDF that communicates your idea and engages your audience. Whether you are presenting a business or an educational presentation, pre-designed presentation templates help save time. Dashboard To Measure Performance Of E Commerce Marketing Strategies Structure PDF is highly customizable and very easy to edit, covering many different styles from creative to business presentations. Slidegeeks has creative team members who have crafted amazing templates. So, go and get them without any delay.

Analytics Dashboard To Evaluate Digital Marketing Performance Mockup PDF
The purpose of this slide is to exhibits a dashboard which can be used to examine the marketing performance. The metrics covered in the dashboard are bounce rate, page views, new sessions, total time spent on site, email marketing performance etc. Showcasing this set of slides titled Analytics Dashboard To Evaluate Digital Marketing Performance Mockup PDF. The topics addressed in these templates are Conversion Funnel, Target, Marketing Performance. All the content presented in this PPT design is completely editable. Download it and make adjustments in color, background, font etc. as per your unique business setting.

Digital Performance In Shared Business Services Back Office Functions Formats PDF
Following slide provides information regarding performance measure utilized by organizations for various back office function which benefits them to drive better productivity and efficiency. Share service center, digital performance metrics and key highlights are demonstrated in this slide. Pitch your topic with ease and precision using this Digital Performance In Shared Business Services Back Office Functions Formats PDF. This layout presents information on Volume Productivity, Service, Maturity. It is also available for immediate download and adjustment. So, changes can be made in the color, design, graphics or any other component to create a unique layout.

Content Marketing Campaign Performance Measuring Scorecard Social Media Content Icons PDF
This slide illustrates the scorecard that is being used by the organization to measure the performance of content marketing campaign. Major metrics covered are related to brand and lead.Want to ace your presentation in front of a live audience Our Content Marketing Campaign Performance Measuring Scorecard Social Media Content Icons PDF can help you do that by engaging all the users towards you. Slidegeeks experts have put their efforts and expertise into creating these impeccable powerpoint presentations so that you can communicate your ideas clearly. Moreover, all the templates are customizable, and easytoedit and downloadable. Use these for both personal and commercial use.

Developing Content Marketing Defining Content Marketing Goals And Objectives Inspiration PDF
This slide represents content marketing goals, objectives, strategies and metrics to measure performance across customer lifecycle stages such as reach, act and convert. Present like a pro with Developing Content Marketing Defining Content Marketing Goals And Objectives Inspiration PDF Create beautiful presentations together with your team, using our easy-to-use presentation slides. Share your ideas in real-time and make changes on the fly by downloading our templates. So whether youre in the office, on the go, or in a remote location, you can stay in sync with your team and present your ideas with confidence. With Slidegeeks presentation got a whole lot easier. Grab these presentations today.
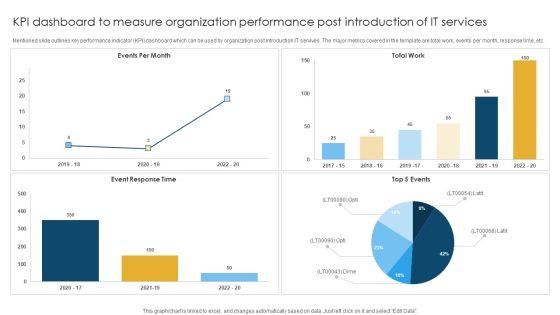
KPI Dashboard To Measure Organization Performance Post Introduction Of IT Services Rules PDF
Mentioned slide outlines key performance indicator KPI dashboard which can be used by organization post introduction IT servives. The major metrics covered in the template are total work, events per month, response time, etc. Showcasing this set of slides titled KPI Dashboard To Measure Organization Performance Post Introduction Of IT Services Rules PDF. The topics addressed in these templates are Event Response, Total Work, Events Per. All the content presented in this PPT design is completely editable. Download it and make adjustments in color, background, font etc. as per your unique business setting.
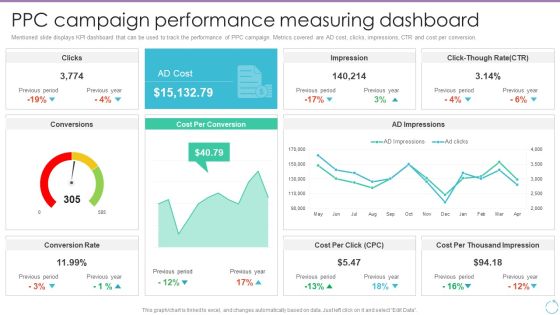
Personal Branding Plan For Executives Ppc Campaign Performance Measuring Download PDF
Mentioned slide displays KPI dashboard that can be used to track the performance of PPC campaign. Metrics covered are AD cost, clicks, impressions, CTR and cost per conversion. Take your projects to the next level with our ultimate collection of Personal Branding Plan For Executives Ppc Campaign Performance Measuring Download PDF. Slidegeeks has designed a range of layouts that are perfect for representing task or activity duration, keeping track of all your deadlines at a glance. Tailor these designs to your exact needs and give them a truly corporate look with your own brand colors theyll make your projects stand out from the rest.
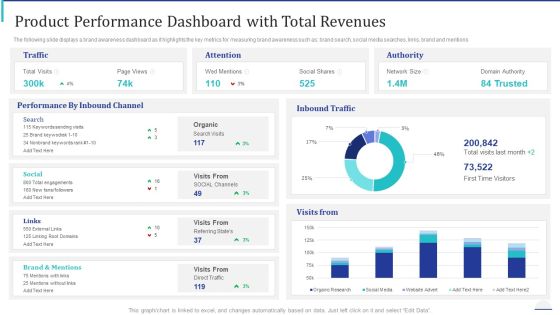
How Make Impactful Product Marketing Message Build Product Differentiation Product Performance Dashboard With Total Revenues Information PDF
The following slide displays a brand awareness dashboard as it highlights the key metrics for measuring brand awareness such as brand search, social media searches, links, brand and mentions. Deliver and pitch your topic in the best possible manner with this how make impactful product marketing message build product differentiation product performance dashboard with total revenues information pdf. Use them to share invaluable insights on social, organic, performance, traffic and impress your audience. This template can be altered and modified as per your expectations. So, grab it now.
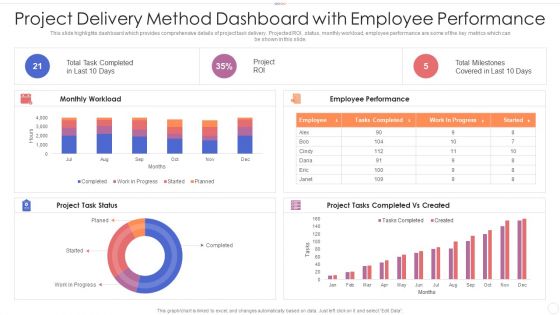
Project Delivery Method Dashboard With Employee Performance Introduction PDF
This slide highlights dashboard which provides comprehensive details of project task delivery. Projected ROI, status, monthly workload, employee performance are some of the key metrics which can be shown in this slide. Showcasing this set of slides titled project delivery method dashboard with employee performance introduction pdf. The topics addressed in these templates are project delivery method dashboard with employee performance. All the content presented in this PPT design is completely editable. Download it and make adjustments in color, background, font etc. as per your unique business setting.
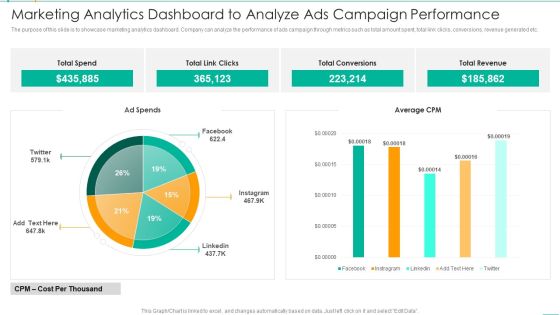
Marketing Analytics Dashboard To Analyze Ads Campaign Performance Microsoft PDF
The purpose of this slide is to showcase marketing analytics dashboard. Company can analyze the performance of ads campaign through metrics such as total amount spent, total link clicks, conversions, revenue generated etc. Showcasing this set of slides titled Marketing Analytics Dashboard To Analyze Ads Campaign Performance Microsoft PDF. The topics addressed in these templates are Marketing Analytics Dashboard To Analyze Ads Campaign Performance. All the content presented in this PPT design is completely editable. Download it and make adjustments in color, background, font etc. as per your unique business setting.
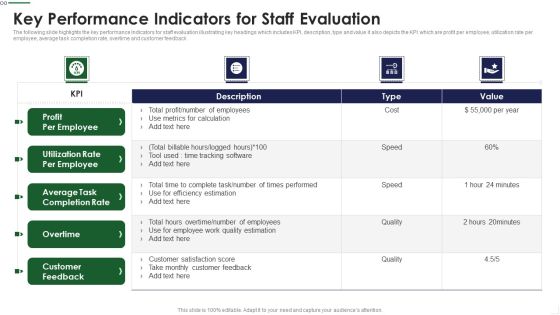
Key Performance Indicators For Staff Evaluation Infographics PDF
The following slide highlights the key performance Indicators for staff evaluation illustrating key headings which includes KPI, description, type and value it also depicts the KPI which are profit per employee, utilization rate per employee, average task completion rate, overtime and customer feedback Showcasing this set of slides titled Key Performance Indicators For Staff Evaluation Infographics PDF The topics addressed in these templates are Metrics Calculation, Times Performed, Customer Satisfaction All the content presented in this PPT design is completely editable. Download it and make adjustments in color, background, font etc. as per your unique business setting.
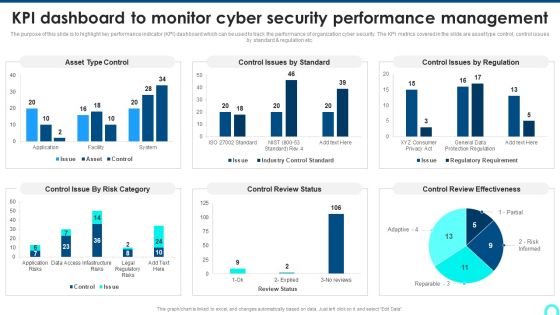
KPI Dashboard To Monitor Cyber Security Performance Management Background PDF
The purpose of this slide is to highlight key performance indicator KPI dashboard which can be used to track the performance of organization cyber security. The KPI metrics covered in the slide are asset type control, control issues by standard and regulation etc.Deliver and pitch your topic in the best possible manner with this KPI Dashboard To Monitor Cyber Security Performance Management Background PDF. Use them to share invaluable insights on Control Issue, Control Review, Review Effectiveness and impress your audience. This template can be altered and modified as per your expectations. So, grab it now.

Dashboard For Tracking Customer Service Team Performance Clipart PDF
This slide covers the KPI dashboard for analyzing the performance of client support department. It includes metrics such as first call resolution, unresolved calls, average response rate, the best day to call, average time to solve issues, etc. Deliver an awe inspiring pitch with this creative Dashboard For Tracking Customer Service Team Performance Clipart PDF bundle. Topics like Dashboard For Tracking Customer, Service Team Performance can be discussed with this completely editable template. It is available for immediate download depending on the needs and requirements of the user.

Dashboard For Tracking Customer Service Team Performance Information PDF
This slide covers the KPI dashboard for analyzing the performance of client support department. It includes metrics such as first call resolution, unresolved calls, average response rate, the best day to call, average time to solve issues, etc. Deliver an awe inspiring pitch with this creative Dashboard For Tracking Customer Service Team Performance Information PDF bundle. Topics like Dashboard For Tracking Customer, Service Team Performance can be discussed with this completely editable template. It is available for immediate download depending on the needs and requirements of the user.

Comparative Matrix Of Actual And Projected Financial Performance Brochure PDF
This slide shows matrix which can be used to compare actual and expected financial performance of an organization. It covers metrics such as gross profit margin, net profit margin, working capital, etc. Pitch your topic with ease and precision using this Comparative Matrix Of Actual And Projected Financial Performance Brochure PDF. This layout presents information on Comparative Matrix Actual, Projected Financial Performance. It is also available for immediate download and adjustment. So, changes can be made in the color, design, graphics or any other component to create a unique layout.
Google Adwords Strategic Campaign Performance Tracking Dashboard Icons PDF
This slide showcases KPI dashboard for real time tracking of performance metrics for google adwords campaign. It includes elements such as cost interactions, impressions, device, etc. Showcasing this set of slides titled Google Adwords Strategic Campaign Performance Tracking Dashboard Icons PDF. The topics addressed in these templates are Campaign Performance Device, Interaction Rate Cost Device, Daily Cost Device. All the content presented in this PPT design is completely editable. Download it and make adjustments in color, background, font etc. as per your unique business setting.

Website Analytics Dashboard To Track Business Performance Guidelines PDF
This slide exhibits visual report to track web performance metrics such as bounce rates, conversion rate, etc. It focuses on visualizing how effectively any website is converting traffic. It involves information related to number of users, page visitors, etc. Pitch your topic with ease and precision using this Website Analytics Dashboard To Track Business Performance Guidelines PDF. This layout presents information on Website Analytics, Dashboard To Track, Business Performance. It is also available for immediate download and adjustment. So, changes can be made in the color, design, graphics or any other component to create a unique layout.

Analyzing Impact On Performance Of Warehouse Operation Graphics PDF
This slide analyzes the operations management efficiency of the warehouse. It assesses the performance of metrics including, receiving, put-away, pick-n-pack, shipping, inventory and order management. From laying roadmaps to briefing everything in detail, our templates are perfect for you. You can set the stage with your presentation slides. All you have to do is download these easy-to-edit and customizable templates. Analyzing Impact On Performance Of Warehouse Operation Graphics PDF will help you deliver an outstanding performance that everyone would remember and praise you for. Do download this presentation today.
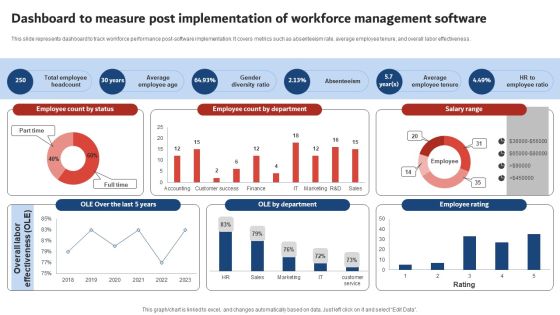
Dashboard To Measure Post Implementation Of Workforce Management Software Designs PDF
This slide represents dashboard to track workforce performance post-software implementation. It covers metrics such as absenteeism rate, average employee tenure, and overall labor effectiveness. Find a pre designed and impeccable Dashboard To Measure Post Implementation Of Workforce Management Software Designs PDF. The templates can ace your presentation without additional effort. You can download these easy to edit presentation templates to make your presentation stand out from others. So, what are you waiting for Download the template from Slidegeeks today and give a unique touch to your presentation.

Business Performance Review With Target Actual Results And Future Goals Professional PDF
This slide shows organizational review covering set targets of past year, measuring present performance and deciding future goals on basis of metrics . It includes cost of goods sold, production target, projected customer demand, quarterly sales, monthly new leads, scrap reduction target and customer engagement rate. Showcasing this set of slides titled Business Performance Review With Target Actual Results And Future Goals Professional PDF. The topics addressed in these templates are Previous Target, Projected Customer Demand, Production Target. All the content presented in this PPT design is completely editable. Download it and make adjustments in color, background, font etc. as per your unique business setting.

Dashboard To Measure Performance Of E Commerce Retail Business Growth Marketing Techniques Icons PDF
This following slide displays the key metrics that can help an organization to measure effectiveness of e-commerce strategies. These can be revenue generated using e-commerce platform, conversion rates etc. If your project calls for a presentation, then Slidegeeks is your go to partner because we have professionally designed, easy to edit templates that are perfect for any presentation. After downloading, you can easily edit Dashboard To Measure Performance Of E Commerce Retail Business Growth Marketing Techniques Icons PDF and make the changes accordingly. You can rearrange slides or fill them with different images. Check out all the handy templates

Dashboard To Measure Performance Of Social Media Marketing Strategies Pictures PDF
This following slide displays the key metrics that can help an organization to measure effectiveness of social media strategies. These can be leads generated, leads by region, web traffic targets etc.Slidegeeks is one of the best resources for PowerPoint templates. You can download easily and regulate Dashboard To Measure Performance Of Social Media Marketing Strategies Pictures PDF for your personal presentations from our wonderful collection. A few clicks is all it takes to discover and get the most relevant and appropriate templates. Use our Templates to add a unique zing and appeal to your presentation and meetings. All the slides are easy to edit and you can use them even for advertisement purposes.

Online Marketing Techniques For Acquiring Clients Dashboard To Measure Performance Information PDF
This following slide displays the key metrics that can help an organization to measure effectiveness of social media strategies. These can be leads generated, leads by region, web traffic targets etc. Take your projects to the next level with our ultimate collection of Online Marketing Techniques For Acquiring Clients Dashboard To Measure Performance Information PDF. Slidegeeks has designed a range of layouts that are perfect for representing task or activity duration, keeping track of all your deadlines at a glance. Tailor these designs to your exact needs and give them a truly corporate look with your own brand colors they will make your projects stand out from the rest.

Implementing Digital Marketing Dashboard To Measure Performance Of Social Media Professional PDF
This following slide displays the key metrics that can help an organization to measure effectiveness of social media strategies. These can be leads generated, leads by region, web traffic targets etc. Want to ace your presentation in front of a live audience Our Implementing Digital Marketing Dashboard To Measure Performance Of Social Media Professional PDF can help you do that by engaging all the users towards you. Slidegeeks experts have put their efforts and expertise into creating these impeccable powerpoint presentations so that you can communicate your ideas clearly. Moreover, all the templates are customizable, and easy-to-edit and downloadable. Use these for both personal and commercial use.

KPI Dashboard Highlighting Off Page Seo Performance Rules PDF
The purpose of this template is to outline KPI reporting dashboard showing results of off page SEO. The dashboard covers key metrics such as website ranking on search engine, traffic, sessions, backlinks and site audit. Showcasing this set of slides titled kpi dashboard highlighting off page seo performance rules pdf. The topics addressed in these templates are kpi dashboard highlighting off page seo performance. All the content presented in this PPT design is completely editable. Download it and make adjustments in color, background, font etc. as per your unique business setting.

Comparative Assessment Of Sales Performance With Competitors Infographics PDF
This slide shows the comparative assessment of sales performance with competitors on the basis of certain metrics such as lead qualification rate, marketing effectiveness, sales forecast accuracy, pipeline thickness, etc. Presenting Comparative Assessment Of Sales Performance With Competitors Infographics PDF to provide visual cues and insights. Share and navigate important information on five stages that need your due attention. This template can be used to pitch topics like Industry Benchmark, Marketing Effectiveness, Sales Forecast Accuracy. In addtion, this PPT design contains high resolution images, graphics, etc, that are easily editable and available for immediate download.
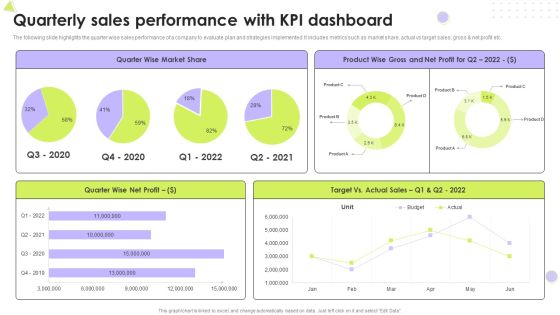
Quarterly Sales Performance With Kpi Dashboard Introduction PDF
The following slide highlights the quarter wise sales performance of a company to evaluate plan and strategies implemented. It includes metrics such as market share, actual vs target sales, gross and net profit etc. Pitch your topic with ease and precision using this Quarterly Sales Performance With Kpi Dashboard Introduction PDF. This layout presents information on Market Share, Net Profit, Target. It is also available for immediate download and adjustment. So, changes can be made in the color, design, graphics or any other component to create a unique layout.

Essential Key Performance Indicators In Investment Summary Demonstration PDF
The following slide showcases dashboard of portfolio summary with important key performance indicators to provide an oversight of the project. Key metrics covered are cost, work, variance, active risk and issues. Showcasing this set of slides titled Essential Key Performance Indicators In Investment Summary Demonstration PDF. The topics addressed in these templates are Cost, Active Risks, Projects. All the content presented in this PPT design is completely editable. Download it and make adjustments in color, background, font etc. as per your unique business setting.

Prospective Buyer Retention Dashboard With Key Performance Indicators Themes PDF
This slide shows the dashboard representing the key performance metrics for retention of potential customers of the organization. It shows no. of active users, churn rate, cost of customer acquisition, their life time value, monthly recurring revenue etc.Pitch your topic with ease and precision using this Prospective Buyer Retention Dashboard With Key Performance Indicators Themes PDF. This layout presents information on Recurring Revenue, Revenue Growth, Customer Acquisition. It is also available for immediate download and adjustment. So, changes can be made in the color, design, graphics or any other component to create a unique layout.

Business Analytics Application Workforce Performance Analysis KPI Dashboard Template PDF
This slide represents the dashboard representing key metrics to analyze the performance of overall workforce. It includes details related to absence rate, benefits satisfaction, engagement index etc. Take your projects to the next level with our ultimate collection of Business Analytics Application Workforce Performance Analysis KPI Dashboard Template PDF. Slidegeeks has designed a range of layouts that are perfect for representing task or activity duration, keeping track of all your deadlines at a glance. Tailor these designs to your exact needs and give them a truly corporate look with your own brand colors theyll make your projects stand out from the rest.

Business To Business E Commerce Performance Tracking Matrix Information PDF
This slide shows the b2b E Commerce business performance tracking table. It includes metrics such as customer acquisition cost, customer retention cost, average order value, order frequency and returns percentage. Showcasing this set of slides titled Business To Business E Commerce Performance Tracking Matrix Information PDF. The topics addressed in these templates are Customer Acquisition Cost, Customer Retention Rate, Order Frequency . All the content presented in this PPT design is completely editable. Download it and make adjustments in color, background, font etc. as per your unique business setting.

Business Newsletter Referral Marketing Program Performance KPI Dashboard Formats PDF
This slide represents KPI dashboard designed to track performance of the program conducted to attract new leads at lower cost with the help of existing customers to generate leads that best fit the organization. It includes key metrics such as total revenue generated, monthly recurring revenue, paying customers etc. Showcasing this set of slides titled Business Newsletter Referral Marketing Program Performance KPI Dashboard Formats PDF. The topics addressed in these templates are Dashboard, Paying Customers, Monthly Recurring Revenue, Total Revenue Generated. All the content presented in this PPT design is completely editable. Download it and make adjustments in color, background, font etc. as per your unique business setting.
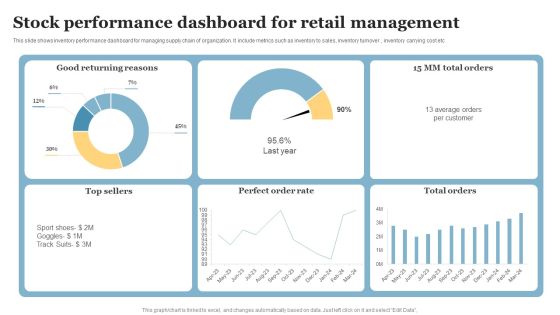
Stock Performance Dashboard For Retail Management Pictures PDF
This slide shows inventory performance dashboard for managing supply chain of organization. It include metrics such as inventory to sales, inventory turnover , inventory carrying cost etc. Pitch your topic with ease and precision using this Stock Performance Dashboard For Retail Management Pictures PDF. This layout presents information on Good Returning Reasons, Perfect Order Rate, Top Sellers. It is also available for immediate download and adjustment. So, changes can be made in the color, design, graphics or any other component to create a unique layout.

Media Advertising Social Media Channel Performance Dashboard Pictures PDF
This slide depicts the key metrics used to track the performance of social media channels in form of increase in followers, clicks and likes. This modern and well-arranged Media Advertising Social Media Channel Performance Dashboard Pictures PDF provides lots of creative possibilities. It is very simple to customize and edit with the Powerpoint Software. Just drag and drop your pictures into the shapes. All facets of this template can be edited with Powerpoint, no extra software is necessary. Add your own material, put your images in the places assigned for them, adjust the colors, and then you can show your slides to the world, with an animated slide included.

Performance Indicators For Effective Traditional Marketing Guidelines PDF
This slide showcases key metrics of traditional media for marketers. Major indicators covered are cost per lead, customer retention, marketing ROI. Sales revenue, customer lifetime value and website traffic. Create an editable Performance Indicators For Effective Traditional Marketing Guidelines PDF that communicates your idea and engages your audience. Whether you are presenting a business or an educational presentation, pre-designed presentation templates help save time. Performance Indicators For Effective Traditional Marketing Guidelines PDF is highly customizable and very easy to edit, covering many different styles from creative to business presentations. Slidegeeks has creative team members who have crafted amazing templates. So, go and get them without any delay.
Performance Evaluation KPI Dashboard For 360 Degree Review Icons PDF
This slide covers 360 degree employee feedback dashboard. It includes metrics such as highest rated area, lowest rated area, potential blind spots, peer ratings, self rating, gap analysis, etc. Showcasing this set of slides titled Performance Evaluation KPI Dashboard For 360 Degree Review Icons PDF. The topics addressed in these templates are Highest Rated, Lowest Areas, Potential Spots. All the content presented in this PPT design is completely editable. Download it and make adjustments in color, background, font etc. as per your unique business setting.

Google Adwords Strategic Campaign Performance Analysis Download PDF
The following slide displays google adwords campaign KPI trends to help company review change in values over time. It includes key metrics such as impressions, clicks, click through rate and conversions. Pitch your topic with ease and precision using this Google Adwords Strategic Campaign Performance Analysis Download PDF. This layout presents information on Google Ads Impression, Google Ads Clicks, Google Ads Conversions. It is also available for immediate download and adjustment. So, changes can be made in the color, design, graphics or any other component to create a unique layout.

Dashboard For Tracking Aftersales Customer Services Team Performance Designs PDF
This slide covers the KPI dashboard for ticket tracking. It includes metrics such as tickets by month, service level, and details of customer service department agents. Boost your pitch with our creative Dashboard For Tracking Aftersales Customer Services Team Performance Designs PDF. Deliver an awe inspiring pitch that will mesmerize everyone. Using these presentation templates you will surely catch everyones attention. You can browse the ppts collection on our website. We have researchers who are experts at creating the right content for the templates. So you do not have to invest time in any additional work. Just grab the template now and use them.

Industry Wise Email Marketing Performance Statistics Analysis Graphics PDF
This slide includes email marketing benchmarks and statistics for the year 2022 based on various industries. It includes email metrics such as open rate, CTR, unsubscribes rate in industries like automobile, finance, retail, food, legal services, etc. Pitch your topic with ease and precision using this Industry Wise Email Marketing Performance Statistics Analysis Graphics PDF. This layout presents information on Automobile, Financial Service, Legal Services. It is also available for immediate download and adjustment. So, changes can be made in the color, design, graphics or any other component to create a unique layout.
 Home
Home