Stakeholder Charts

Project Administration Bundle Project Gantt Chart With Duration Topics PDF
Design a highly optimized project management report using this well researched Project Administration Bundle Project Gantt Chart With Duration Topics PDF. This layout can be used to present the professional details of a task or activity. Showcase the activities allocated to the business executives with this Gantt Chart PowerPoint theme. List down the column tasks in various timeframes and allocate time for each. In addition, also monitor the actual time and make comparisons to interpret the final progress using this innovative Gantt Chart Template. Showcase the work breakdown structure to attract your audience. Download and share it using Google Slides, if it suits your requirement.

Bar Chart Management Investment Ppt PowerPoint Presentation File Rules
This is a bar chart management investment ppt powerpoint presentation file rules. This is a three stage process. The stages in this process are finance, marketing, management, investment, analysis.

Column Chart Marketing Management Ppt PowerPoint Presentation Infographic Template Icon
This is a column chart marketing management ppt powerpoint presentation infographic template icon. This is a two stage process. The stages in this process are finance, marketing, management, investment, analysis.
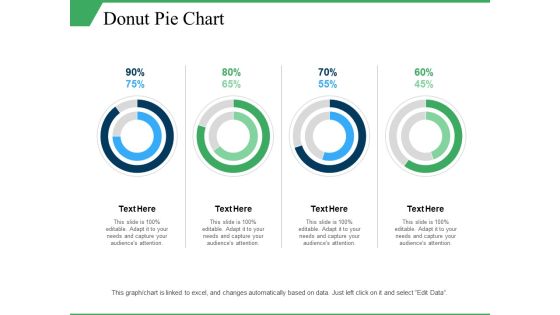
Donut Pie Chart Ppt PowerPoint Presentation Layouts Information
This is a donut pie chart ppt powerpoint presentation layouts information. This is a four stage process. The stages in this process are percentage, finance, donut, business, marketing.

Area Chart Finance Ppt Powerpoint Presentation Infographic Template Clipart Images
This is a area chart finance ppt powerpoint presentation infographic template clipart images. This is a two stage process. The stages in this process are area bar, finance, marketing, management, analysis.
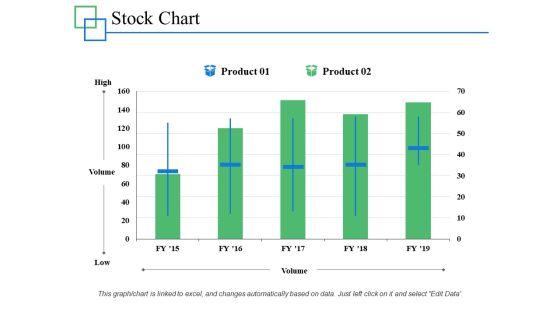
Stock Chart Management Investment Ppt PowerPoint Presentation Infographics Professional
This is a stock chart management investment ppt powerpoint presentation infographics professional. This is a two stage process. The stages in this process are marketing, business, management, percentage, product.
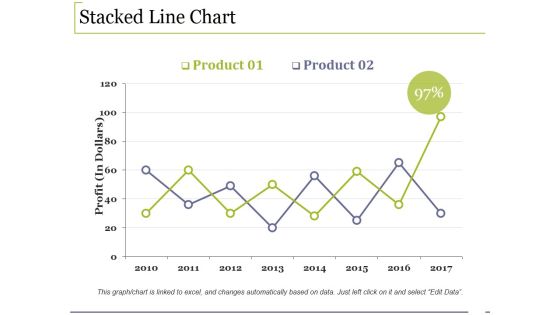
Stacked Line Chart Ppt PowerPoint Presentation Ideas Styles
This is a stacked line chart ppt powerpoint presentation ideas styles. This is a two stage process. The stages in this process are growth, finance, analysis, management, business.
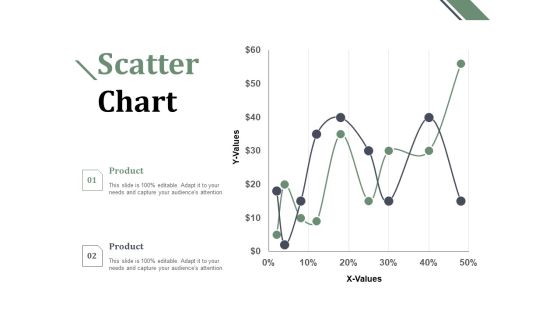
Scatter Chart Ppt PowerPoint Presentation Gallery Master Slide
This is a scatter chart ppt powerpoint presentation gallery master slide. This is a two stage process. The stages in this process are finance, marketing, management, investment, analysis.

Bar Chart Finance Ppt PowerPoint Presentation Model Master Slide
This is a bar chart finance ppt powerpoint presentation model master slide. This is a two stage process. The stages in this process are finance, marketing, management, investment, analysis.

Clustered Bar Chart Finance Ppt PowerPoint Presentation Summary Layouts
This is a clustered bar chart finance ppt powerpoint presentation summary layouts. This is a two stage process. The stages in this process are finance, marketing, management, investment, analysis.
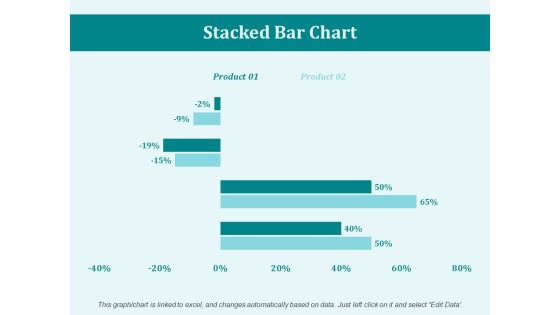
Stacked Bar Chart Percentage Ppt PowerPoint Presentation Portfolio Mockup
This is a stacked bar chart percentage ppt powerpoint presentation portfolio mockup. This is a two stage process. The stages in this process are business, marketing, management, percentage, product.

Bar Chart Percentage Product Ppt PowerPoint Presentation Layouts Designs Download
This is a bar chart percentage product ppt powerpoint presentation layouts designs download. This is a two stage process. The stages in this process are percentage, product, business, management.

Bar Chart Finance Marketing Ppt PowerPoint Presentation File Good
This is a bar chart finance marketing ppt powerpoint presentation file good. This is a three stage process. The stages in this process are finance, marketing, management, investment, analysis.
Open High Low Close Chart Ppt PowerPoint Presentation Icon Portrait
This is a open high low close chart ppt powerpoint presentation icon portrait. This is a two stage process. The stages in this process are business, management, marketing, percentage, product.

Column Chart Finance Ppt Powerpoint Presentation Infographic Template Icon
This is a column chart finance ppt powerpoint presentation infographic template icon. This is a three stage process. The stages in this process are finance, marketing, management, investment, analysis.

Area Chart Growth Strategy Ppt PowerPoint Presentation Infographics Themes
This is a area chart growth strategy ppt powerpoint presentation infographics themes. This is a two stage process. The stages in this process are finance, marketing, management, investment, analysis.
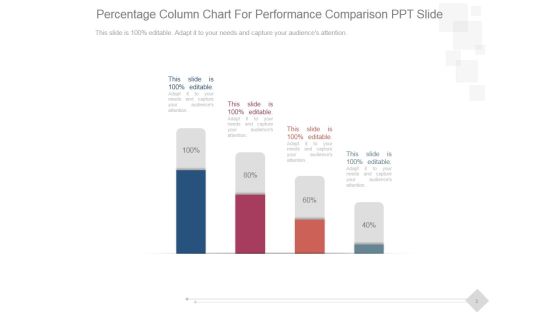
Percentage Column Chart For Performance Comparison Ppt PowerPoint Presentation Good
This is a percentage column chart for performance comparison ppt powerpoint presentation good. This is a four stage process. The stages in this process are business, marketing, technology, presentation, management.
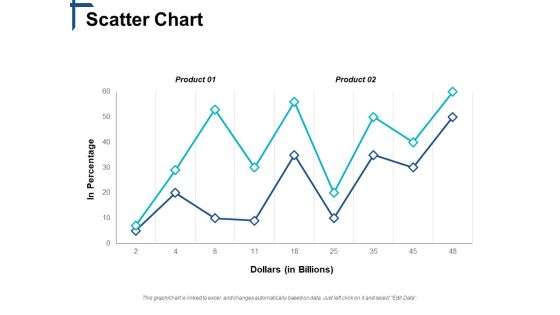
Scatter Chart Competitive Differentiation Ppt PowerPoint Presentation Show Slides
This is a scatter chart competitive differentiation ppt powerpoint presentation show slides. This is a two stage process. The stages in this process are business, management, marketing, strategy, sales.
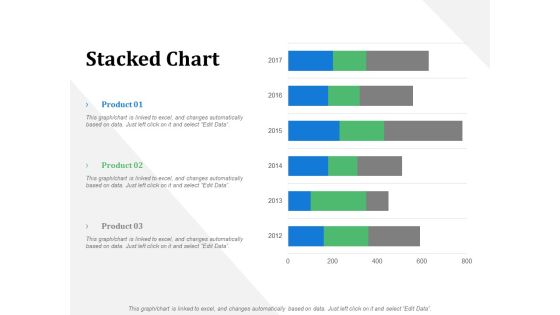
Stacked Chart Business Marketing Ppt PowerPoint Presentation File Design Ideas
This is a stacked chart business marketing ppt powerpoint presentation file design ideas. This is a three stage process. The stages in this process are business, management, marketing, product, percentage.

Bubble Chart Percentage Product Ppt PowerPoint Presentation Ideas Aids
This is a bubble chart percentage product ppt powerpoint presentation ideas aids. This is a two stage process. The stages in this process are business, management, marketing, percentage, product.

Column Chart Finance Marketing Ppt PowerPoint Presentation Model Example Introduction
This is a column chart finance marketing ppt powerpoint presentation model example introduction. This is a two stage process. The stages in this process are business, management, marketing, percentage, product.
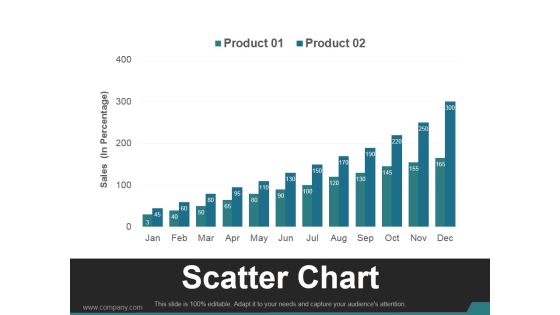
Scatter Chart Template 1 Ppt PowerPoint Presentation Visual Aids
This is a scatter chart template 1 ppt powerpoint presentation visual aids. This is a twelve stage process. The stages in this process are business, marketing, growth, finance, management.

Combo Chart Finance Ppt PowerPoint Presentation Infographic Template Microsoft
This is a combo chart finance ppt powerpoint presentation infographic template microsoft. This is a three stage process. The stages in this process are finance, marketing, management, investment, analysis.

Combo Chart Finance Ppt PowerPoint Presentation Infographic Template Graphics
This is a combo chart finance ppt powerpoint presentation infographic template graphics. This is a two stage process. The stages in this process are growth, finance, marketing, management, investment.

Area Chart Finance Ppt PowerPoint Presentation Summary Design Templates
This is a area chart finance ppt powerpoint presentation summary design templates. This is a two stage process. The stages in this process are finance, marketing, management, investment, analysis.

Donut Pie Chart Ppt PowerPoint Presentation Infographic Template Slides
This is a donut pie chart ppt powerpoint presentation infographic template slides. This is a three stage process. The stages in this process are percentage, product, business, management, marketing.

Combo Chart Product Ppt PowerPoint Presentation Professional Graphics Template
This is a combo chart product ppt powerpoint presentation professional graphics template. This is a three stage process. The stages in this process are finance, marketing, management, investment, product.

Combo Chart Ppt PowerPoint Presentation Summary Graphics Tutorials
This is a combo chart ppt powerpoint presentation summary graphics tutorials. This is a eight stage process. The stages in this process are product, growth rate, market size, business.

High Low Close Chart Ppt Powerpoint Presentation Gallery Slides
This is a high low close chart ppt powerpoint presentation gallery slides. This is a five stage process. The stages in this process are close, volume, high, low, graph.
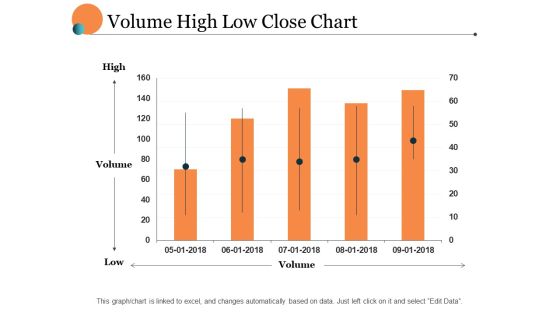
Volume High Low Close Chart Ppt PowerPoint Presentation Portfolio Layout
This is a volume high low close chart ppt powerpoint presentation portfolio layout. This is a five stage process. The stages in this process are finance, marketing, management, investment, analysis.
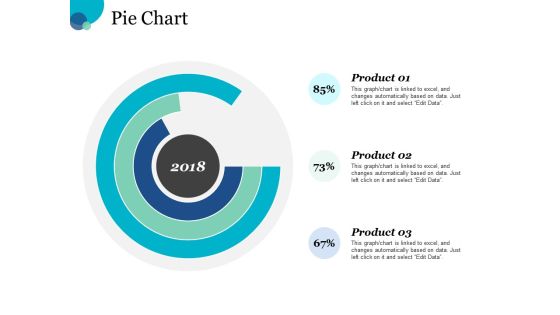
Pie Chart Finance Ppt PowerPoint Presentation Slides Graphic Images
This is a pie chart finance ppt powerpoint presentation slides graphic images. This is a three stage process. The stages in this process are finance, marketing, management, investment, analysis.
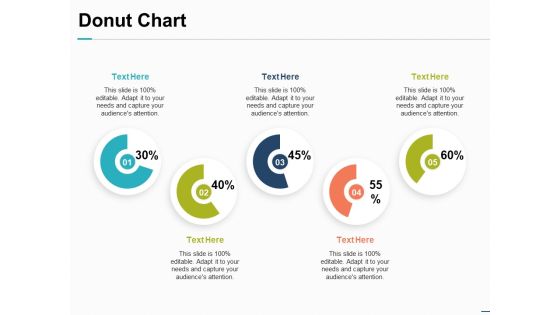
Donut Chart Financial Investment Ppt PowerPoint Presentation Inspiration Introduction
This is a donut chart financial investment ppt powerpoint presentation inspiration introduction. This is a five stage process. The stages in this process are finance, marketing, management, investment, analysis.

Area Chart Investment Ppt PowerPoint Presentation Summary Design Inspiration
This is a area chart investment ppt powerpoint presentation summary design inspiration. This is a three stage process. The stages in this process are finance, marketing, management, investment, analysis.

Donut Chart Marketing Product Ppt PowerPoint Presentation Slides Background Designs
This is a donut chart marketing product ppt powerpoint presentation slides background designs. This is a three stage process. The stages in this process are business, management, marketing, percentage, product.

Bubble Chart Product Ppt PowerPoint Presentation Inspiration Design Ideas
This is a bubble chart product ppt powerpoint presentation inspiration design ideas. This is a one stage process. The stages in this process are business, management, marketing, product, percentage.
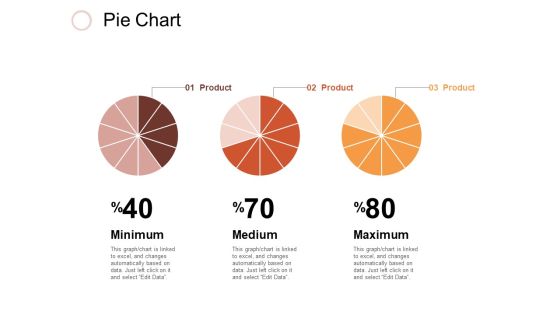
Pie Chart Investment Ppt PowerPoint Presentation Inspiration Design Inspiration
This is a pie chart investment ppt powerpoint presentation inspiration design inspiration. This is a three stage process. The stages in this process are business, management, marketing, percentage, product.

Bubble Chart Percentage Ppt PowerPoint Presentation File Layouts
This is a bubble chart percentage ppt powerpoint presentation file layouts. This is a two stage process. The stages in this process are finance, marketing, management, investment, product, percentage.

Column Chart Marketing Strategy Ppt PowerPoint Presentation Layouts Slide Portrait
This is a column chart marketing strategy ppt powerpoint presentation layouts slide portrait. This is a two stage process. The stages in this process are percentage, product, business, management, marketing.
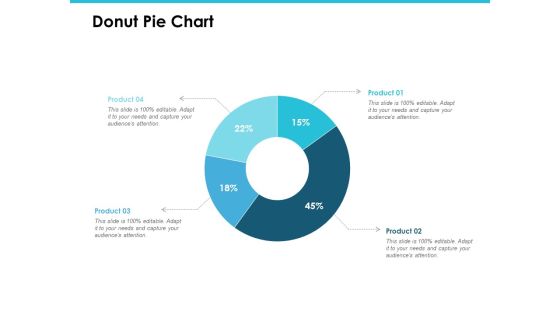
Donut Pie Chart Investment Analysis Ppt PowerPoint Presentation Gallery Introduction
This is a donut pie chart investment analysis ppt powerpoint presentation gallery introduction. This is a four stage process. The stages in this process are finance, marketing, management, investment, analysis.
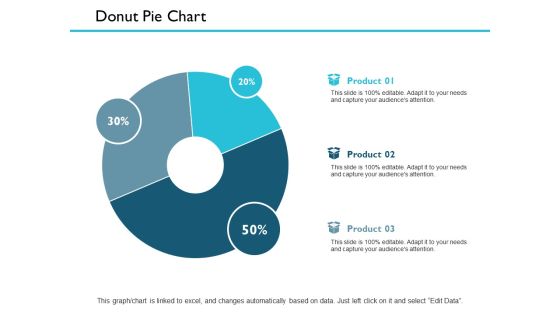
Donut Pie Chart Finance Ppt PowerPoint Presentation Outline Smartart
This is a donut pie chart finance ppt powerpoint presentation outline smartart. This is a three stage process. The stages in this process are management, marketing, business, strategy, finance.

Correlated Arrows 2 Steps Technical Flow Chart PowerPoint Templates
We present our correlated arrows 2 steps technical flow chart PowerPoint templates.Use our Business PowerPoint Templates because, Infrastructure growth is an obvious requirement of today.Inform your group on how exactly this potential is tailor made for you Use our Arrows PowerPoint Templates because,This PPT slide helps you to measure key aspects of the current process and collect relevant data Use our Shapes PowerPoint Templates because,You have the ideas, you have got a brainwave. Use our Design PowerPoint Templates because,firing the arrows to emblazon the desired path will let you achieve anticipated results. Use our Abstract PowerPoint Templates because,Leading from the front is your preferred style. Use these PowerPoint slides for presentations relating to abstract, arrow, arrows, business, chart, design, development, diagram, direction, element, flow, flowchart, graph, linear, management, model, motion, organization, plan, process, program, section, segment, set, sign, solution, strategy, symbol, technology. The prominent colors used in the PowerPoint template are Blue, Blue navy, White. People tell us our correlated arrows 2 steps technical flow chart PowerPoint templates are Fantastic. The feedback we get is that our business PowerPoint templates and PPT Slides are Fabulous. People tell us our correlated arrows 2 steps technical flow chart PowerPoint templates are Playful. Presenters tell us our arrows PowerPoint templates and PPT Slides are Pretty. The feedback we get is that our correlated arrows 2 steps technical flow chart PowerPoint templates are Fashionable. Professionals tell us our chart PowerPoint templates and PPT Slides are aesthetically designed to attract attention. We guarantee that they will grab all the eyeballs you need.

Bar Chart Ppt PowerPoint Presentation Icon Design Templates
This is a bar chart ppt powerpoint presentation icon design templates. This is a nine stage process. The stages in this process are sales in percentage, bar graph, business, marketing, growth.
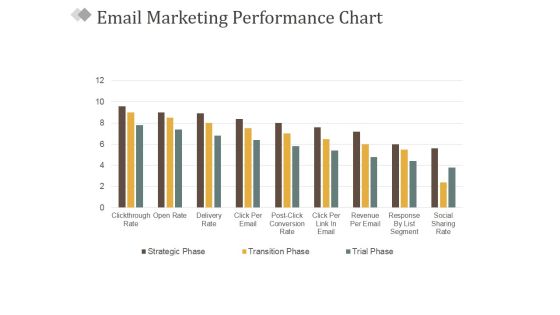
Email Marketing Performance Chart Ppt PowerPoint Presentation Gallery Elements
This is a email marketing performance chart ppt powerpoint presentation gallery elements. This is a nine stage process. The stages in this process are business, marketing, success, management, bar graph.
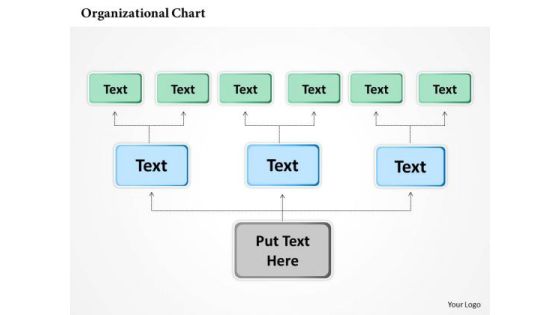
Business Framework Organizational Chart In PowerPoint PowerPoint Presentation
This image slide has been designed to display organizational flow charts. Use this image slide, in your presentations to depict business management designations. This image slide will enhance the quality of your presentations and will provide professional appearance to your presentations.

Email Marketing Performance Chart Ppt PowerPoint Presentation Model Topics
This is a email marketing performance chart ppt powerpoint presentation model topics. This is a three stage process. The stages in this process are strategic phase, transition phase, trial phase.

Clustered Column Line Chart Ppt PowerPoint Presentation File Pictures
This is a clustered column line chart ppt powerpoint presentation file pictures. This is a four stage process. The stages in this process are clustered bar, product, planning, business, sales in percentage.
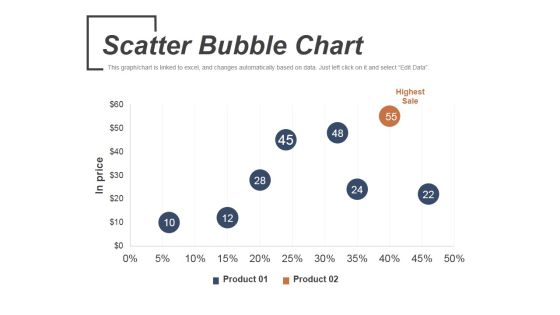
Scatter Bubble Chart Ppt PowerPoint Presentation Infographic Template Graphics
This is a scatter bubble chart ppt powerpoint presentation infographic template graphics. This is a two stage process. The stages in this process are highest sale, product, in price.

Competitive Analysis Template 6 Scatter Chart Ppt PowerPoint Presentation Slides
This is a competitive analysis template 6 scatter chart ppt powerpoint presentation slides. This is a eight stage process. The stages in this process are users interface, data import, example, pricing, support, update, tutorials, easy to use, table.

Competitive Analysis Template 7 Bubble Chart Ppt PowerPoint Presentation Deck
This is a competitive analysis template 7 bubble chart ppt powerpoint presentation deck. This is a six stage process. The stages in this process are users interface, data import, example, pricing, support, update, tutorials, easy to use, table.
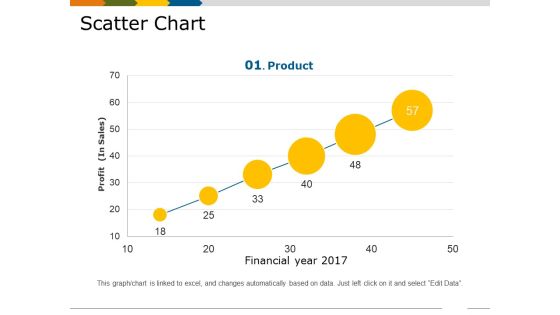
Scatter Chart Template 1 Ppt PowerPoint Presentation Show Slides
This is a scatter chart template 1 ppt powerpoint presentation show slides. This is a six stage process. The stages in this process are financial year, profit in sales, growth, business, marketing, product.

Scatter Chart Template 2 Ppt PowerPoint Presentation Styles Visual Aids
This is a scatter chart template 2 ppt powerpoint presentation styles visual aids. This is a two stage process. The stages in this process are product, business, marketing, in percentage, growth.

Volume Open High Low Close Chart Ppt PowerPoint Presentation Sample
This is a volume open high low close chart ppt powerpoint presentation sample. This is a five stage process. The stages in this process are close, volume, high, low, open.
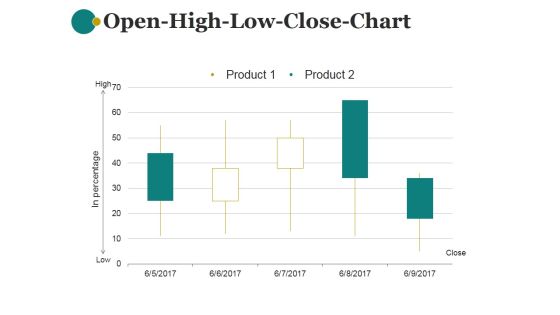
Open High Low Close Chart Ppt PowerPoint Presentation Information
This is a open high low close chart ppt powerpoint presentation information. This is a five stage process. The stages in this process are product, in percentage, close, low, high.
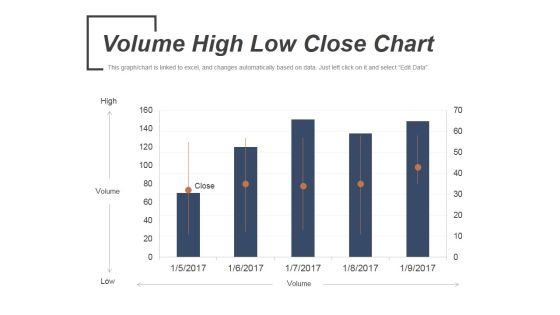
Volume High Low Close Chart Ppt PowerPoint Presentation Slides Portrait
This is a volume high low close chart ppt powerpoint presentation slides portrait. This is a five stage process. The stages in this process are volume, low, high, open, close.

High Low Close Chart Ppt PowerPoint Presentation Inspiration Professional
This is a high low close chart ppt powerpoint presentation inspiration professional. This is a ten stage process. The stages in this process are business, strategy, analysis, planning, high, volume, low.

Area Chart Financial Ppt PowerPoint Presentation Outline Professional
This is a area chart financial ppt powerpoint presentation outline professional. This is a four stage process. The stages in this process are product, sales in percentage, financial year.

Stock Photo Green Grass Business Growth Chart PowerPoint Slide
This PowerPoint slide display chart created with green grass. This image slide has been crafted with graphic of green grass bar graph. This image depicts business. Use this image slide to express views on targets, goals, growth and management in your presentations. This image slide exhibits various information which requires visual aid. Enhance the quality of your presentations using this image.

Business Framework Pyramid Diagram Hierarchy Map Org Chart PowerPoint Presentation
This business diagram displays framework of pyramid diagram hierarchy map chart. It contains graphic of hierarchy map as a organizational chart. This slide displays concept of organizational and business hierarchy. Use this diagram for your business and management related presentations.
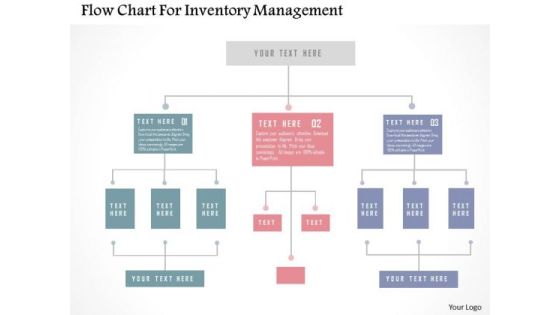
Business Diagram Flow Chart For Inventory Management PowerPoint Templates
Our above business slide contains graphics of flow chart. This flowchart may be used to display inventory management. This slide is an excellent backdrop for you to enlighten your audience on the process.

Business Framework Organization Chart In PowerPoint PowerPoint Presentation
This image slide has been designed with business man icons to display organization chart. Use this image slide, in your presentations to depict business management designations. This image slide will enhance the quality of your presentations.

 Home
Home