Stakeholder Charts

Scatter Chart Ppt PowerPoint Presentation Show Graphic Images
This is a scatter chart ppt powerpoint presentation show graphic images. This is a one stage process. The stages in this process are in percentage, in billions, scatter chart.

Area Chart Ppt PowerPoint Presentation Infographics Graphics Tutorials
This is a area chart ppt powerpoint presentation infographics graphics tutorials. This is a two stage process. The stages in this process are product, area chart, sales in percentage.

Column Chart Ppt PowerPoint Presentation Gallery Design Inspiration
This is a column chart ppt powerpoint presentation gallery design inspiration. This is a two stage process. The stages in this process are column chart, product, sales in percentage, financial years.

Combo Chart Ppt PowerPoint Presentation Summary Background Image
This is a combo chart ppt powerpoint presentation summary background image. This is a three stage process. The stages in this process are combo chart, product, growth rate, market size.
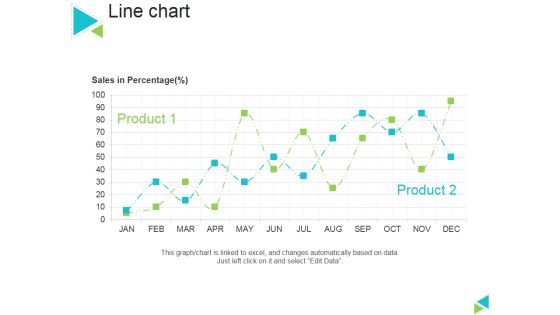
Line Chart Ppt PowerPoint Presentation Gallery Master Slide
This is a line chart ppt powerpoint presentation gallery master slide. This is a two stage process. The stages in this process are sales in percentage, product, line chart.

Line Chart Ppt PowerPoint Presentation Visual Aids Pictures
This is a line chart ppt powerpoint presentation visual aids pictures. This is a three stage process. The stages in this process are business, marketing, line chart, analysis, growth.

Data Replication Plan Chart Ppt PowerPoint Presentation Professional Gridlines PDF
Persuade your audience using this data replication plan chart ppt powerpoint presentation professional gridlines pdf. This PPT design covers four stages, thus making it a great tool to use. It also caters to a variety of topics including centralized, disturbed, eager, lazy, updated do not need to be coordinated no inconsistencies, longer response time, only useful with few updates, local copies are can only be read no inconsistencies necessary, short response times, local copies are not up to date, inconsistences. Download this PPT design now to present a convincing pitch that not only emphasizes the topic but also showcases your presentation skills.
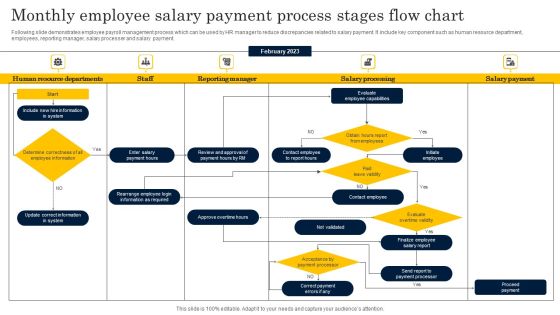
Monthly Employee Salary Payment Process Stages Flow Chart Structure PDF
Following slide demonstrates employee payroll management process which can be used by HR manager to reduce discrepancies related to salary payment. It include key component such as human resource department, employees, reporting manager, salary processer and salary payment. Presenting Monthly Employee Salary Payment Process Stages Flow Chart Structure PDF to dispense important information. This template comprises one stages. It also presents valuable insights into the topics including Human Resource Departments, Reporting Manager, Salary Processing . This is a completely customizable PowerPoint theme that can be put to use immediately. So, download it and address the topic impactfully.
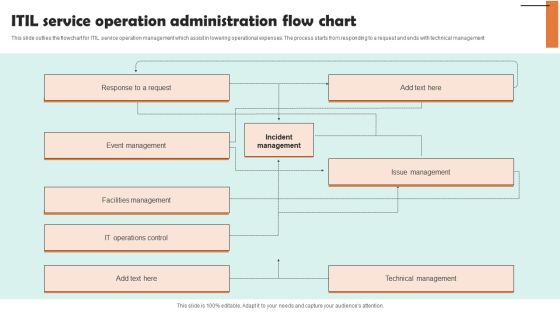
ITIL Service Operation Administration Flow Chart Professional PDF
This slide outlies the flowchart for ITIL service operation management which assist in lowering operational expenses. The process starts from responding to a request and ends with technical management. Presenting ITIL Service Operation Administration Flow Chart Professional PDF to dispense important information. This template comprises one stages. It also presents valuable insights into the topics including Response Request, Event Management, Facilities Management. This is a completely customizable PowerPoint theme that can be put to use immediately. So, download it and address the topic impactfully.
Hierarchal Growth Chart Of Worker Roles And Responsibilities Icons PDF
This slide represents the hierarchy flowchart of employee roles and responsibilities in an organisation. It includes director, vice president of product and sales and design, development manager. Persuade your audience using this Hierarchal Growth Chart Of Worker Roles And Responsibilities Icons PDF. This PPT design covers seven stages, thus making it a great tool to use. It also caters to a variety of topics including Director, Manager Development, Manager Support. Download this PPT design now to present a convincing pitch that not only emphasizes the topic but also showcases your presentation skills.

Clustered Bar Chart Ppt PowerPoint Presentation Summary Templates
This is a clustered bar chart ppt powerpoint presentation summary templates. This is a three stage process. The stages in this process are finance, marketing, management, investment, analysis.

Bar Chart Product Ppt PowerPoint Presentation Summary Diagrams
This is a bar chart product ppt powerpoint presentation summary diagrams. This is a three stage process. The stages in this process are business, management, marketing, percentage, product.

Bar Chart Marketing Ppt PowerPoint Presentation Outline Deck
This is a bar chart marketing ppt powerpoint presentation outline deck. This is a two stage process. The stages in this process are business, management, marketing, financial, sales.

Bar Chart Growth Ppt PowerPoint Presentation Gallery Graphics
This is a bar chart growth ppt powerpoint presentation gallery graphics. This is a two stage process. The stages in this process are analysis, business, finance, investment, strategy.

Bar Chart Ppt PowerPoint Presentation Ideas Format Ideas
This is a bar chart ppt powerpoint presentation ideas format ideas. This is a four stage process. The stages in this process are finance, marketing, strategy, planning, management.

Bar Chart Financial Ppt PowerPoint Presentation Pictures Files
This is a bar chart financial ppt powerpoint presentation pictures files. This is a five stage process. The stages in this process are finance, marketing, management, investment, analysis.

Clustered Bar Chart Ppt PowerPoint Presentation Layouts Infographics
This is a clustered bar chart ppt powerpoint presentation layouts infographics. This is a three stage process. The stages in this process are finance, marketing, management, investment, analysis.

Clustered Bar Chart Ppt PowerPoint Presentation Professional Good
This is a clustered bar chart ppt powerpoint presentation professional good. This is a three stage process. The stages in this process are finance, marketing, management, investment, analysis.

Bar Chart Slide Ppt PowerPoint Presentation Summary Example File
This is a bar chart slide ppt powerpoint presentation summary example file. This is a three stage process. The stages in this process are percentage, marketing, management, product.

Bar Chart Finance Ppt PowerPoint Presentation Portfolio Model
This is a bar chart finance ppt powerpoint presentation portfolio model. This is a two stage process. The stages in this process are finance, marketing, management, investment, analysis.

Stacked Bar Chart Ppt PowerPoint Presentation Gallery Outfit
This is a stacked bar chart ppt powerpoint presentation gallery outfit. This is a three stage process. The stages in this process are finance, marketing, management, investment, analysis.

Bar Chart Product Ppt PowerPoint Presentation Portfolio Visuals
This is a bar chart product ppt powerpoint presentation portfolio visuals. This is a three stage process. The stages in this process are business, management, marketing, percentage, product.
Pie Chart Ppt PowerPoint Presentation Icon Infographic Template
This is a pie chart ppt powerpoint presentation icon infographic template. This is a three stage process. The stages in this process are percentage, product, management, business.

Area Chart Financial Ppt PowerPoint Presentation Styles Templates
This is a area chart financial ppt powerpoint presentation styles templates. This is a two stage process. The stages in this process are finance, marketing, management, investment, analysis.
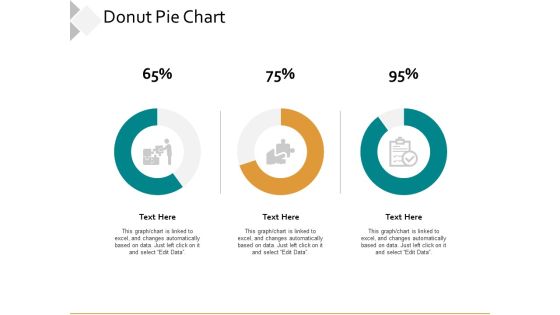
Donut Pie Chart Ppt PowerPoint Presentation Infographics Examples
This is a donut pie chart ppt powerpoint presentation infographics examples. This is a three stage process. The stages in this process are business, management, marketing, financial.

Scatter Chart Financial Ppt PowerPoint Presentation Model Deck
This is a scatter chart financial ppt powerpoint presentation model deck. This is a one stage process. The stages in this process are business, management, marketing, percentage, product.
Pie Chart Product Ppt PowerPoint Presentation Gallery Icon
This is a pie chart product ppt powerpoint presentation gallery icon. This is a five stage process. The stages in this process are percentage, product, management, marketing, business.

Clustered Column Chart Ppt PowerPoint Presentation Slides Information
This is a clustered column chart ppt powerpoint presentation slides information. This is a two stage process. The stages in this process are percentage, product, business, marketing.

Scatter Bubble Chart Ppt PowerPoint Presentation Professional Skills
This is a scatter bubble chart ppt powerpoint presentation professional skills. This is a six stage process. The stages in this process are financial, marketing, management, strategy, planning.
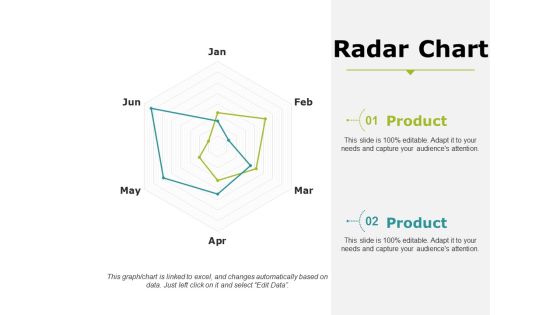
Radar Chart Ppt PowerPoint Presentation Slides Master Slide
This is a radar chart ppt powerpoint presentation slides master slide. This is a two stage process. The stages in this process are finance, marketing, strategy, management, planning.
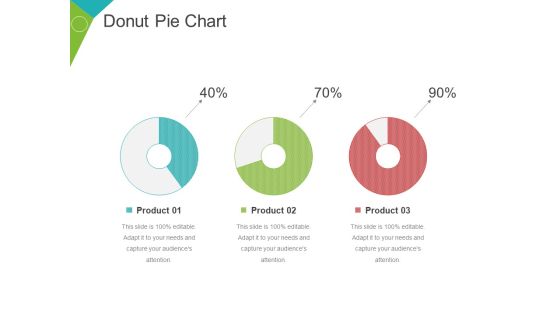
Donut Pie Chart Ppt PowerPoint Presentation Inspiration Guidelines
This is a donut pie chart ppt powerpoint presentation inspiration guidelines. This is a three stage process. The stages in this process are finance, percentage, business, marketing, management.

Area Chart Finance Ppt PowerPoint Presentation Gallery Elements
This is a area chart finance ppt powerpoint presentation gallery elements. This is a two stage process. The stages in this process are finance, marketing, management, investment, analysis.
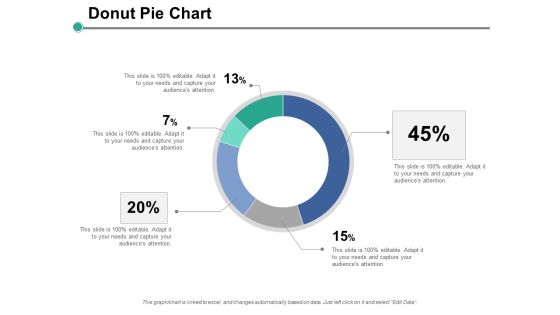
Donut Pie Chart Ppt PowerPoint Presentation Layouts Backgrounds
This is a donut pie chart ppt powerpoint presentation layouts backgrounds. This is a five stage process. The stages in this process are finance, marketing, management, investment, analysis.

Column Chart Ppt PowerPoint Presentation Slides Example Topics
This is a column chart ppt powerpoint presentation slides example topics. This is a two stage process. The stages in this process are finance, marketing, management, investment, analysis.

Area Chart Financial Ppt PowerPoint Presentation Layouts Slide
This is a area chart financial ppt powerpoint presentation layouts slide. This is a three stage process. The stages in this process are finance, marketing, management, investment, analysis.

Area Chart Financial Ppt PowerPoint Presentation Inspiration Topics
This is a area chart financial ppt powerpoint presentation inspiration topics. This is a three stage process. The stages in this process are finance, marketing, management, investment, analysis.

Combo Chart Ppt PowerPoint Presentation Visual Aids Pictures
This is a combo chart ppt powerpoint presentation visual aids pictures. This is a three stage process. The stages in this process are finance, marketing, management, investment, analysis.
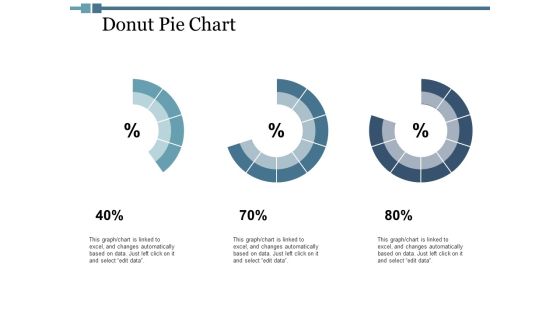
Donut Pie Chart Ppt PowerPoint Presentation Inspiration Brochure
This is a donut pie chart ppt powerpoint presentation inspiration brochure. This is a three stage process. The stages in this process are finance, marketing, management, investment, analysis.

Area Chart Finance Ppt PowerPoint Presentation Slides Layout
This is a area chart finance ppt powerpoint presentation slides layout. This is a two stage process. The stages in this process are finance, marketing, management, investment, analysis.

Combo Chart Ppt PowerPoint Presentation Visual Aids Files
This is a combo chart ppt powerpoint presentation visual aids files. This is a three stage process. The stages in this process are finance, marketing, management, investment, analysis.

Area Chart Financial Ppt PowerPoint Presentation Model Background
This is a area chart financial ppt powerpoint presentation model background. This is a two stage process. The stages in this process are finance, marketing, management, investment, analysis.

Area Chart Investment Ppt PowerPoint Presentation Infographics Summary
This is a area chart investment ppt powerpoint presentation infographics summary. This is a three stage process. The stages in this process are finance, marketing, management, investment, analysis.
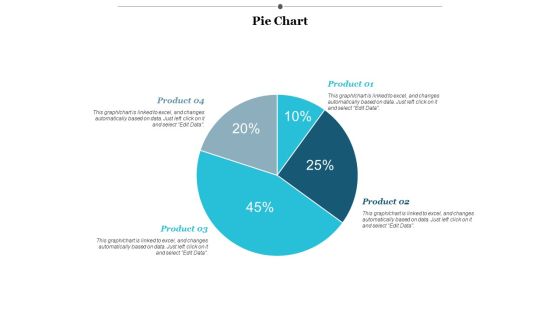
Pie Chart Finance Ppt PowerPoint Presentation Layouts Designs
This is a Pie Chart Finance Ppt PowerPoint Presentation Layouts Designs. This is a four stage process. The stages in this process are finance, marketing, management, investment, analysis.

Pie Chart Finance Ppt PowerPoint Presentation Model Ideas
This is a pie chart finance ppt powerpoint presentation model ideas. This is a four stage process. The stages in this process are finance, marketing, management, investment, analysis.

Area Chart Ppt PowerPoint Presentation File Design Inspiration
This is a area chart ppt powerpoint presentation file design inspiration. This is a three stage process. The stages in this process are percentage, product, business, management, marketing.

Donut Pie Chart Ppt PowerPoint Presentation Inspiration Elements
This is a donut pie chart ppt powerpoint presentation inspiration elements. This is a three stage process. The stages in this process are percentage, product, business, management, marketing.

Column Chart Finance Ppt PowerPoint Presentation Styles Backgrounds
This is a column chart finance ppt powerpoint presentation styles backgrounds. This is a three stage process. The stages in this process are finance, marketing, management, investment, analysis.

Combo Chart Financial Ppt PowerPoint Presentation Layouts Layouts
This is a combo chart financial ppt powerpoint presentation layouts layouts. This is a three stage process. The stages in this process are finance, marketing, management, investment, analysis.
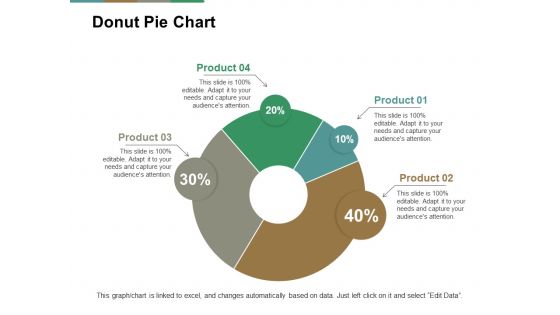
Donut Pie Chart Ppt PowerPoint Presentation Pictures Summary
This is a donut pie chart ppt powerpoint presentation pictures summary. This is a four stage process. The stages in this process are percentage, product, business, management, marketing.

Area Chart Financial Ppt PowerPoint Presentation Outline Information
This is a area chart financial ppt powerpoint presentation outline information. This is a three stage process. The stages in this process are percentage, product, business, management, marketing.

Area Chart Percentage Ppt PowerPoint Presentation Gallery Outline
This is a area chart percentage ppt powerpoint presentation gallery outline. This is a three stage process. The stages in this process are business, management, marketing, percentage, product.

Scatter Bubble Chart Ppt PowerPoint Presentation Outline Demonstration
This is a scatter bubble chart ppt powerpoint presentation outline demonstration. This is a three stage process. The stages in this process are percentage, product, management, marketing, business.

Column Chart Marketing Ppt PowerPoint Presentation Summary Images
This is a column chart marketing ppt powerpoint presentation summary images. This is a three stage process. The stages in this process are business, management, marketing, product, percentage.
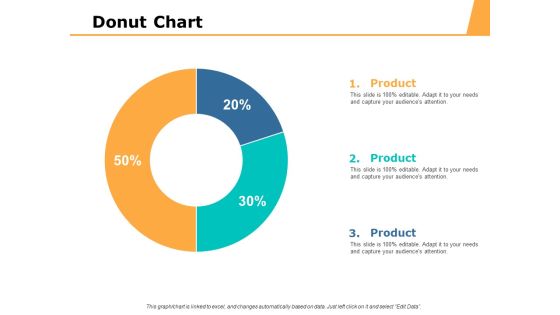
Pie Chart Percentage Ppt PowerPoint Presentation Inspiration Slides
This is a pie chart percentage ppt powerpoint presentation inspiration slides. This is a three stage process. The stages in this process are finance, marketing, management, investment, analysis.

Pie Chart Finance Ppt PowerPoint Presentation Professional Styles
This is a pie chart finance ppt powerpoint presentation professional styles. This is a three stage process. The stages in this process are management, marketing, business, strategy, finance.
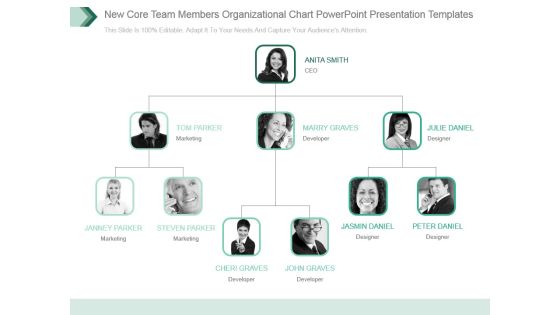
New Core Team Members Organizational Chart Powerpoint Presentation Templates
This is a new core team members organizational chart powerpoint presentation templates. This is a three stage process. The stages in this process are anita smith ceo, tom parker marketing, marry graves developer, julie daniel designer, janney parker marketing, steven parker marketing, cheri graves developer, john graves developer, jasmin daniel designer, peter daniel designer.

Core Team Members Organizational Chart Ppt Background Graphics
This is a core team members organizational chart ppt background graphics. This is a three stage process. The stages in this process are jenney smith manager, miller smith designer, anita walton developer, mary wilson marketing, kelly olson designer, even parker developer, julie lehrer marketing, carol daniel designer, miller bails developer, john snow marketing, jasmin smith designer, jeff lehrer developer, angela smith marketing.
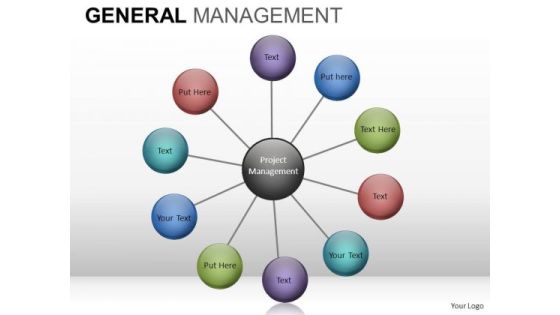
Wheel Chart Diagram PowerPoint Slides And Editable Ppt Templates Download
Wheel_Chart_Diagram_PowerPoint_slides_and_Editable_PPT_templates_Download-These high quality powerpoint pre-designed slides and powerpoint templates have been carefully created by our professional team to help you impress your audience. All slides have been created and are 100% editable in powerpoint. Each and every property of any graphic - color, size, orientation, shading, outline etc. can be modified to help you build an effective powerpoint presentation. Any text can be entered at any point in the powerpoint template or slide. Simply DOWNLOAD, TYPE and PRESENT! These PowerPoint presentation slides can be used to represent themes relating to --Abstract, action, analysis, blank, business, chart, clipart, commerce, concept, conceptual, design, diagram, direction, flow, generic, goals, guide, guidelines, heirarchy, icon, idea, illustration, lingakes, links, manage, management, mba, model, organization, performance, plan, process, project, relationship, representation, resource, steps, strategy, success, tactics, theoretical, theory, tool, workflow-Wheel_Chart_Diagram_PowerPoint_slides_and_Editable_PPT_templates_Download

Enhancing Organic Reach Social Media Team Organizational Chart Demonstration PDF
The following slide showcases social media team hierarchal structure. It provides information about chief marketing officer CMO, social media manager, community manager, content creator, social media analyst, campaign manager, subject matter expert, etc. Retrieve professionally designed Enhancing Organic Reach Social Media Team Organizational Chart Demonstration PDF to effectively convey your message and captivate your listeners. Save time by selecting pre-made slideshows that are appropriate for various topics, from business to educational purposes. These themes come in many different styles, from creative to corporate, and all of them are easily adjustable and can be edited quickly. Access them as PowerPoint templates or as Google Slides themes. You dont have to go on a hunt for the perfect presentation because Slidegeeks got you covered from everywhere.

Optimizing Social Networks Social Media Team Organizational Chart Brochure PDF
The following slide showcases social media team hierarchal structure. It provides information about chief marketing officer CMO, social media manager, community manager, content creator, social media analyst, campaign manager, subject matter expert, etc. Slidegeeks has constructed Optimizing Social Networks Social Media Team Organizational Chart Brochure PDF after conducting extensive research and examination. These presentation templates are constantly being generated and modified based on user preferences and critiques from editors. Here, you will find the most attractive templates for a range of purposes while taking into account ratings and remarks from users regarding the content. This is an excellent jumping-off point to explore our content and will give new users an insight into our top-notch PowerPoint Templates.

 Home
Home