AI PPT Maker
Templates
PPT Bundles
Design Services
Business PPTs
Business Plan
Management
Strategy
Introduction PPT
Roadmap
Self Introduction
Timelines
Process
Marketing
Agenda
Technology
Medical
Startup Business Plan
Cyber Security
Dashboards
SWOT
Proposals
Education
Pitch Deck
Digital Marketing
KPIs
Project Management
Product Management
Artificial Intelligence
Target Market
Communication
Supply Chain
Google Slides
Research Services
 One Pagers
All Categories
-
Home
- Customer Favorites
- Scoring Chart
Scoring Chart

Cross Functional Hr And Accounting Procedure Flow Chart Sample PDF
This slide consists of a diagrammatical representation of cross functional flow chart which provides insights about the human resource and accounting process. The elements are closed payroll cycle, enter new employee information, enter correct information, verify, send for review etc. Showcasing this set of slides titled Cross Functional Hr And Accounting Procedure Flow Chart Sample PDF. The topics addressed in these templates are Correct Information, Employee Information, Overtime Approval. All the content presented in this PPT design is completely editable. Download it and make adjustments in color, background, font etc. as per your unique business setting.

Big Data Analytics Procedure Flow Chart Portrait PDF
This slide showcases big data analysis process to enable access of enormous information and extracting meaningful insights. It includes elements such as data gathering, data integration, data cleaning, extraction and transformation Pitch your topic with ease and precision using this Big Data Analytics Procedure Flow Chart Portrait PDF. This layout presents information on Raw Data, Flow Chart, Big Data. It is also available for immediate download and adjustment. So, changes can be made in the color, design, graphics or any other component to create a unique layout.

Five Factors Of Brand Equity Chart Presentation Images
This is a five factors of brand equity chart presentation images. This is a five stage process. The stages in this process are awareness, differentiation, consumer connection, accessibility, value. \n \n \n \n \n \n \n \n \n \n

Approve Leads Flow Chart Powerpoint Slide Presentation Tips
This is a approve leads flow chart powerpoint slide presentation tips. This is a seven stage process. The stages in this process are awareness, interest, decision, action, permission, engagement, call to action.
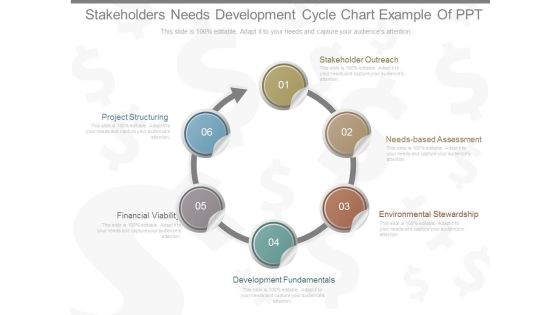
Stakeholders Needs Development Cycle Chart Example Of Ppt
This is a stakeholders needs development cycle chart example of ppt. This is a six stage process. The stages in this process are stakeholder outreach, needs based assessment, environmental stewardship,, development fundamentals, financial viability, project structuring.

Corporate Public Relation Puzzle Chart Powerpoint Slide Show
This is a corporate public relation puzzle chart powerpoint slide show. This is a nine stage process. The stages in this process are business partners, media, employees, customers, shareholders, investors, financial marketing, politics and state administration, pr.

Operational Flow Of Financial Services Chart Example Of Ppt
This is a operational flow of financial services chart example of ppt. This is a five stage process. The stages in this process are customer, mobile, atm, employees, high finance trading.

Real Estate Investing Cash Flow Chart Powerpoint Templates
This is a real estate investing cash flow chart powerpoint templates. This is a four stage process. The stages in this process are cash flow, tax benefits, debt pay down, appreciation.

Business And It Alignment Strategy Chart Powerpoint Slide Template
This is a business and it alignment strategy chart powerpoint slide template. This is a four stage process. The stages in this process are business strategy, it strategy, it architecture, business architecture.
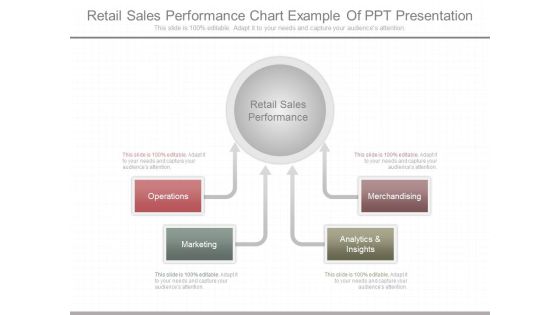
Retail Sales Performance Chart Example Of Ppt Presentation
This is a retail sales performance chart example of ppt presentation. This is a four stage process. The stages in this process are operations, marketing, analytics and insights, merchandising, retail sales performance.

Areas Of Qualitative Research Chart Powerpoint Slide Show
This is a areas of qualitative research chart powerpoint slide show. This is a nine stage process. The stages in this process are commercial, healthcare, communication, manufacturing, legal, financial,, education, government, technology.
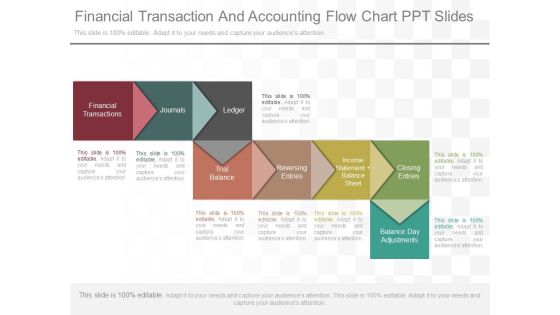
Financial Transaction And Accounting Flow Chart Ppt Slides
This is a financial transaction and accounting flow chart ppt slides. This is a eight stage process. The stages in this process are financial transactions, journals, ledger, trial balance, reversing entries, income statement balance sheet, closing entries, balance day adjustments.

Corporate Structure And Organization Chart Development Ppt Powerpoint Guide
This is a corporate structure and organization chart development ppt powerpoint guide. This is a six stage process. The stages in this process are relationship, structure, purpose, mechanisms, rewards, leadership.

Smart Business Solution Infographic Chart Example Of Ppt
This is a smart business solution infographic chart example of ppt. This is a nine stage process. The stages in this process are balance, vision, strategy, knowledge, mission, portfolio, precision, one touch, creativity.
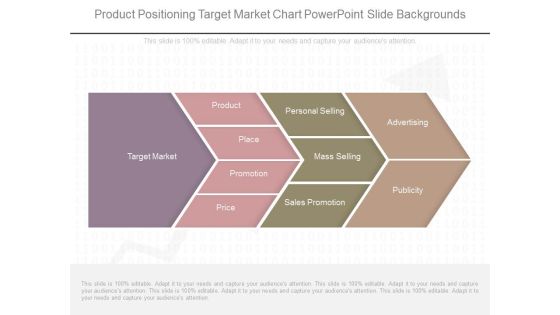
Product Positioning Target Market Chart Powerpoint Slide Backgrounds
This is a product positioning target market chart powerpoint slide backgrounds. This is a four stage process. The stages in this process are target market, product, place, promotion, price, personal selling, mass selling, sales promotion, advertising, publicity.
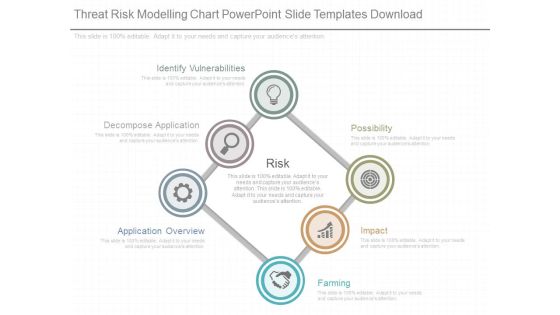
Threat Risk Modelling Chart Powerpoint Slide Templates Download
This is a threat risk modelling chart powerpoint slide templates download. This is a six stage process. The stages in this process are identify vulnerabilities, decompose application, application overview, possibility, impact, farming, risk.
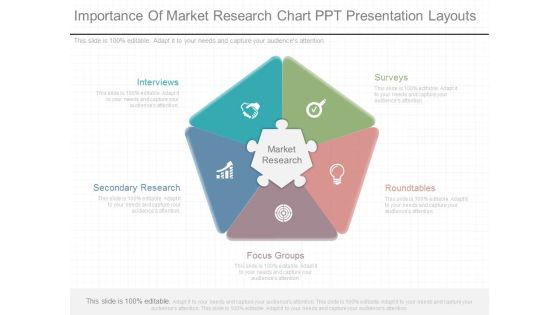
Importance Of Market Research Chart Ppt Presentation Layouts
This is a importance of market research chart ppt presentation layouts. This is a five stage process. The stages in this process are interviews, secondary research, market research, focus groups, surveys, roundtables.

Design Development New Product Chart Good Ppt Example
This is a design development new product chart good ppt example. This is a six stage process. The stages in this process are idea generation, marketing strategy development, product development, idea screening, concept development and testing, test marketing.
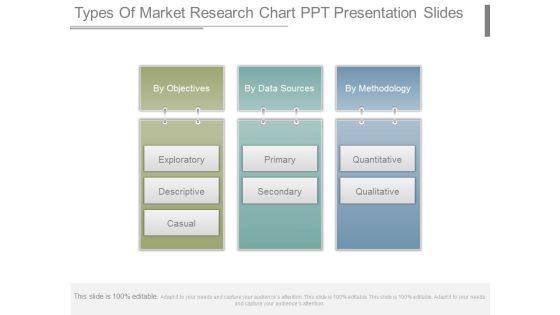
Types Of Market Research Chart Ppt Presentation Slides
This is a types of market research chart ppt presentation slides. This is a three stage process. The stages in this process are by objectives, exploratory, descriptive, causal, by data sources, primary, secondary, by methodology, quantitative, qualitative.
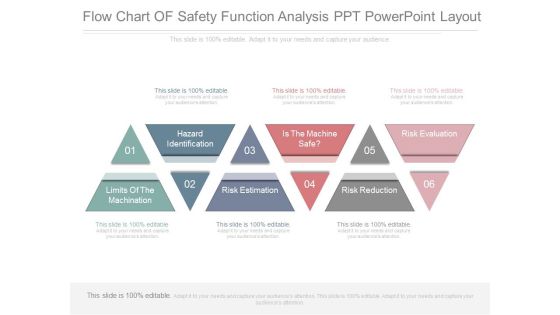
Flow Chart Of Safety Function Analysis Ppt Powerpoint Layout
This is a flow chart of safety function analysis ppt powerpoint layout. This is a six stage process. The stages in this process are hazard identification, limits of the machination, risk estimation, is the machine safe, risk reduction, risk evaluation.
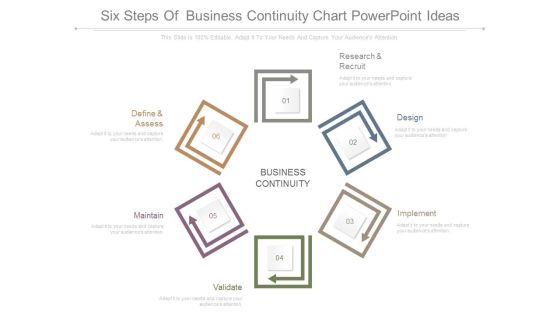
Six Steps Of Business Continuity Chart Powerpoint Ideas
This is a six steps of business continuity chart powerpoint ideas. This is a six stage process. The stages in this process are define and assess, research and recruit, design, implement, validate, maintain, business continuity.

International Market Segmentation Sample Flow Chart Powerpoint Layout
This is a international market segmentation sample flow chart powerpoint layout. This is a six stage process. The stages in this process are geographic, cultural, the firm, economic, industrial markets, political legal.
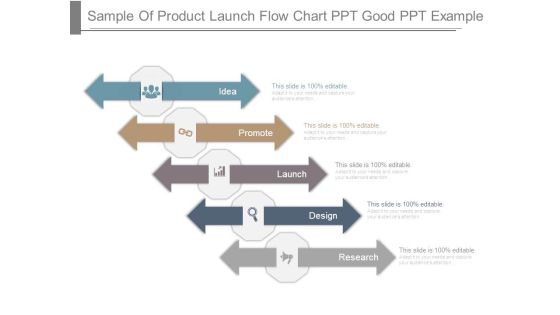
Sample Of Product Launch Flow Chart Ppt Good Ppt Example
This is a sample of product launch flow chart ppt good ppt example. This is a five stage process. The stages in this process are idea, promote, launch, design, research.
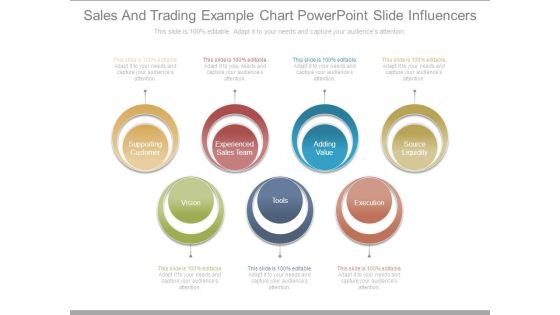
Sales And Trading Example Chart Powerpoint Slide Influencers
This is a sales and trading example chart powerpoint slide influencers. This is a seven stage process. The stages in this process are supporting customer, experienced sales team, adding value, source liquidity, vision, tools, execution.
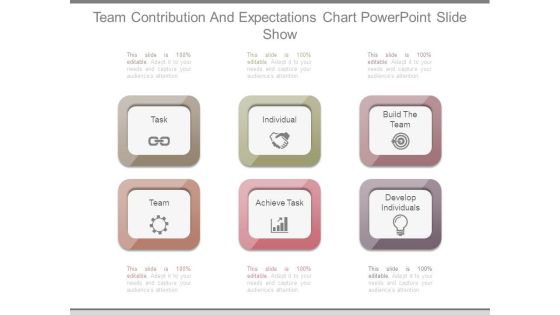
Team Contribution And Expectations Chart Powerpoint Slide Show
This is a team contribution and expectations chart powerpoint slide show. This is a six stage process. The stages in this process are task, individual, build the team, team, achieve task, develop individuals.

Tools To Measure Event Marketing Chart Powerpoint Slides Deck Template
This is a tools to measure event marketing chart powerpoint slides deck template. This is a six stage process. The stages in this process are cross functional, business intelligence, sales and promotion, going viral, driving roi, growing fans.

Business Intelligence Ecosystem Chart Example Of Ppt Presentation
This is a business intelligence ecosystem chart example of ppt presentation. This is a eight stage process. The stages in this process are strategy, data mining, customers, market, business outcome, leadership skills, suppliers, competition.

Enterprise Value Timing Factors Chart Ppt Examples Professional
This is a enterprise value timing factors chart ppt examples professional. This is a four stage process. The stages in this process are industry dynamics, company performance, organic growth, strategic acquisitions.

Cash Flow From Operations Chart Ppt Sample Presentations
This is a cash flow from operations chart ppt sample presentations. This is a six stage process. The stages in this process are uses of cash, operating activities, sources of cash, financing activities, investing activities, change in cash balance.

Closed Loop Life Cycle Chart Powerpoint Slide Backgrounds
This is a closed loop life cycle chart powerpoint slide backgrounds. This is a seven stage process. The stages in this process are consumption and use, results, manufacturing, materials sourcing, distribution logistics, sale and retail, underlying assumption.
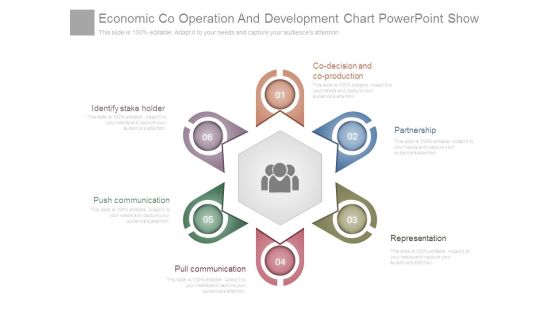
Economic Co Operation And Development Chart Powerpoint Show
This is a economic co operation and development chart powerpoint show. This is a six stage process. The stages in this process are co decision and co production, partnership, representation, pull communication, push communication, identify stake holder.
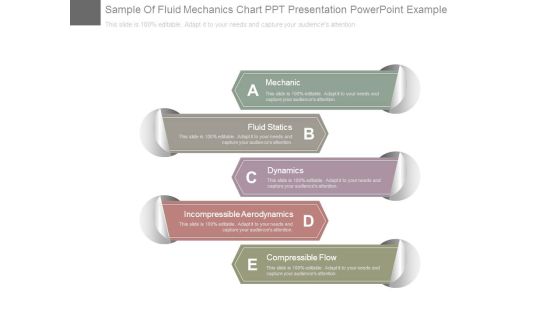
Sample Of Fluid Mechanics Chart Ppt Presentation Powerpoint Example
This is a sample of fluid mechanics chart ppt presentation powerpoint example. This is a five stage process. The stages in this process are mechanic, fluid statics, dynamics, incompressible aerodynamics, compressible flow.
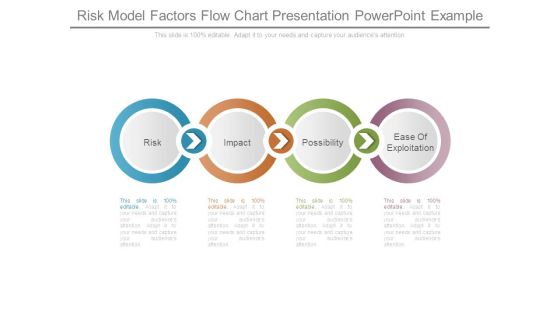
Risk Model Factors Flow Chart Presentation Powerpoint Example
This is a risk model factors flow chart presentation powerpoint example. This is a four stage process. The stages in this process are risk, impact, possibility, ease of exploitation.

Marketing Org Chart Example Powerpoint Slide Design Ideas
This is a marketing org chart example powerpoint slide design ideas. This is a four stage process. The stages in this process are strategic marketing, product marketing, interactive marketing, marketing organization.
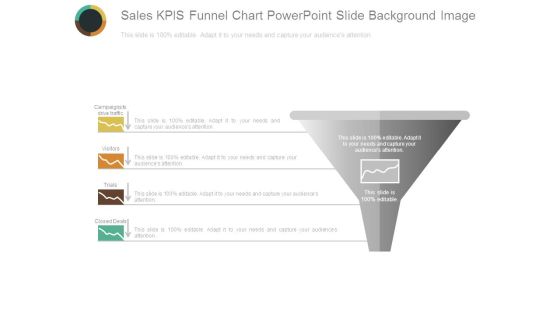
Sales Kpis Funnel Chart Powerpoint Slide Background Image
This is a sales kpis funnel chart powerpoint slide background image. This is a one stage process. The stages in this process are campaigns to drive traffic, visitors, trials, closed deals, sales.

Break Point Chart For Quality Analysis Powerpoint Slide Show
This is a break point chart for quality analysis powerpoint slide show. This is a one stage process. The stages in this process are total variable costs, fixed costs, quality sold.

Our Product Vs Competition Analysis Chart Powerpoint Slide Background Designs
This is a our product vs competition analysis chart powerpoint slide background designs. This is a four stage process. The stages in this process are business, marketing, success, strategy, compare.
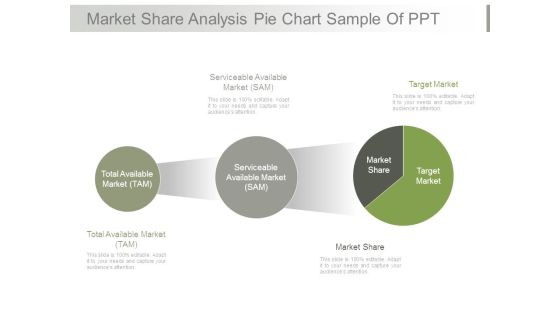
Market Share Analysis Pie Chart Sample Of Ppt
This is a market share analysis pie chart sample of ppt. This is a three stage process. The stages in this process are serviceable available market sam, target market, total available market tam, market share.

And R Chart For Six Sigma Powerpoint Slide Background Designs
This is a and r chart for six sigma powerpoint slide background designs. This is a two stage process. The stages in this process are subtitle, option, lcl, ucl.

Kano Analysis Line Chart Powerpoint Slide Design Ideas
This is a kano analysis line chart powerpoint slide design ideas. This is a three stage process. The stages in this process are customer needs in the kano model, exciter, performance, basic, implementation level.

Possible Solutions Puzzle Circular Chart Powerpoint Slide Background Image
This is a possible solutions puzzle circular chart powerpoint slide background image. This is a four stage process. The stages in this process are puzzles, business, problem, solution, game pieces, marketing.

Six Sigma Linear Circles Chart Presentation Powerpoint Templates
This is a six sigma linear circles chart presentation powerpoint templates. This is a five stage process. The stages in this process are bottom line, trained individuals, engagement, project by project, customer focused.

Approaches Of Market Targeting Chart Ppt Images Gallery
This is a approaches of market targeting chart ppt images gallery. This is a three stage process. The stages in this process are undifferentiated approaches, differentiated approaches, concentrated approaches.
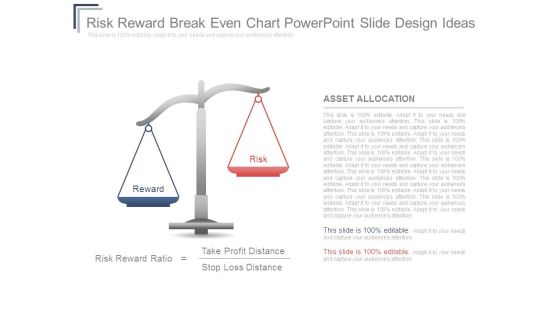
Risk Reward Breakeven Chart Powerpoint Slide Design Ideas
This is a risk reward breakeven chart powerpoint slide design ideas. This is a two stage process. The stages in this process are reward, risk, asset allocation, risk reward ratio, take profit distance, stop loss distance.
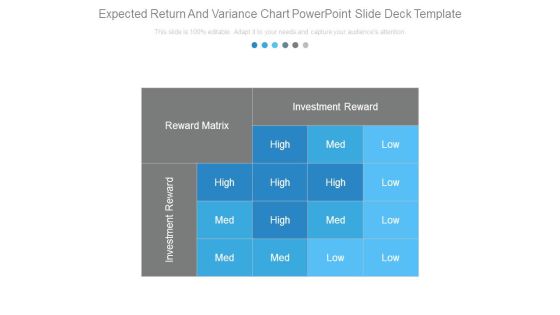
Expected Return And Variance Chart Powerpoint Slide Deck Template
This is a expected return and variance chart powerpoint slide deck template. This is a one stage process. The stages in this process are investment reward, reward matrix, high, med, low.
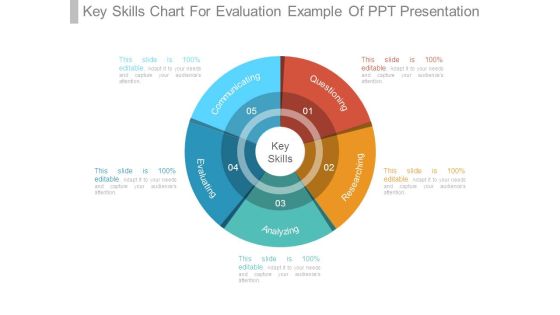
Key Skills Chart For Evaluation Example Of Ppt Presentation
This is a key skills chart for evaluation example of ppt presentation. This is a five stage process. The stages in this process are communicating, questioning, researching, analyzing, evaluating, key skills.
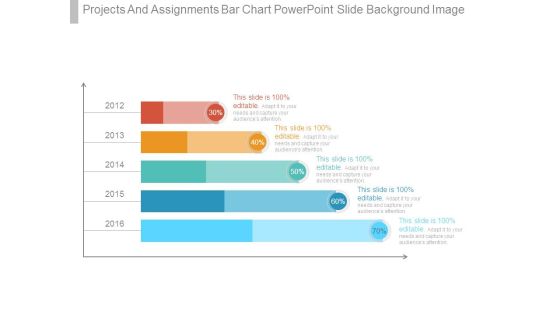
Projects And Assignments Bar Chart Powerpoint Slide Background Image
This is a projects and assignments bar chart powerpoint slide background image. This is a five stage process. The stages in this process are finance, presentation, business, strategy, marketing.

Customer Loyalty Circle Chart Powerpoint Slide Templates Download
This is a customer loyalty circle chart powerpoint slide templates download. This is a six stage process. The stages in this process are grow, engage, attract, reward, retain, loyalty.
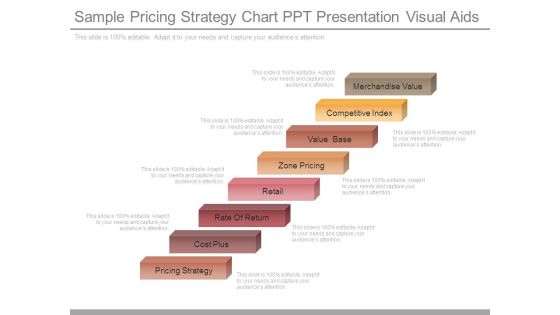
Sample Pricing Strategy Chart Ppt Presentation Visual Aids
This is a sample pricing strategy chart ppt presentation visual aids. This is a eight stage process. The stages in this process are merchandise value, competitive index, value base, zone pricing, retail, rate of return, cost plus, pricing strategy.

Corporate Strategy Hierarchy Chart Powerpoint Slide Presentation Tips
This is a corporate strategy hierarchy chart powerpoint slide presentation tips. This is a four stage process. The stages in this process are corporate strategy, business strategy, functional area strategies, operating strategies.
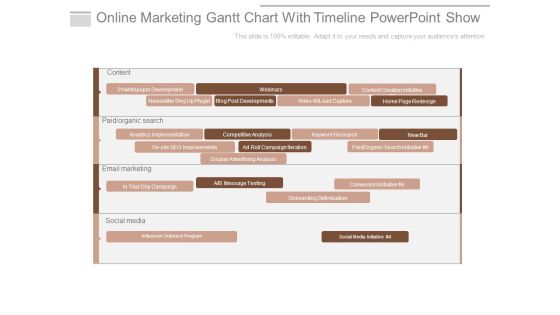
Online Marketing Gantt Chart With Timeline Powerpoint Show
This is a online marketing gantt chart with timeline powerpoint show. This is a four stage process. The stages in this process are content, whitepaper development, webinars, email marketing, social media, content creation initiative, conversion initiative.

Competitor Analysis 2 X 2 Matrix Chart Powerpoint Slide Show
This is a competitor analysis 2 x 2 matrix chart powerpoint slide show. This is a four stage process. The stages in this process are competitor, your company, competitor, complex, simple, fast, slow.

Four Steps Chart For Formation Of Strategy Powerpoint Templates
This is a four steps chart for formation of strategy powerpoint templates. This is a four stage process. The stages in this process are corporate strategy, business strategy, functional area strategies, operating strategies.
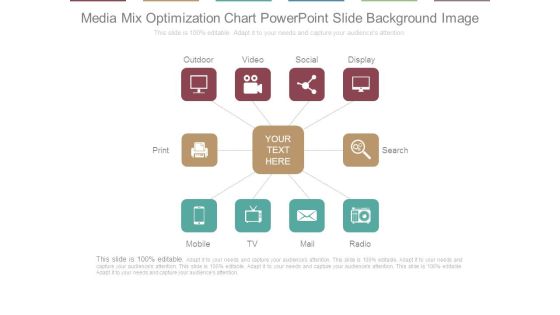
Media Mix Optimization Chart Powerpoint Slide Background Image
This is a media mix optimization chart powerpoint slide background image. This is a ten stage process. The stages in this process are outdoor, video, social, display, search, radio, mail, tv, mobile, print.

Curve Chart For Product Life Cycle Presentation Outline
This is a curve chart for product life cycle presentation outline. This is a five stage process. The stages in this process are sales over time, product extension, introduction, growth, maturity, decline, time.

Product Roadmap Product Launch Deliverables Gantt Chart Ppt Example
This is a product roadmap product launch deliverables gantt chart ppt example. This is a three stage process. The stages in this process are product launch deliverables, product family, product.
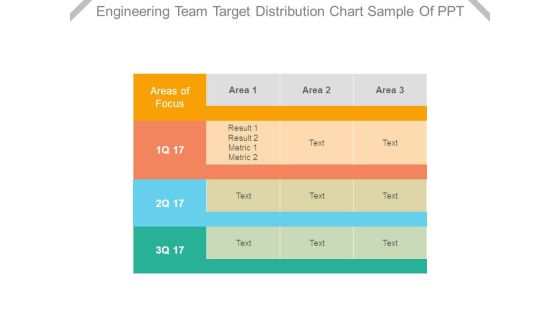
Engineering Team Target Distribution Chart Sample Of Ppt
This is a engineering team target distribution chart sample of ppt. This is a three stage process. The stages in this process are areas of focus, area, result, metric.

Pie Chart For Current Sources Of Profit Ppt Background Template
This is a pie chart for current sources of profit ppt background template. This is a five stage process. The stages in this process are finance, success, business, marketing, percentage, donut.
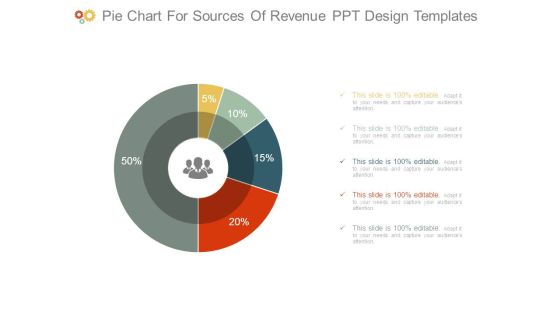
Pie Chart For Sources Of Revenue Ppt Design Templates
This is a pie chart for sources of revenue ppt design templates. This is a five stage process. The stages in this process are finance, success, business, marketing, percentage, donut.
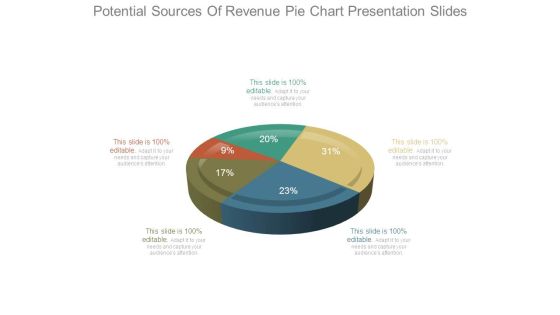
Potential Sources Of Revenue Pie Chart Presentation Slides
This is a potential sources of revenue pie chart presentation slides. This is a five stage process. The stages in this process are finance, success, business, marketing, percentage, pie.
