Scoring Chart

Quality Cost Report Trend Chart Ppt PowerPoint Presentation Pictures Themes
This is a quality cost report trend chart ppt powerpoint presentation pictures themes. This is a four stage process. The stages in this process are finance, strategy, marketing, management, business.
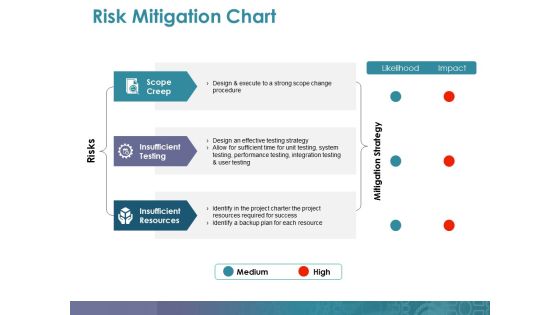
Risk Mitigation Chart Ppt PowerPoint Presentation Professional Guidelines
This is a risk mitigation chart ppt powerpoint presentation professional guidelines. This is a three stage process. The stages in this process are scope creep, insufficient testing, insufficient resources, mitigation strategy, risks.

Percentage Chart For Good Marketing Strategy Powerpoint Slides
This PowerPoint template has been designed with pie chart and percentage values. The PowerPoint template has a high quality design. You can download this PowerPoint slide to make good marketing strategy and business plans.

Five Column Chart For Business Review Ppt PowerPoint Presentation Diagrams
This is a five column chart for business review ppt powerpoint presentation diagrams. This is a five stage process. The stages in this process are business, marketing, bulb, icon, management.

Donut Pie Chart Product Finance Ppt PowerPoint Presentation Diagram Ppt
This is a donut pie chart product finance ppt powerpoint presentation diagram ppt. This is a three stage process. The stages in this process are finance, management, strategy, analysis, marketing.
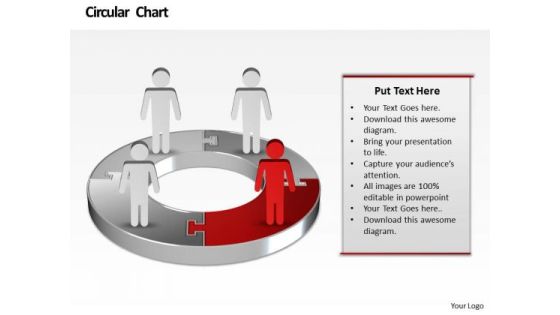
Ppt Illustration Of Financial Pie Chart Marketing Presentation PowerPoint Templates
PPT illustration of financial pie chart marketing presentation powerpoint Templates-You have the people in place, selected the team leaders and all are raring to go. You have the plans ready for them to absorb and understand. Educate your team with your thoughts and logic. -PPT illustration of financial pie chart marketing presentation powerpoint Templates-Abstract, Access, Arrow, Background, Business, Chart, Circle, Concept, Conceptual, Connection, Corporate, Creative, Cycle, Design, Different, Element, Empty, Form, Frame, Graphic, Group, Idea, Illustration, Part, Piece, Place, Process, Red, Shapes, Solution, Special, Speech, Strategy, Symbol

Automated Email Flow Chart Ppt Powerpoint Presentation Infographics Show
This is a automated email flow chart ppt powerpoint presentation infographics show. This is a three stage process. The stages in this process are check email, achieve, process inbox, do i want replay now, create task in task manager.

Our Market Research Plan Gantt Chart Powerpoint Slide Backgrounds
This is a our market research plan gantt chart powerpoint slide backgrounds. This is a nine stage process. The stages in this process are jan, feb, mar, apr, may.

Succession Planning Modelling Chart Ppt PowerPoint Presentation Professional Gridlines
This is a succession planning modelling chart ppt powerpoint presentation professional gridlines. This is a three stage process. The stages in this process are compare, marketing, business, management, planning.
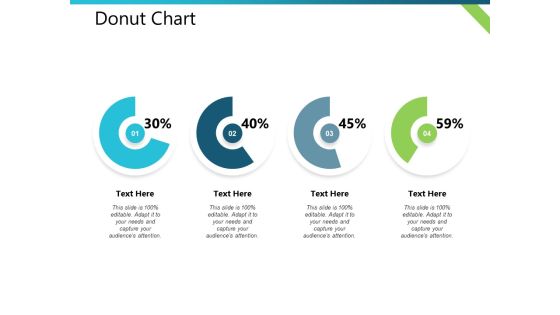
Donut Chart Distribution Plan Ppt PowerPoint Presentation Visual Aids Outline
This is a donut chart distribution plan ppt powerpoint presentation visual aids outline. This is a four stage process. The stages in this process are business, management, financial, marketing, strategy.

Bubble Chart Employee Value Proposition Ppt PowerPoint Presentation Icon Sample
This is a bubble chart employee value proposition ppt powerpoint presentation icon sample. This is a two stage process. The stages in this process are business, management, strategy, analysis, marketing.

Agile Kanban Methodology Chart With Stories Formats PDF
This slide explains Kanban Methodology through a chart that shows User Story Details, Tasks to be done, Tasks in progress Product Development, Software Quality Check, Testing to be done Automation Processes, Cycle Time Analysis and the activities that are ready to be deployed. Deliver an awe-inspiring pitch with this creative agile kanban methodology chart with stories formats pdf bundle. Topics like agile kanban methodology chart with stories can be discussed with this completely editable template. It is available for immediate download depending on the needs and requirements of the user.

Content Sharing Gantt Chart With Key Milestones Elements PDF
This slide showcases content distribution Gantt chart that can help to keep track the progress of online marketing process. Its key elements are target audience research, decide content, audit content, content distribution channel decision, KPIs, built editorial content and distribute plus market you content Showcasing this set of slides titled content sharing gantt chart with key milestones elements pdf. The topics addressed in these templates are content sharing gantt chart with key milestones. All the content presented in this PPT design is completely editable. Download it and make adjustments in color, background, font etc. as per your unique business setting.
Financial Chart For Investment Portfolio Management Vector Icon Rules PDF
Persuade your audience using this financial chart for investment portfolio management vector icon rules pdf. This PPT design covers three stages, thus making it a great tool to use. It also caters to a variety of topics including financial chart for investment portfolio management vector icon. Download this PPT design now to present a convincing pitch that not only emphasizes the topic but also showcases your presentation skills.
Human Resource Management Responsibilities Icon With Hierarchy Chart Guidelines PDF
Persuade your audience using this Human Resource Management Responsibilities Icon With Hierarchy Chart Guidelines PDF This PPT design covers four stages, thus making it a great tool to use. It also caters to a variety of topics including Human Resource Management Responsibilities Icon With Hierarchy Chart Download this PPT design now to present a convincing pitch that not only emphasizes the topic but also showcases your presentation skills.
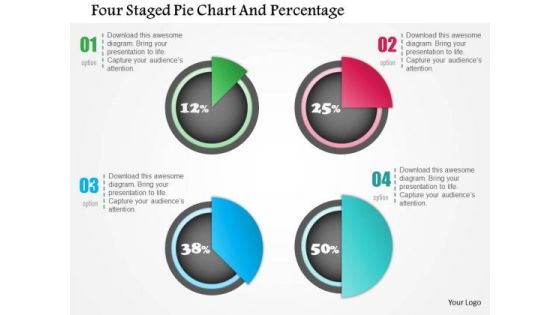
Business Diagram Four Staged Pie Chart And Percentage Presentation Template
Four staged pie chart and percentage values has been used to design this power point template. This PPT contains the concept of financial result analysis. Use this PPT for business and marketing related presentations.
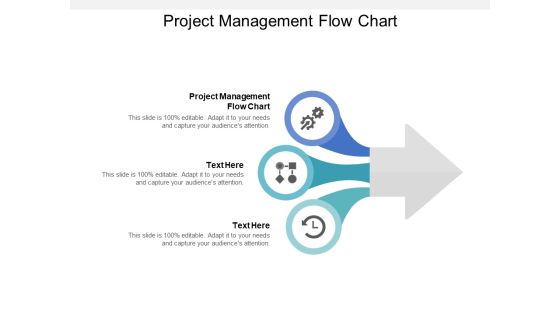
Project Management Flow Chart Ppt PowerPoint Presentation Show Pictures
Presenting this set of slides with name project management flow chart ppt powerpoint presentation show pictures. This is an editable Powerpoint three stages graphic that deals with topics like project management flow chart to help convey your message better graphically. This product is a premium product available for immediate download and is 100 percent editable in Powerpoint. Download this now and use it in your presentations to impress your audience.

Quarterly Resource Management Allocation Plan Chart Ppt Summary Visuals PDF
This slide illustrates task and resource allocation chart of a corporation. It includes department namely administration, accounts, IT, etc. Pitch your topic with ease and precision using this Quarterly Resource Management Allocation Plan Chart Ppt Summary Visuals PDF. This layout presents information on Quarter, Year, Accounts. It is also available for immediate download and adjustment. So, changes can be made in the color, design, graphics or any other component to create a unique layout.
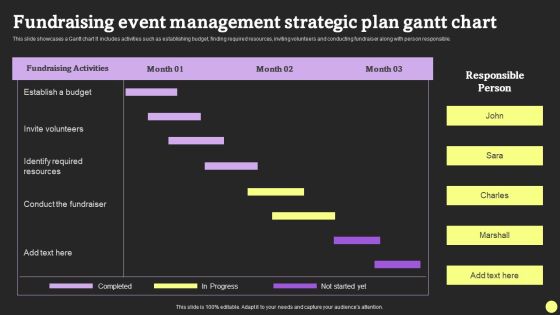
Fundraising Event Management Strategic Plan Gantt Chart Formats PDF
This slide showcases a Gantt chart It includes activities such as establishing budget, finding required resources, inviting volunteers and conducting fundraiser along with person responsible. Pitch your topic with ease and precision using this Fundraising Event Management Strategic Plan Gantt Chart Formats PDF. This layout presents information on Fundraising Activities, Invite Volunteers, Conduct The Fundraiser. It is also available for immediate download and adjustment. So, changes can be made in the color, design, graphics or any other component to create a unique layout.

Staked Line Chart Ppt PowerPoint Presentation Model Graphics Download
This is a staked line chart ppt powerpoint presentation model graphics download. This is a two stage process. The stages in this process are business, marketing, growth, finance, management.
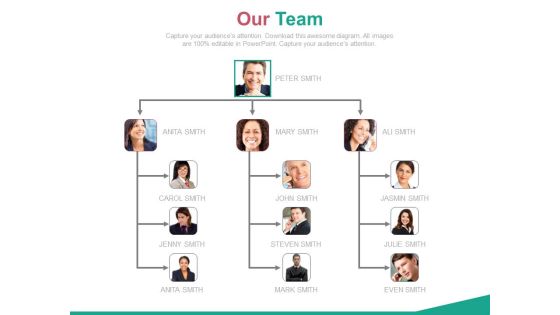
Organizational Chart For Business Intelligence Team Powerpoint Slides
Our above PowerPoint template displays an organizational chart with team pictures. This PPT slide may be used to display working of business intelligence team. You may download this PPT slide to present topics like team strategy and success.

Customer Plan Comparison Chart Ppt Powerpoint Presentation Infographic Template Portrait
This is a customer plan comparison chart ppt powerpoint presentation infographic template portrait. This is a four stage process. The stages in this process are customer service strategy, customer service plan, customer service approach.
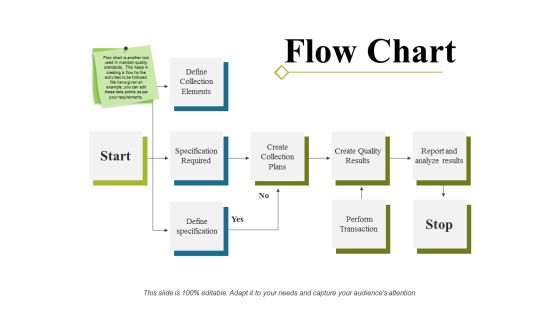
Flow Chart Ppt PowerPoint Presentation File Layout Ideas
This is a flow chart ppt powerpoint presentation file layout ideas. This is a four stage process. The stages in this process are define collection elements, specification required, define specification, create collection plans, create quality results, perform transaction.

Real Estate Pie Chart Infographic Ppt PowerPoint Presentation Designs Download
This is a real estate pie chart infographic ppt powerpoint presentation designs download. This is a four stage process. The stages in this process are business, planning, management, marketing, strategy.

Business Evolution Chart Ppt PowerPoint Presentation Inspiration Graphics Tutorials
This is a business evolution chart ppt powerpoint presentation inspiration graphics tutorials. This is a three stage process. The stages in this process are marketing, business, management, planning, strategy.
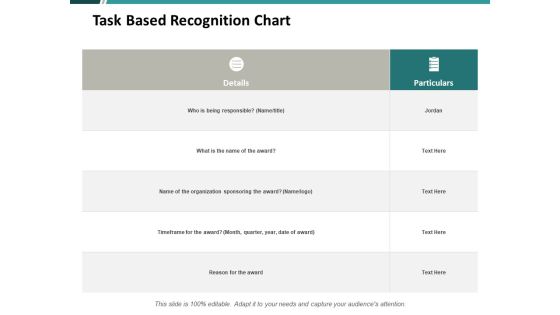
Task Based Recognition Chart Ppt PowerPoint Presentation Infographics Pictures
This is a task based recognition chart ppt powerpoint presentation infographics pictures. This is a three stage process. The stages in this process are compare, marketing, business, management, planning.

Leverage Securities Estimation Chart Ppt PowerPoint Presentation Professional Structure
This is a leverage securities estimation chart ppt powerpoint presentation professional structure. This is a three stage process. The stages in this process are compare, marketing, business, management, planning.

Decision Support And Knowledge Based Systems Chart Powerpoint Images
This is a decision support and knowledge based systems chart powerpoint images. This is a eight stage process. The stages in this process are situation, operational management, tactical management, options, state problem, analyse, strategic management, action.
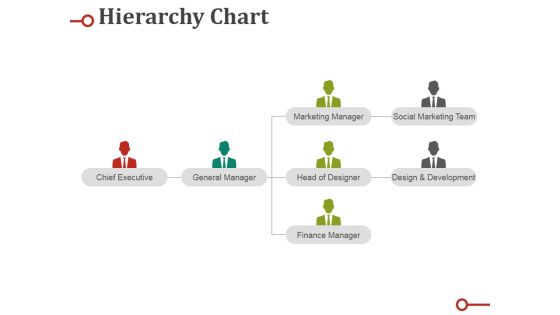
Hierarchy Chart Ppt PowerPoint Presentation Infographic Template Designs Download
This is a hierarchy chart ppt powerpoint presentation infographic template designs download. This is a four stage process. The stages in this process are chief executive, general manager, marketing manager, head of designer, finance manager.
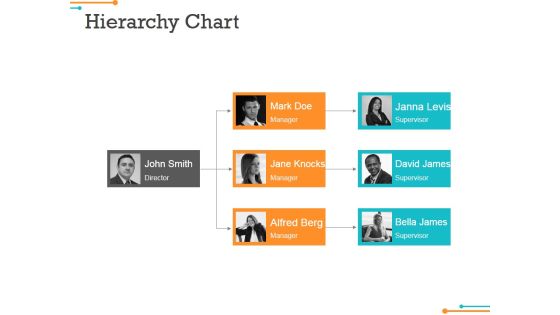
Hierarchy Chart Ppt Powerpoint Presentation Portfolio Slide Portrait
This is a hierarchy chart ppt powerpoint presentation portfolio slide portrait. This is a three stage process. The stages in this process are john smith director, mark doe manager, jane knocks manager.

Scatter Bubble Chart Graph Ppt PowerPoint Presentation Infographic Template Maker
This is a scatter bubble chart graph ppt powerpoint presentation infographic template maker. This is a two stage process. The stages in this process are finance, marketing, management, investment, analysis.

Competitive Analysis Matrix Chart Ppt PowerPoint Presentation Portfolio Format Ideas
This is a competitive analysis matrix chart ppt powerpoint presentation portfolio format ideas. This is a six stage process. The stages in this process are our business, product quality, product fidelity, after sales service, customer service.

Scatter Bubble Chart Ppt PowerPoint Presentation Inspiration Backgrounds
This is a scatter bubble chart ppt powerpoint presentation inspiration backgrounds. This is a five stage process. The stages in this process are highest sale, in price, business, marketing, success.

Area Chart Ppt PowerPoint Presentation Layouts Graphics Example
This is a area chart ppt powerpoint presentation layouts graphics example. This is a two stage process. The stages in this process are sales in percentage, financial year, business, marketing, presentation.

Dmaic Process Control And Improvement Chart Sample Ppt Presentation
This is a dmaic process control and improvement chart sample ppt presentation. This is a five stage process. The stages in this process are toll gate review, define, the opportunities, measure, the performance, analyse, the performance, improve, the performance, control, the performance, activities to be executed at each phase, relational tools techniques acquired, expected deliverables at each phase.

Hierarchy Chart For Sales Team Ppt PowerPoint Presentation Samples
This is a hierarchy chart for sales team ppt powerpoint presentation samples. This is a six stage process. The stages in this process are business, marketing, technology, product, management.
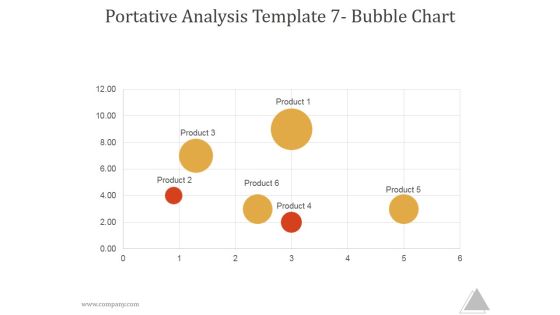
Portative Analysis Template 7 Bubble Chart Ppt PowerPoint Presentation Picture
This is a portative analysis template 7 bubble chart ppt powerpoint presentation picture. This is a six stage process. The stages in this process are product, business, marketing, management.

Competitive Analysis Scatter Chart Ppt PowerPoint Presentation Background Designs
This is a competitive analysis scatter chart ppt powerpoint presentation background designs. This is a three stage process. The stages in this process are competitive analysis, business, management, marketing, strategy.

Volume Open High Low Close Chart Ppt PowerPoint Presentation Show
This is a volume open high low close chart ppt powerpoint presentation show. This is a five stage process. The stages in this process are product, marketing, business, management, strategy.

Vision And Mission Statement Chart Ppt PowerPoint Presentation Model Demonstration
This is a vision and mission statement chart ppt powerpoint presentation model demonstration. This is a two stage process. The stages in this process are vision, mission, business, strategy, management.
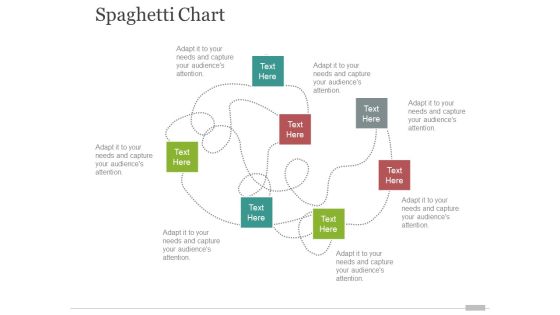
spaghetti chart template 2 ppt powerpoint presentation inspiration portfolio
This is a spaghetti chart template 2 ppt powerpoint presentation inspiration portfolio. This is a seven stage process. The stages in this process are business, marketing, management, analysis, strategy.

Brand Positioning Chart Ppt PowerPoint Presentation Outline Slide Download
This is a brand positioning chart ppt powerpoint presentation outline slide download. This is a five stage process. The stages in this process are quality, own product, business, management, matrix.

Scatter Bubble Chart Ppt PowerPoint Presentation Inspiration Graphics Tutorials
This is a scatter bubble chart ppt powerpoint presentation inspiration graphics tutorials. This is a two stage process. The stages in this process are finance, marketing, management, investment, analysis.

Area Chart Ppt PowerPoint Presentation Infographic Template Clipart Images
This is a area chart ppt powerpoint presentation infographic template clipart images. This is a two stage process. The stages in this process are finance, marketing, management, investment, analysis.

Bar Chart Ppt PowerPoint Presentation Infographic Template Graphics Design
This is a bar chart ppt powerpoint presentation infographic template graphics design. This is a five stage process. The stages in this process are management, marketing, business, percentage, product.

Area Chart Talent Mapping Ppt PowerPoint Presentation Ideas Vector
This is a area chart talent mapping ppt powerpoint presentation ideas vector. This is a three stage process. The stages in this process are business, management, strategy, analysis, marketing.

Combo Chart Talent Mapping Ppt PowerPoint Presentation Inspiration Display
This is a combo chart talent mapping ppt powerpoint presentation inspiration display. This is a three stage process. The stages in this process are business, management, strategy, analysis, marketing.

Area Chart Product Marketing Ppt PowerPoint Presentation Layouts Portfolio
This is a area chart product marketing ppt powerpoint presentation layouts portfolio. This is a three stage process. The stages in this process are business, management, strategy, analysis, marketing.

Combo Chart Strategy Approaches Ppt PowerPoint Presentation Inspiration Layout Ideas
This is a combo chart strategy approaches ppt powerpoint presentation inspiration layout ideas. This is a three stage process. The stages in this process are business, management, strategy, analysis, marketing.

Column Chart Sample Budget Ppt Ppt PowerPoint Presentation Infographics Brochure
This is a column chart sample budget ppt ppt powerpoint presentation infographics brochure. This is a two stage process. The stages in this process are business, management, strategy, analysis, marketing.

Bubble Chart Marketing Business Ppt PowerPoint Presentation Model Sample
This is a bubble chart marketing business ppt powerpoint presentation model sample. This is a two stage process. The stages in this process are finance, business, management, strategy, analysis.
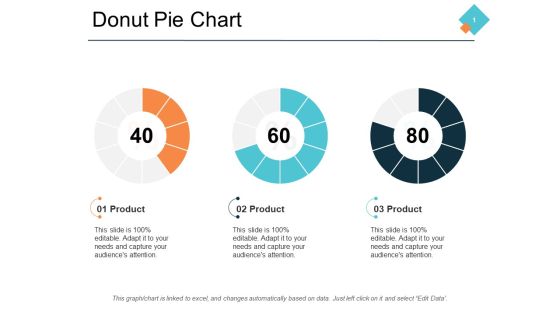
Donut Pie Chart Finance Ppt PowerPoint Presentation Portfolio Model
This is a donut pie chart finance ppt powerpoint presentation portfolio model. This is a three stage process. The stages in this process are finance, management, strategy, analysis, marketing.

Area Chart Finance Ppt PowerPoint Presentation Infographic Template Model
This is a area chart finance ppt powerpoint presentation infographic template model. This is a two stage process. The stages in this process are finance, marketing, management, investment, analysis.

Column Chart And Graph Ppt PowerPoint Presentation File Introduction
This is a column chart and graph ppt powerpoint presentation file introduction. This is a three stage process. The stages in this process are finance, marketing, management, investment, analysis.

Area Chart Finance Ppt PowerPoint Presentation Infographic Template Graphics Template
This is a area chart finance ppt powerpoint presentation infographic template graphics template. This is a two stage process. The stages in this process are finance, marketing, management, investment, analysis.

Combo Chart Finance Ppt PowerPoint Presentation Summary Design Ideas
This is a combo chart finance ppt powerpoint presentation summary design ideas. This is a three stage process. The stages in this process are finance, marketing, management, investment, analysis.

Donut Pie Chart Graph Ppt PowerPoint Presentation File Styles
This is a donut pie chart graph ppt powerpoint presentation file styles. This is a three stage process. The stages in this process are finance, marketing, management, investment, analysis.

Donut Pie Chart Graph Ppt PowerPoint Presentation Ideas Guidelines
This is a donut pie chart graph ppt powerpoint presentation ideas guidelines. This is a three stage process. The stages in this process are finance, marketing, management, investment, analysis.
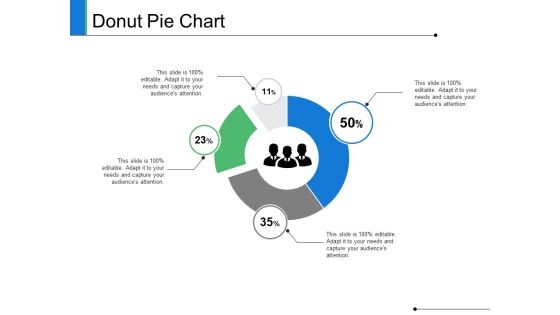
Donut Pie Chart Finance Ppt PowerPoint Presentation Styles Deck
This is a donut pie chart finance ppt powerpoint presentation styles deck. This is a four stage process. The stages in this process are finance, marketing, management, investment, analysis.
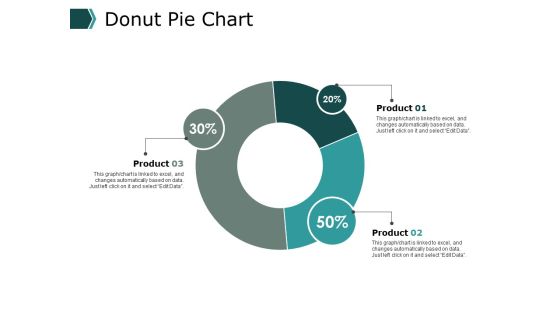
Donut Pie Chart Finance Ppt PowerPoint Presentation File Slide Download
This is a donut pie chart finance ppt powerpoint presentation file slide download. This is a three stage process. The stages in this process are finance, marketing, management, investment, analysis.

 Home
Home