Sales Trend

Statistical Analytics Report Showing Evolution Of Sales Industry Diagrams PDF
The following slide showcases a comprehensive analytical report highlighting the evolution of sales industry over the years. It provides information about sales cycle, state of the sales industry, etc. Showcasing this set of slides titled statistical analytics report showing evolution of sales industry diagrams pdf. The topics addressed in these templates are sales, technologies, system. All the content presented in this PPT design is completely editable. Download it and make adjustments in color, background, font etc. as per your unique business setting.

Monthly Sales Volume Report With Graph Demonstration PDF
The following slide highlights the monthly sales volume report with graph illustrating key headings which includes sales report, current month sales volume and current month volume vs last month volume. Showcasing this set of slides titled Monthly Sales Volume Report With Graph Demonstration PDF. The topics addressed in these templates are Monthly Sales, Volume Report, Graph. All the content presented in this PPT design is completely editable. Download it and make adjustments in color, background, font etc. as per your unique business setting.

Food Company Overview Product Sales By Category Structure PDF
The slide showcases the details of product sales by category for food, beverages and dairy products. It also illustrates sales split for every product in each category.Deliver an awe inspiring pitch with this creative Food Company Overview Product Sales By Category Structure PDF bundle. Topics like Dairy Products, Sales Of Beverages, Sales Of Food can be discussed with this completely editable template. It is available for immediate download depending on the needs and requirements of the user.

Employees Sales Performance Comparison Circle Chart Topics PDF
This slide shows the sales share percentage chart by salespersons to gain an understanding of the performance of employees. It includes teams and their sales percentage. Pitch your topic with ease and precision using this Employees Sales Performance Comparison Circle Chart Topics PDF. This layout presents information on Employees Sales Performance, Comparison Circle Chart. It is also available for immediate download and adjustment. So, changes can be made in the color, design, graphics or any other component to create a unique layout.
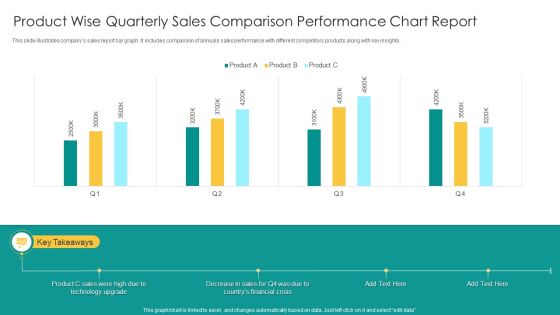
Product Wise Quarterly Sales Comparison Performance Chart Report Infographics PDF
This slide illustrates companys sales report bar graph. It includes comparison of annuals sales performance with different competitors products along with key insights. Showcasing this set of slides titled Product Wise Quarterly Sales Comparison Performance Chart Report Infographics PDF. The topics addressed in these templates are Product C Sales, Technology Upgrade, Financial Crisis. All the content presented in this PPT design is completely editable. Download it and make adjustments in color, background, font etc. as per your unique business setting.
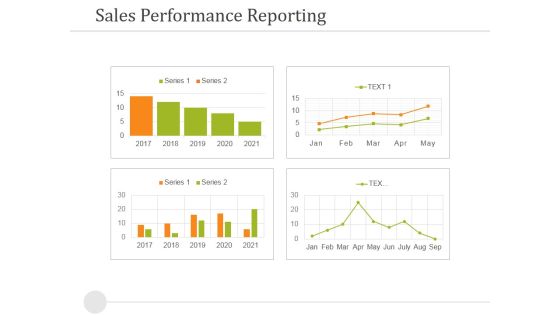
Sales Performance Reporting Ppt PowerPoint Presentation Outline Outfit
This is a sales performance reporting ppt powerpoint presentation outline outfit. This is a four stage process. The stages in this process are sales performance reporting, business, success, strategy, finance.

Business Sales And Revenue Summary Dashboard Brochure PDF
This slide exhibits sales report dashboards that provides information of sales activities and performance in financial year. It includes elements such as average weekly sales revenue, customer acquisition cost, customer lifetime value and sales target. Pitch your topic with ease and precision using this Business Sales And Revenue Summary Dashboard Brochure PDF. This layout presents information on Average Revenue, Customer Lifetime, Customer Acquisition. It is also available for immediate download and adjustment. So, changes can be made in the color, design, graphics or any other component to create a unique layout.

Sales KPI Framework Ppt PowerPoint Presentation Gallery Show PDF
The mentioned slide depicts the sales key performance indicators framework. This includes monthly sales growth, monthly calls and emails, leads to sales percentage and average conversion time. Presenting sales kpi framework ppt powerpoint presentation gallery show pdf to dispense important information. This template comprises four stages. It also presents valuable insights into the topics including growth, sales, emails This is a completely customizable PowerPoint theme that can be put to use immediately. So, download it and address the topic impactfully.

B2B Sales Representative Insights Dashboard Ppt Icon PDF
This slide covers the sales reps dashboard wherein teams contribution to leads, managing SQLs and revenue targets are evaluated.Deliver an awe-inspiring pitch with this creative B2B sales representative insights dashboard ppt icon pdf. bundle. Topics like sales representatives leads actual, sales representatives revenue actual, revenue pace can be discussed with this completely editable template. It is available for immediate download depending on the needs and requirements of the user.

Retail Outlet Dashboard With Sales Kpis Clipart PDF
This slide covers a metrics dashboard for tracking retail store sales. It includes KPIs such as sales square foot per location, net profit, revues, shrinkage, customer retention rate, etc. Pitch your topic with ease and precision using this retail outlet dashboard with sales kpis clipart pdf This layout presents information on Retail outlet dashboard with sales kpis It is also available for immediate download and adjustment. So, changes can be made in the color, design, graphics or any other component to create a unique layout.

Dashboard Depicting Sales Kpis To Track Current Status Structure PDF
This slide shows the dashboard that depicts sales KPIs to track current status which involves won and lost opportunities, revenues and pipeline by territory, sales by different products, etc. Deliver and pitch your topic in the best possible manner with this Dashboard Depicting Sales Kpis To Track Current Status Structure PDF. Use them to share invaluable insights on Total Opportunities, Revenue By Territory, Sales By Product and impress your audience. This template can be altered and modified as per your expectations. So, grab it now.

B2B Sales Representative Insights Dashboard Ppt Summary PDF
This slide covers the sales reps dashboard wherein teams contribution to leads, managing SQLs and revenue targets are evaluated.Deliver an awe-inspiring pitch with this creative B2B sales representative insights dashboard ppt summary pdf. bundle. Topics like sales representatives leads actual, sales representatives revenue actual, revenue pace can be discussed with this completely editable template. It is available for immediate download depending on the needs and requirements of the user.
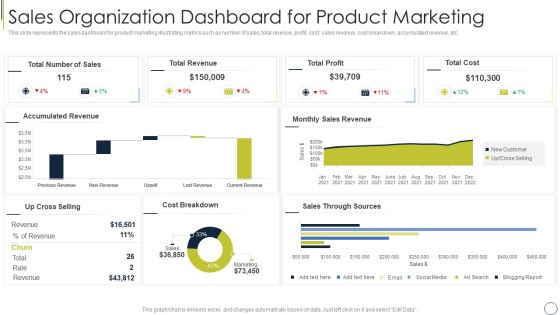
Sales Organization Dashboard For Product Marketing Themes PDF
This slide represents the sales dashboard for product marketing illustrating metrics such as number of sales, total revenue, profit, cost, sales revenue, cost breakdown, accumulated revenue, etc. Pitch your topic with ease and precision using this sales organization dashboard for product marketing themes pdf. This layout presents information on total cost, total profit, total revenue. It is also available for immediate download and adjustment. So, changes can be made in the color, design, graphics or any other component to create a unique layout.
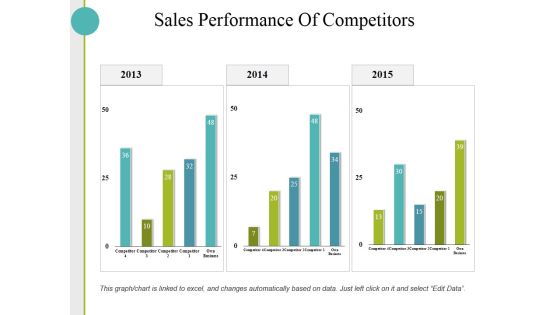
Sales Performance Of Competitors Ppt PowerPoint Presentation Show Graphics Download
This is a sales performance of competitors ppt powerpoint presentation show graphics download. This is a three stage process. The stages in this process are business, finance, marketing, strategy, sales.
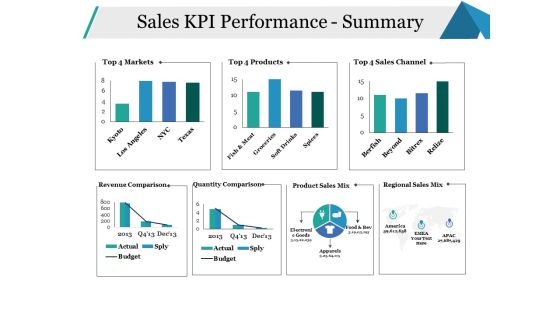
Sales KPI Performance Summary Ppt PowerPoint Presentation Infographics Model
This is a sales kpi performance summary ppt powerpoint presentation infographics model. This is a seven stage process. The stages in this process are sales channel, revenue comparison, quantity comparison, business, marketing.

Sales Performance Of Competitors Ppt PowerPoint Presentation Portfolio Summary
This is a sales performance of competitors ppt powerpoint presentation portfolio summary. This is a three stage process. The stages in this process are business, management, sales, finance, analysis.
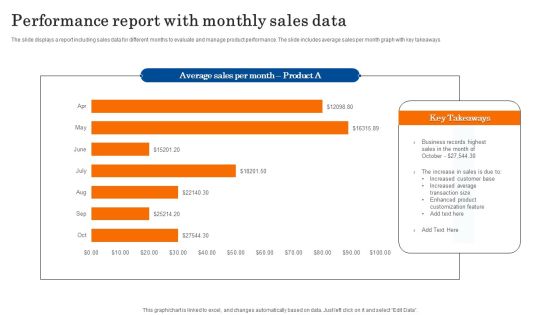
Performance Report With Monthly Sales Data Diagrams PDF
The slide displays a report including sales data for different months to evaluate and manage product performance. The slide includes average sales per month graph with key takeaways. Showcasing this set of slides titled Performance Report With Monthly Sales Data Diagrams PDF. The topics addressed in these templates are Business, Sales, Customization. All the content presented in this PPT design is completely editable. Download it and make adjustments in color, background, font etc. as per your unique business setting.
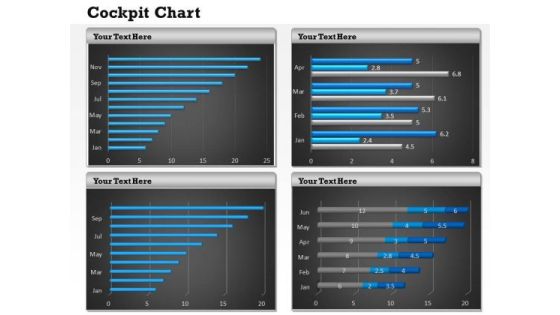
Sales Diagram Visual Design Of Dashboard Strategy Diagram
Dominate Proceedings With Your Ideas. Our Sales Diagram Visual Design Of Dashboard Strategy Diagram Powerpoint Templates Will Empower Your Thoughts.

Marketing Diagram Dashboard Design For Business Sales Diagram
Your Listeners Will Never Doodle. Our Marketing Diagram Dashboard Design For Business Sales Diagram Powerpoint Templates Will Hold Their Concentration.

Strategy Diagram Meter Design For Business Progress Sales Diagram
Our Strategy Diagram Meter Design For Business Progress Sales Diagram Powerpoint Templates Abhor Doodling. They Never Let The Interest Flag.
Streamlining B2B Sales Models For Enhanced Performance Icons PDF
This slide provides information regarding streamlining B2B sales models for improved productivity by assessing different sales models based in cost per transaction and degree of sales interaction and aligning organizational strengths with prospects requirements. This is a Streamlining B2B Sales Models For Enhanced Performance Icons PDF template with various stages. Focus and dispense information on three stages using this creative set, that comes with editable features. It contains large content boxes to add your information on topics like Sales Interaction, Cost Per Transaction, Direct Sale. You can also showcase facts, figures, and other relevant content using this PPT layout. Grab it now.

Sales Team Performance Management Pyramid Of Enterprise Brochure PDF
This slide represents the performance management pyramid of the sales team of an enterprise. It includes details related to performance goals, indicators and drivers along with sales results, objectives and activities. Persuade your audience using this Sales Team Performance Management Pyramid Of Enterprise Brochure PDF. This PPT design covers six stages, thus making it a great tool to use. It also caters to a variety of topics including Sales Results, Sales Objectives, Sales Activities. Download this PPT design now to present a convincing pitch that not only emphasizes the topic but also showcases your presentation skills.

Organizational Chart For Hotel Sales And Marketing Department Guidelines PDF
This slide covers organisation structure chart for large hotels. It includes key stakeholders such as general manager, resident manager, sales and marketing director, convention sales director, PR and advertising director, online marketing director, etc. Persuade your audience using this Organizational Chart For Hotel Sales And Marketing Department Guidelines PDF. This PPT design covers six stages, thus making it a great tool to use. It also caters to a variety of topics including Convention Sales Manager, Sales Representatives, Convention Sales Manager. Download this PPT design now to present a convincing pitch that not only emphasizes the topic but also showcases your presentation skills.
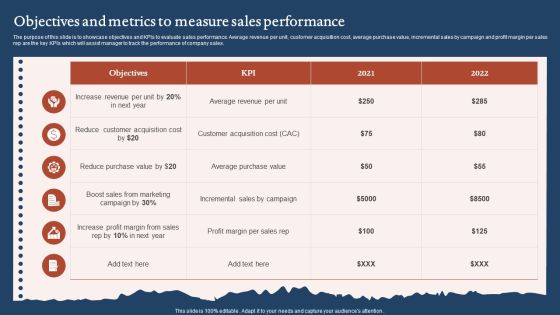
Objectives And Metrics To Measure Sales Performance Sample PDF
The purpose of this slide is to showcase objectives and KPIs to evaluate sales performance. Average revenue per unit, customer acquisition cost, average purchase value, incremental sales by campaign and profit margin per sales rep are the key KPIs which will assist manager to track the performance of company sales. Showcasing this set of slides titled Objectives And Metrics To Measure Sales Performance Sample PDF. The topics addressed in these templates are Reduce Purchase Value, Increase Profit Margin, Customer Acquisition Cost. All the content presented in this PPT design is completely editable. Download it and make adjustments in color, background, font etc. as per your unique business setting.
Monthly Sales Performance Tracking And Monitoring Dashboard Sample PDF
This slide showcases a dashboard presenting various metrics to measure and analyze sales performance for revenue growth. It includes key components such as number of sales, revenue, profit, cost, sales revenue, sales increment, cost analysis and cross sell. Do you have to make sure that everyone on your team knows about any specific topic I yes, then you should give Monthly Sales Performance Tracking And Monitoring Dashboard Sample PDF a try. Our experts have put a lot of knowledge and effort into creating this impeccable Monthly Sales Performance Tracking And Monitoring Dashboard Sample PDF. You can use this template for your upcoming presentations, as the slides are perfect to represent even the tiniest detail. You can download these templates from the Slidegeeks website and these are easy to edit. So grab these today.

Quarterly Sales Performance Action Plan Dashboard Mockup PDF
This slide elaborated about he overall quarterly sales details and the target goal projections that has to be achieved within a stipulated time. Pitch your topic with ease and precision using this Quarterly Sales Performance Action Plan Dashboard Mockup PDF. This layout presents information on Sales, Target, Goal. It is also available for immediate download and adjustment. So, changes can be made in the color, design, graphics or any other component to create a unique layout.

Sales Strategy Performance Dashboard With Revenue And Target Designs PDF
This slide shows a Sales Strategy Performance Dashboard with variables such as new customers acquired, revenue generated, revenue vs target comparison etc. Deliver and pitch your topic in the best possible manner with this sales strategy performance dashboard with revenue and target designs pdf. Use them to share invaluable insights on sales strategy performance dashboard with revenue and target and impress your audience. This template can be altered and modified as per your expectations. So, grab it now.

Dashboard Depicting Sales And Customer Analytics Professional PDF
This slide focuses on dashboard that depicts sales and customer analytics which covers sales revenue, average transaction rate, out of stock items, sales by division, monthly visitors, etc. Make sure to capture your audiences attention in your business displays with our gratis customizable Dashboard Depicting Sales And Customer Analytics Professional PDF. These are great for business strategies, office conferences, capital raising or task suggestions. If you desire to acquire more customers for your tech business and ensure they stay satisfied, create your own sales presentation with these plain slides.

Annual Sales Team Performance And Collaboration Dashboard Themes PDF
This slide signifies the dashboard on sales team performance and coordination. It includes total revenue generated, employee performance pie chart, Products sold and income by customer location Showcasing this set of slides titled Annual Sales Team Performance And Collaboration Dashboard Themes PDF The topics addressed in these templates are Annual Sales, Team Performance, Collaboration Dashboard All the content presented in this PPT design is completely editable. Download it and make adjustments in color, background, font etc. as per your unique business setting.

Sales Monitoring Dashboard With Monthly Qualified Leads Guidelines PDF
This slide showcases dashboard that can help organization to monitor the sales pipeline velocity and predict future sales more accurately plus increase the leads converted. Its key components are monthly qualified leads, win rate based on deal size, monthly sales cycle and number of leads at each stage of pipeline. Pitch your topic with ease and precision using this Sales Monitoring Dashboard With Monthly Qualified Leads Guidelines PDF. This layout presents information on Monthly Qualified, Monthly Sales Cycle, Deal Size. It is also available for immediate download and adjustment. So, changes can be made in the color, design, graphics or any other component to create a unique layout.

B2B Sales Representatives Performance Tracking Dashboard Elements PDF
This slide provides information regarding B2B sales representatives performance tracking dashboard to measure leads by region, revenue breakdown, top performers by leads, revenues, etc. Deliver an awe inspiring pitch with this creative B2B Sales Representatives Performance Tracking Dashboard Elements PDF bundle. Topics like Revenue Actual, Sales Representatives Performance, Tracking Dashboard can be discussed with this completely editable template. It is available for immediate download depending on the needs and requirements of the user.

Dashboard For Pharmaceutical Device Sales Performance Graphics PDF
This slide showcases sales performance dashboard od medical instruments. It includes elements such as the shipping information, order information and payment information. Showcasing this set of slides titled Dashboard For Pharmaceutical Device Sales Performance Graphics PDF. The topics addressed in these templates are Pharmaceutical Device, Sales Performance. All the content presented in this PPT design is completely editable. Download it and make adjustments in color, background, font etc. as per your unique business setting.
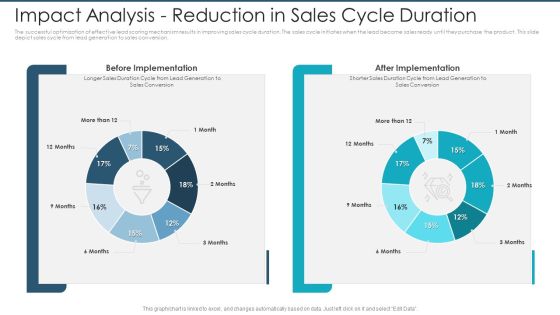
Impact Analysis Reduction In Sales Cycle Duration Infographics PDF
The successful optimization of effective lead scoring mechanism results in improving sales cycle duration. The sales cycle initiates when the lead become sales ready until they purchase the product. This slide depict sales cycle from lead generation to sales conversion.Deliver an awe-inspiring pitch with this creative impact analysis reduction in sales cycle duration infographics pdf. bundle. Topics like before implementation, after implementation can be discussed with this completely editable template. It is available for immediate download depending on the needs and requirements of the user.

Reduction In Sales Cycle Duration Improving Distribution Channel Slides PDF
The successful optimization of effective pipeline management solution results in improving sales cycle duration. The sales cycle initiates when the lead become sales ready until they purchase the product. This slide depict sales cycle from lead generation to sales conversion.Deliver and pitch your topic in the best possible manner with this Reduction In Sales Cycle Duration Improving Distribution Channel Slides PDF. Use them to share invaluable insights on Positive Momentum, Opportunities Progression, Enhance Engagement and impress your audience. This template can be altered and modified as per your expectations. So, grab it now.

Deliver Efficiency Innovation Dashboard Depicting Sales Product Performance Themes PDF
This slide focuses on dashboard that depicts sales product performance that includes top products in revenues, online verses offline purchases, incremental sales by campaign and cost of goods sold. Deliver an awe inspiring pitch with this creative Deliver Efficiency Innovation Dashboard Depicting Sales Product Performance Themes PDF bundle. Topics like Top Products Revenue, Online Vs Offline Purchases, Incremental Sales Campaign, Cost Goods Sold can be discussed with this completely editable template. It is available for immediate download depending on the needs and requirements of the user.

Information Technology Sales Team Accomplishment Evaluation Dashboard Rules PDF
This slide shows IT team performance management dashboard. It provides information about person, design, research and development, testing, launch, timeline, etc.Showcasing this set of slides titled information technology sales team accomplishment evaluation dashboard rules pdf The topics addressed in these templates are information technology sales team accomplishment evaluation dashboard All the content presented in this PPT design is completely editable. Download it and make adjustments in color, background, font etc. as per your unique business setting.
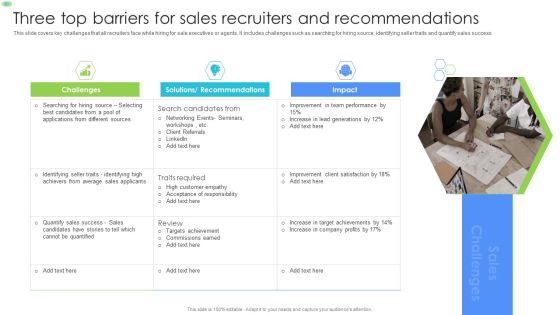
Three Top Barriers For Sales Recruiters And Recommendations Information PDF
This slide covers key challenges that all recruiters face while hiring for sale executives or agents. It includes challenges such as searching for hiring source, identifying seller traits and quantify sales success. Presenting Three Top Barriers For Sales Recruiters And Recommendations Information PDF to dispense important information. This template comprises three stages. It also presents valuable insights into the topics including Average Sales Applicants, Targets Achievement, Team Performance. This is a completely customizable PowerPoint theme that can be put to use immediately. So, download it and address the topic impactfully.

Sales Pipeline Analysis Dashboard With Kpis Structure PDF
Showcasing this set of slides titled sales pipeline analysis dashboard with kpis structure pdf. The topics addressed in these templates are sales pipeline analysis dashboard with kpis. All the content presented in this PPT design is completely editable. Download it and make adjustments in color, background, font etc. as per your unique business setting.
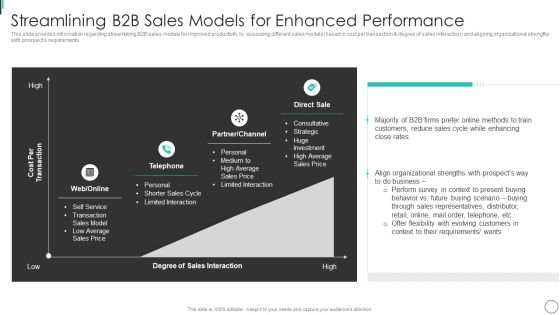
Streamlining B2B Sales Models For Enhanced Performance Portrait PDF
This slide provides information regarding streamlining B2B sales models for improved productivity by assessing different sales models based in cost per transaction degree of sales interaction and aligning organizational strengths with prospects requirements. Deliver and pitch your topic in the best possible manner with this Streamlining B2B Sales Models For Enhanced Performance Portrait PDF. Use them to share invaluable insights on Limited Interaction, Sales Interaction, Align Organizational and impress your audience. This template can be altered and modified as per your expectations. So, grab it now.
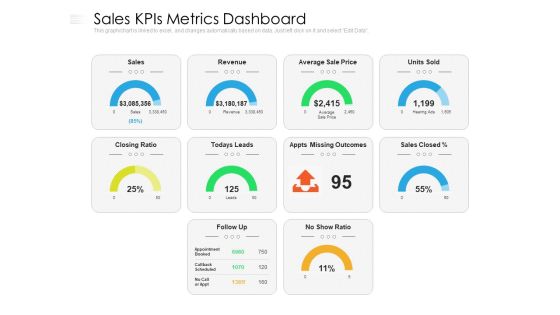
Sales Kpis Metrics Dashboard Ppt PowerPoint Presentation Gallery Demonstration PDF
Presenting this set of slides with name sales kpis metrics dashboard ppt powerpoint presentation gallery demonstration pdf. The topics discussed in these slides are sales, revenue, price. This is a completely editable PowerPoint presentation and is available for immediate download. Download now and impress your audience.

Executive Dashboards To Track Sales Performance Guidelines PDF
This slide represents the CEO dashboard for tracking the sales performance of the organization. It includes key performance indicators such as gross, operating and net profit, sales amount by category, income statement etc. Pitch your topic with ease and precision using this Executive Dashboards To Track Sales Performance Guidelines PDF. This layout presents information on Income Statement, Monthly Sales Growth, Days Receivable Outstanding. It is also available for immediate download and adjustment. So, changes can be made in the color, design, graphics or any other component to create a unique layout.

Weekly Sales Performance Report Of Restaurant Business Clipart PDF
The following slide exhibits restaurant report to track sales performance and essential KPIs such as leas-to-opportunity ratio. It presents information related to beverages, food discounts, etc. Pitch your topic with ease and precision using this Weekly Sales Performance Report Of Restaurant Business Clipart PDF. This layout presents information on Total Beverage Sales, Total Food Sales, Total Sales. It is also available for immediate download and adjustment. So, changes can be made in the color, design, graphics or any other component to create a unique layout.

Strategic Action Timeline For Implementing Sales Strategies Infographics PDF
This slide shows a Strategic Action Timeline of the company for successfully implementing sales strategy, in order to increase both online and offline sales via Direct Referrals and Facebook Ads, respectively. This slide also provides information on each strategys products, costing, projected sales, proposed deadline, key performance indicators etc. Deliver an awe-inspiring pitch with this creative strategic action timeline for implementing sales strategies infographics pdf. bundle. Topics like budgeted costs, projected sales, distribution strategy, proposed deadline, key performance indicators can be discussed with this completely editable template. It is available for immediate download depending on the needs and requirements of the user.

Manufactured Products Sales Performance Monitoring Dashboard Information PDF
This slide shows the dashboard the data related to the sales performance of the products manufactured by the organization in order to effectively measure and monitor the performance of the sales team. It shows details related to revenue generated and units sold etc.Pitch your topic with ease and precision using this Manufactured Products Sales Performance Monitoring Dashboard Information PDF. This layout presents information on Monthly Revenue, Manufactured Products, Sales Performance Monitoring. It is also available for immediate download and adjustment. So, changes can be made in the color, design, graphics or any other component to create a unique layout.
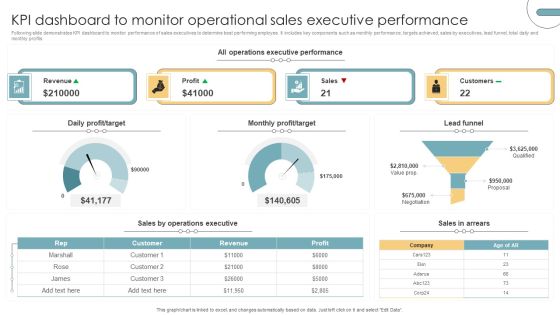
KPI Dashboard To Monitor Operational Sales Executive Performance Portrait PDF
Following slide demonstrates KPI dashboard to monitor performance of sales executives to determine best performing employee. It includes key components such as monthly performance, targets achieved, sales by executives, lead funnel, total daily and monthly profits. Pitch your topic with ease and precision using this KPI Dashboard To Monitor Operational Sales Executive Performance Portrait PDF. This layout presents information on Revenue, Profit, Sales, Customers. It is also available for immediate download and adjustment. So, changes can be made in the color, design, graphics or any other component to create a unique layout.

Client Management Kpis For Measuring Sales Performance Elements PDF
Showcasing this set of slides titled Client Management Kpis For Measuring Sales Performance Elements PDF. The topics addressed in these templates are Client Management Kpis For Measuring Sales Performance. All the content presented in this PPT design is completely editable. Download it and make adjustments in color, background, font etc. as per your unique business setting.

Sales Activities Dashboard Ppt PowerPoint Presentation Inspiration Clipart Images
This is a sales activities dashboard ppt powerpoint presentation inspiration clipart images. This is a two stage process. The stages in this process are sales activities dashboard, total activities, closed activities, activities per won deal.
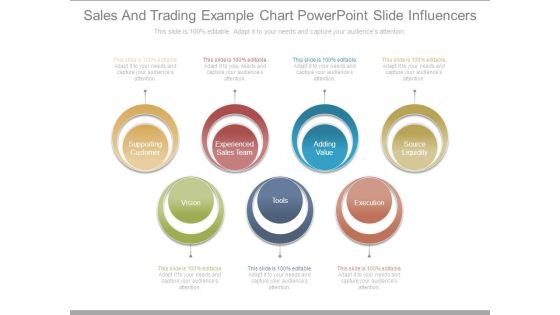
Sales And Trading Example Chart Powerpoint Slide Influencers
This is a sales and trading example chart powerpoint slide influencers. This is a seven stage process. The stages in this process are supporting customer, experienced sales team, adding value, source liquidity, vision, tools, execution.

Key Components Of Sales Growth Plan Clipart PDF
The slide showcases key elements included in plan to improve sales performance of business. It includes key elements like company mission positioning, sales organization structure, sales goals targets, target audience customer segments, etc.Persuade your audience using this Key Components Of Sales Growth Plan Clipart PDF This PPT design covers seven stages, thus making it a great tool to use. It also caters to a variety of topics including Sales Strategies, Sales Organization, Determine Target Download this PPT design now to present a convincing pitch that not only emphasizes the topic but also showcases your presentation skills.

Monthly Sales Report For New Performance Ideas PDF
The slide carries a monthly report to record and track sakes of new product after launch. Various elements included are units sold and total sales amount. Showcasing this set of slides titled Monthly Sales Report For New Performance Ideas PDF. The topics addressed in these templates are Monthly Sales Report, New Performance. All the content presented in this PPT design is completely editable. Download it and make adjustments in color, background, font etc. as per your unique business setting.
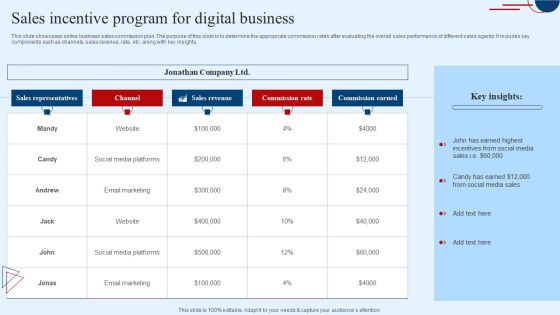
Sales Incentive Program For Digital Business Sample PDF
This slide showcases online business sales commission plan. The purpose of this slide is to determine the appropriate commission rates after evaluating the overall sales performance of different sales agents. It includes key components such as channels, sales revenue, rate, etc. along with key insights.Pitch your topic with ease and precision using this Sales Incentive Program For Digital Business Sample PDF. This layout presents information on Sales Representatives, Commission Rate. It is also available for immediate download and adjustment. So, changes can be made in the color, design, graphics or any other component to create a unique layout.
Sales Rep Performance Scorecard Ppt PowerPoint Presentation Icon Design Inspiration
This is a sales rep performance scorecard ppt powerpoint presentation icon design inspiration. This is a four stage process. The stages in this process are business, sales, performance, planning, management.
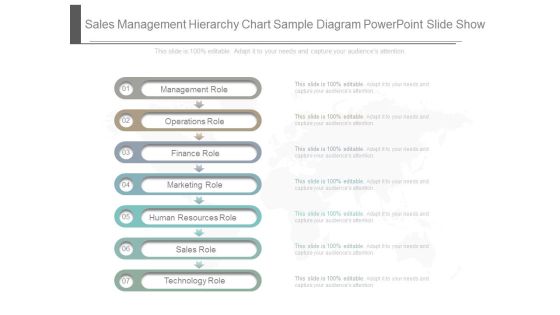
Sales Management Hierarchy Chart Sample Diagram Powerpoint Slide Show
This is a sales management hierarchy chart sample diagram powerpoint slide show. This is a seven stage process. The stages in this process are management role, operations role, finance role, marketing role, human resources role, sales role, technology role.
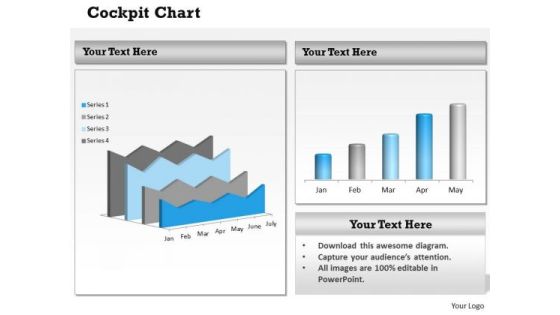
Consulting Diagram Business Dashboard Design Chart Sales Diagram
Document The Process On Our Consulting Diagram Business Dashboard Design Chart Sales Diagram Powerpoint Templates. Make A Record Of Every Detail.
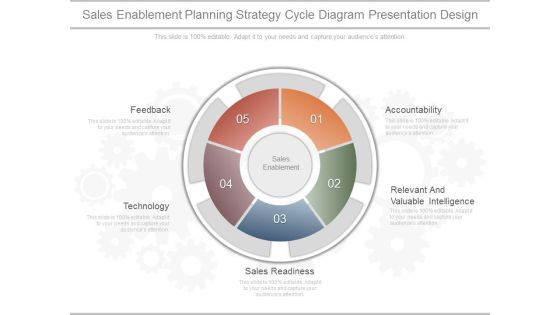
Sales Enablement Planning Strategy Cycle Diagram Presentation Design
This is a sales enablement planning strategy cycle diagram presentation design. This is a five stage process. The stages in this process are accountability, relevant and valuable intelligence, sales readiness, technology, feedback.
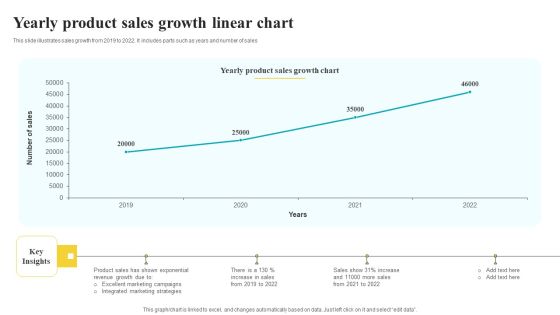
Yearly Product Sales Growth Linear Chart Pictures PDF
This slide illustrates sales growth from 2019 to 2022. It includes parts such as years and number of sales Pitch your topic with ease and precision using this Yearly Product Sales Growth Linear Chart Pictures PDF. This layout presents information on Sales Growth Chart, Key Insights, Strategies. It is also available for immediate download and adjustment. So, changes can be made in the color, design, graphics or any other component to create a unique layout.
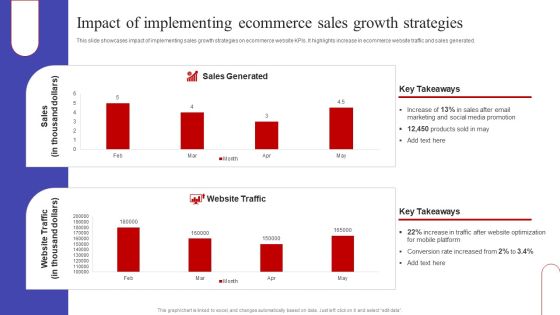
Impact Of Implementing Ecommerce Sales Growth Strategies Portrait PDF
This slide showcases impact of implementing sales growth strategies on ecommerce website KPIs. It highlights increase in ecommerce website traffic and sales generated. From laying roadmaps to briefing everything in detail, our templates are perfect for you. You can set the stage with your presentation slides. All you have to do is download these easy to edit and customizable templates. Impact Of Implementing Ecommerce Sales Growth Strategies Portrait PDF will help you deliver an outstanding performance that everyone would remember and praise you for. Do download this presentation today.

Regional Sales Percentage Column Chart With Key Insights Diagrams PDF
This slide illustrates sales percentage chart in regions of USA to calculate and interpret present fuel consumption. It includes parts such as regions and sales percentage.Pitch your topic with ease and precision using this Regional Sales Percentage Column Chart With Key Insights Diagrams PDF. This layout presents information on Industries Central, Sales Central, Productions Companies. It is also available for immediate download and adjustment. So, changes can be made in the color, design, graphics or any other component to create a unique layout.
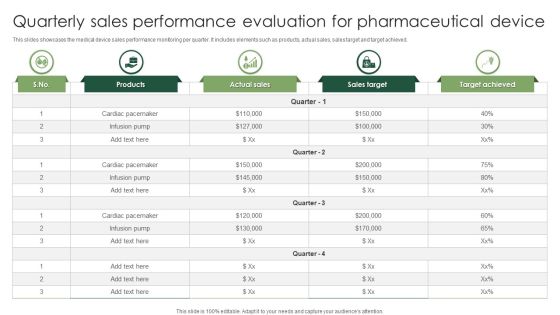
Quarterly Sales Performance Evaluation For Pharmaceutical Device Slides PDF
This slides showcases the medical device sales performance monitoring per quarter. It includes elements such as products, actual sales, sales target and target achieved. Pitch your topic with ease and precision using this Quarterly Sales Performance Evaluation For Pharmaceutical Device Slides PDF. This layout presents information on Cardiac Pacemaker, Infusion Pump. It is also available for immediate download and adjustment. So, changes can be made in the color, design, graphics or any other component to create a unique layout.

Weekly Sales Performance Report Of Fast Food Industry Slides PDF
The following slide exhibits report which identifies progress of sales team used to make data-driven adjustments. It presents information related to exports, current sales, etc. Showcasing this set of slides titled Weekly Sales Performance Report Of Fast Food Industry Slides PDF. The topics addressed in these templates are Outstanding Sales, Total Exports, Accumulated Exports. All the content presented in this PPT design is completely editable. Download it and make adjustments in color, background, font etc. as per your unique business setting.

 Home
Home