Sales Trend

Sales Kpi Performance Summary Ppt PowerPoint Presentation Show Inspiration
This is a sales kpi performance summary ppt powerpoint presentation show inspiration. This is a two stage process. The stages in this process are revenue comparison, quantity comparison, product sales mix, regional sales mix, budget.

Sales And Marketing Plan Gantt Chart Ppt Examples Slides
This is a sales and marketing plan gantt chart ppt examples slides. This is a three stage process. The stages in this process are sales goal, sales actual, banner ads, newspaper, in store marketing.
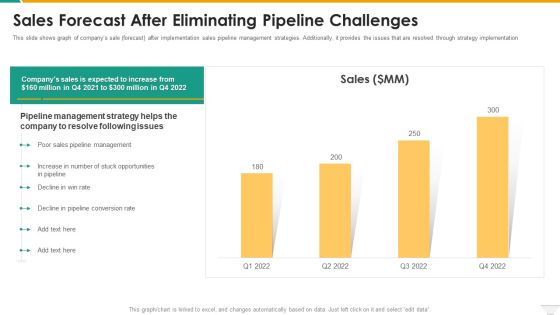
Sales Forecast After Eliminating Pipeline Challenges Guidelines PDF
This slide shows graph of companys sale forecast after implementation sales pipeline management strategies. Additionally, it provides the issues that are resolved through strategy implementation. Deliver and pitch your topic in the best possible manner with this Sales Forecast After Eliminating Pipeline Challenges Guidelines PDF. Use them to share invaluable insights on Management, Sales, Opportunities, Rate and impress your audience. This template can be altered and modified as per your expectations. So, grab it now.
Monthly Sales Performance Tracking And Monitoring Dashboard Diagrams PDF
This slide showcases a dashboard presenting various metrics to measure and analyze sales performance for revenue growth. It includes key components such as number of sales, revenue, profit, cost, sales revenue, sales increment, cost analysis and cross sell. Make sure to capture your audiences attention in your business displays with our gratis customizable Monthly Sales Performance Tracking And Monitoring Dashboard Diagrams PDF. These are great for business strategies, office conferences, capital raising or task suggestions. If you desire to acquire more customers for your tech business and ensure they stay satisfied, create your own sales presentation with these plain slides.
Monthly Sales Performance Tracking And Monitoring Dashboard Designs PDF
This slide showcases a dashboard presenting various metrics to measure and analyze sales performance for revenue growth. It includes key components such as number of sales, revenue, profit, cost, sales revenue, sales increment, cost analysis and cross sell. Make sure to capture your audiences attention in your business displays with our gratis customizable Monthly Sales Performance Tracking And Monitoring Dashboard Designs PDF. These are great for business strategies, office conferences, capital raising or task suggestions. If you desire to acquire more customers for your tech business and ensure they stay satisfied, create your own sales presentation with these plain slides.
Sales Performance Dashboard With Average Lead Tracking Time Background PDF
This slide showcases dashboard for sales performance that can help organization to analyze the effectiveness of sales campaigns and average response time of lead. Its key components are average contract value, average sales cycle length, follow up contract rate and sales activity. Showcasing this set of slides titled Sales Performance Dashboard With Average Lead Tracking Time Background PDF. The topics addressed in these templates are Avg Contract Value, Sales Activity, Contract Rate. All the content presented in this PPT design is completely editable. Download it and make adjustments in color, background, font etc. as per your unique business setting.

Yearly Sales Assessment Growth Review With Key Insights Infographics PDF
This slide represents sales review bar graph showing monthly sales growth in a financial year of an organization with amount and reason.It includes key insights. Showcasing this set of slides titled Yearly Sales Assessment Growth Review With Key Insights Infographics PDF. The topics addressed in these templates are Sale Figure, Demand, Services. All the content presented in this PPT design is completely editable. Download it and make adjustments in color, background, font etc. as per your unique business setting.

Sales Performance Optimization Ppt PowerPoint Presentation Slides Graphics Cpb
This is a sales performance optimization ppt powerpoint presentation slides graphics cpb. This is a three stage process. The stages in this process are sales performance optimization.
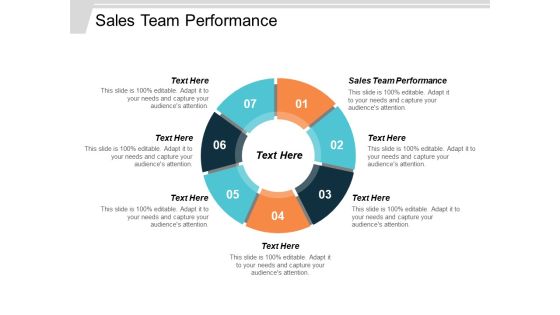
Sales Team Performance Ppt PowerPoint Presentation File Layouts Cpb
This is a sales team performance ppt powerpoint presentation file layouts cpb. This is a seven stage process. The stages in this process are sales team performance.
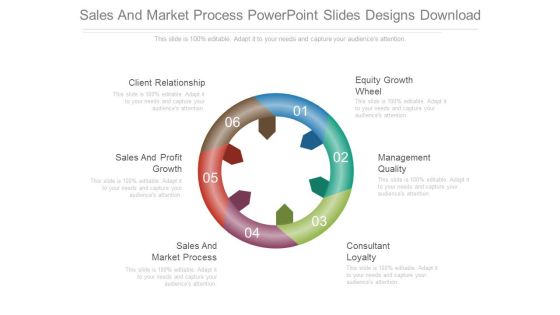
Sales And Market Process Powerpoint Slides Designs Download
This is a sales and market process powerpoint slides designs download. This is a six stage process. The stages in this process are client relationship, sales and profit growth, sales and market process, consultant loyalty, management quality, equity growth wheel.

Weekly Employee Representative Sales Performance Scorecard Guidelines PDF
Mentioned slide displays weekly employee sales performance scorecard for setting effective business sales goals. It includes key elements such as employees weekly sales, total sales, targeted sales and employee performance status. Showcasing this set of slides titled Weekly Employee Representative Sales Performance Scorecard Guidelines PDF. The topics addressed in these templates are Total Sales, Target Sales, Performance Status. All the content presented in this PPT design is completely editable. Download it and make adjustments in color, background, font etc. as per your unique business setting.
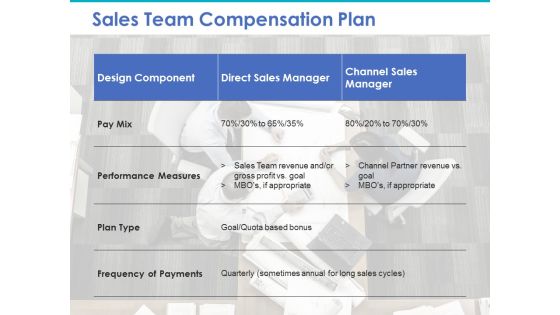
Sales Team Compensation Plan Ppt PowerPoint Presentation Outline Example File
This is a sales team compensation plan ppt powerpoint presentation outline example file. This is a three stage process. The stages in this process are design component, direct sales manager, channel sales manager, pay mix, performance measures.
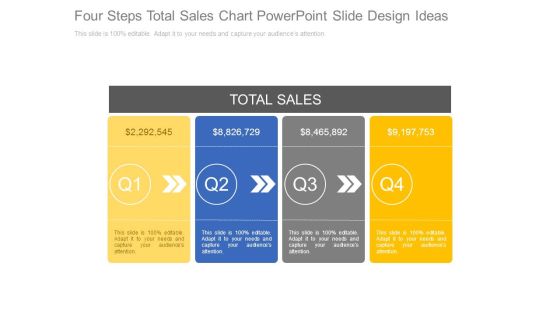
Four Steps Total Sales Chart Powerpoint Slide Design Ideas
This is a four steps total sales chart powerpoint slide design ideas. This is a four stage process. The stages in this process are total sales, marketing.
Direct Sales Lead Ppt Powerpoint Presentation Diagram Graph Charts Cpb
This is a direct sales lead ppt powerpoint presentation diagram graph charts cpb. This is a two stage process. The stages in this process are direct sales lead.
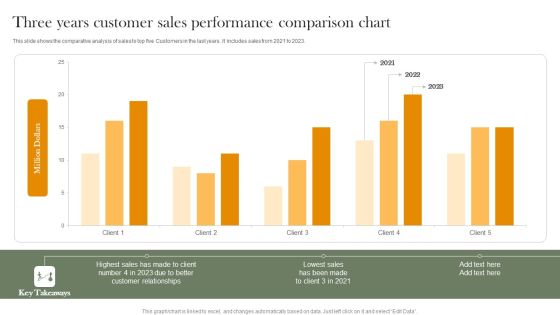
Three Years Customer Sales Performance Comparison Chart Professional PDF
This slide shows the comparative analysis of sales to top five Customers in the last years. It includes sales from 2021 to 2023. Pitch your topic with ease and precision using this Three Years Customer Sales Performance Comparison Chart Professional PDF. This layout presents information on Highest Sales, Customer Relationships, Lowest Sales. It is also available for immediate download and adjustment. So, changes can be made in the color, design, graphics or any other component to create a unique layout.
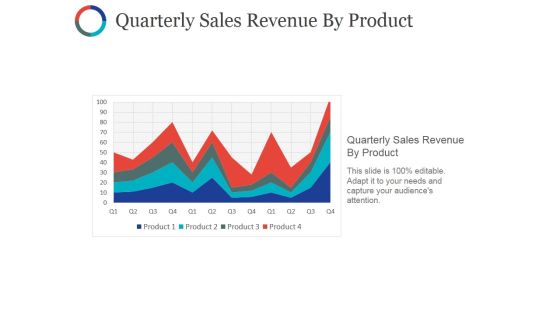
Quarterly Sales Revenue By Product Ppt PowerPoint Presentation Styles Slides
This is a quarterly sales revenue by product ppt powerpoint presentation styles slides. This is a four stage process. The stages in this process are quarterly sales revenue by product, charts, sales, business, success.
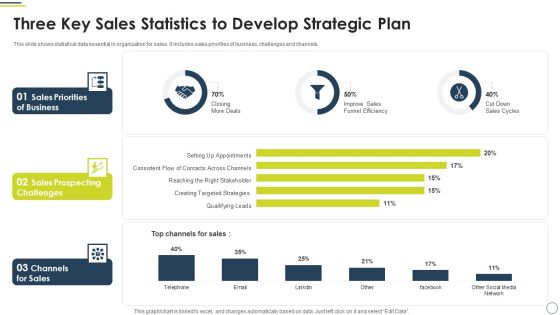
Three Key Sales Statistics To Develop Strategic Plan Microsoft PDF
This slide shows statistical data essential in organization for sales. It includes sales priorities of business, challenges and channels. Pitch your topic with ease and precision using this Three Key Sales Statistics To Develop Strategic Plan Microsoft PDF. This layout presents information on Sales Priorities Business, Sales Prospecting Challenges, Channels For Sales. It is also available for immediate download and adjustment. So, changes can be made in the color, design, graphics or any other component to create a unique layout.

Determine Average Sales Cycle In Pipeline Information PDF
This slide provides information regarding average sales cycle existing in sales pipeline. The department will consistently monitor sales cycle to ensure on time closure of deal. Deliver and pitch your topic in the best possible manner with this Determine Average Sales Cycle In Pipeline Information PDF. Use them to share invaluable insights on Opportunity Conversion Capability, Sales Department, Sales Cycle and impress your audience. This template can be altered and modified as per your expectations. So, grab it now.

Determine Current Bottlenecks Associated To Sales Pipeline Microsoft PDF
This slide provides information regarding the key concerns that have raised in context to sales pipeline such as longer sales cycle, increase in lost deals due to various reasons. Deliver an awe inspiring pitch with this creative Determine Current Bottlenecks Associated To Sales Pipeline Microsoft PDF bundle. Topics like Sales Representatives, Sales Cycle, Sales Process can be discussed with this completely editable template. It is available for immediate download depending on the needs and requirements of the user.

Canned Food Company Profile Product Sales By Category Infographics PDF
The slide showcases the details of product sales by category for food, beverages and dairy products. It also illustrates sales split for every product in each category Deliver and pitch your topic in the best possible manner with this Canned Food Company Profile Product Sales By Category Infographics PDF Use them to share invaluable insights on Sales Of Food, Sales Beverages, Sales Split and impress your audience. This template can be altered and modified as per your expectations. So, grab it now.
Pharma Medical Dashboard To Analyze Sales Strategy Performance Icons PDF
The following slide delineates a comprehensive medical dashboard which can be used by the pharma company to measure its sales strategy performance. The KPIs covered in the slide are top sales producers, sales channels, volume by product, etc. Showcasing this set of slides titled Pharma Medical Dashboard To Analyze Sales Strategy Performance Icons PDF. The topics addressed in these templates are Market Leaders, Sales Channels, Volume Product. All the content presented in this PPT design is completely editable. Download it and make adjustments in color, background, font etc. as per your unique business setting.
Tracking Customer Sales Funnel Dashboard Improving Distribution Channel Mockup PDF
This slide covers information regarding the customer sales funnel tracking with sales volume and total market. Deliver and pitch your topic in the best possible manner with this Tracking Customer Sales Funnel Dashboard Improving Distribution Channel Mockup PDF. Use them to share invaluable insights on Tracking Customer, Sales Funnel, Sales Volume and impress your audience. This template can be altered and modified as per your expectations. So, grab it now.

Table Of Contents For Sales Process Catalogue Template Graphics PDF
This is a table of contents for sales process catalogue template graphics pdf template with various stages. Focus and dispense information on seven stages using this creative set, that comes with editable features. It contains large content boxes to add your information on topics like sales performance, sales methodology, sales process, sales workforce, sales team productivity. You can also showcase facts, figures, and other relevant content using this PPT layout. Grab it now.

B2B Sales Training Ppt PowerPoint Presentation Ideas Professional Cpb
This is a b2b sales training ppt powerpoint presentation ideas professional cpb. This is a four stage process. The stages in this process are b2b sales training.

Annual Customer Sales Performance Comparison Graph Portrait PDF
This slide shows the annual sales comparison chart. It also includes total and monthly sales target. Pitch your topic with ease and precision using this Annual Customer Sales Performance Comparison Graph Portrait PDF. This layout presents information on Total Sales Target, Sales Target, Achievement. It is also available for immediate download and adjustment. So, changes can be made in the color, design, graphics or any other component to create a unique layout.

Sales Representative Barriers And Overcoming Solutions Designs PDF
This slide covers top sale agent challenges that disrupts company growth and performance. It includes challenges such as competing with competitors, inability to answer prospects queries, sales training, sales and marketing alignment, etc. Presenting Sales Representative Barriers And Overcoming Solutions Designs PDF to dispense important information. This template comprises three stages. It also presents valuable insights into the topics including Sales Rep Challenges, Competitive Market, Customer. This is a completely customizable PowerPoint theme that can be put to use immediately. So, download it and address the topic impactfully.

Quarterly Sales Team Performance Analysis Kpis Slides PDF
The following slide depicts the efforts made my sales team in increasing companys growth. It also includes KPAs such as new customers acquired, sales, profit, average revenue per unit, customer lifetime value, acquisition cost etc. Showcasing this set of slides titled Quarterly Sales Team Performance Analysis Kpis Slides PDF. The topics addressed in these templates are Above Sales Target, Average Sales Revenue, Average Customer. All the content presented in this PPT design is completely editable. Download it and make adjustments in color, background, font etc. as per your unique business setting.
Report On Annual Sales Attrition Tracking By Regions Rules PDF
This slide covers region wise turnover chart depicting sale of companys total amount of products. It includes elements such sales agent name, region, sales quota and YTD goal achievement by workforce. Showcasing this set of slides titled Report On Annual Sales Attrition Tracking By Regions Rules PDF. The topics addressed in these templates are Annual Sales Attrition Tracking. All the content presented in this PPT design is completely editable. Download it and make adjustments in color, background, font etc. as per your unique business setting.

Sales Performance Versus Target Ppt PowerPoint Presentation File Vector
This is a sales performance versus target ppt powerpoint presentation file vector. This is a five stage process. The stages in this process are business, marketing, speed, meter, sales.
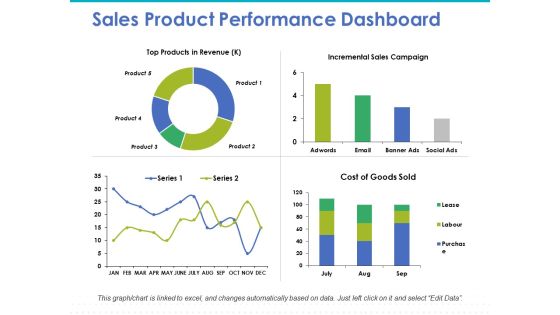
Sales Product Performance Dashboard Ppt PowerPoint Presentation Model Graphics Design
This is a sales product performance dashboard ppt powerpoint presentation model graphics design. This is a four stage process. The stages in this process are top products in revenue, incremental sales, cost of goods.

Company Sales And Performance Dashboard Ppt PowerPoint Presentation Show Structure
This is a company sales and performance dashboard ppt powerpoint presentation show structure. This is a four stage process. The stages in this process are year product sales, month growth in revenue, profit margins graph, year profits.

Graphical Representation Of Research IT Sales Performance Dashboard Sample PDF
This slide depicts the dashboard for sales performance after the implementation of visualization research based on revenue, quantity, regional sales. Deliver and pitch your topic in the best possible manner with this graphical representation of research it sales performance dashboard sample pdf. Use them to share invaluable insights on sales performance dashboard after visualization research implementation and impress your audience. This template can be altered and modified as per your expectations. So, grab it now.

Digital Dashboard Indicating Insurance Agent Sales Performance Portrait PDF
This slide illustrates insurance agent sales performance digital dashboard. It provides information about total proposals, policies, accident, claims, sales revenue, rewards, etc. Pitch your topic with ease and precision using this Digital Dashboard Indicating Insurance Agent Sales Performance Portrait PDF. This layout presents information on Sales Revenue, Reward And Recognition. It is also available for immediate download and adjustment. So, changes can be made in the color, design, graphics or any other component to create a unique layout.
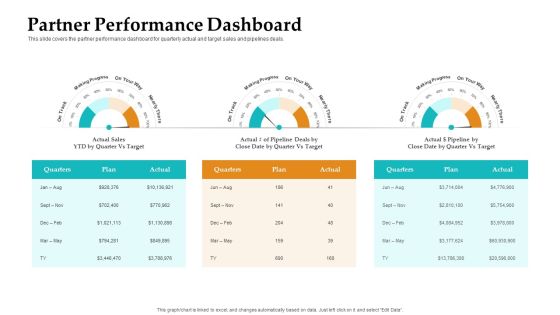
Sales Facilitation Partner Management Partner Performance Dashboard Graphics PDF
This slide covers the partner performance dashboard for quarterly actual and target sales and pipelines deals. Deliver an awe inspiring pitch with this creative sales facilitation partner management partner performance dashboard graphics pdf bundle. Topics like sales, target, actual, plan can be discussed with this completely editable template. It is available for immediate download depending on the needs and requirements of the user.

Sales Dashboard Template 1 Ppt PowerPoint Presentation Samples
This is a sales dashboard template 1 ppt powerpoint presentation samples. This is a one stage process. The stages in this process are sales and percent growth of product, revenue, product, percent growth.

CRM Software Dashboard For Sales Comparison Mockup PDF
This slide represents the sales dashboard of CRM software. It includes KPIs such as profit, number of sales and expenses incurred. Pitch your topic with ease and precision using this CRM Software Dashboard For Sales Comparison Mockup PDF. This layout presents information on Profit, Sales Dashboard, Expenses Incurred. It is also available for immediate download and adjustment. So, changes can be made in the color, design, graphics or any other component to create a unique layout.
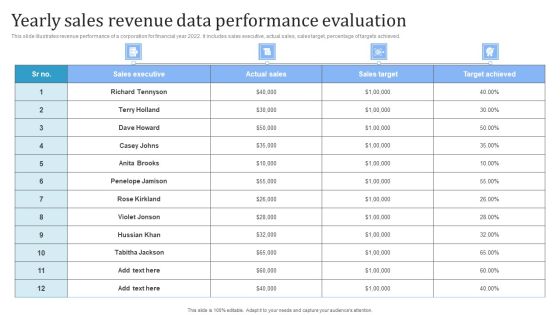
Yearly Sales Revenue Data Performance Evaluation Ideas PDF
Pitch your topic with ease and precision using this Yearly Sales Revenue Data Performance Evaluation Ideas PDF. This layout presents information on Sales Executive, Actual Sales, Sales Target. It is also available for immediate download and adjustment. So, changes can be made in the color, design, graphics or any other component to create a unique layout.
Sales Roadmap Ppt PowerPoint Presentation File Show Cpb
This is a sales roadmap ppt powerpoint presentation file show cpb. This is a five stage process. The stages in this process are sales roadmap.
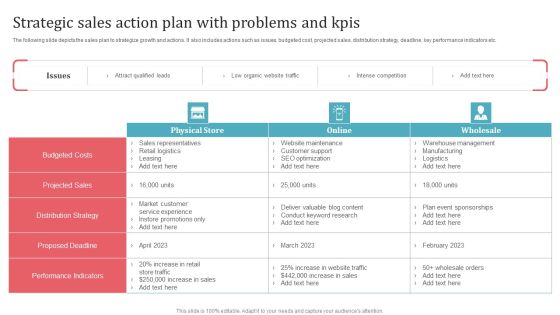
Strategic Sales Action Plan With Problems And Kpis Guidelines PDF
The following slide depicts the sales plan to strategize growth and actions. It also includes actions such as issues, budgeted cost, projected sales, distribution strategy, deadline, key performance indicators etc. Pitch your topic with ease and precision using this Strategic Sales Action Plan With Problems And Kpis Guidelines PDF. This layout presents information on Physical Store, Online, Wholesale. It is also available for immediate download and adjustment. So, changes can be made in the color, design, graphics or any other component to create a unique layout.

Organizational Chart For Restaurants Sales And Marketing Department Pictures PDF
This slide covers organisation structure chart for restaurants. It includes key stakeholders such as general manager, sales and marketing director, event and banquet sales manager, sales representatives event and banquets, travel and trade manager, corporate sales account manager, etc. Persuade your audience using this Organizational Chart For Restaurants Sales And Marketing Department Pictures PDF. This PPT design covers four stages, thus making it a great tool to use. It also caters to a variety of topics including General Manager, Trade Sales Representatives, Corporate Sales Account Manager. Download this PPT design now to present a convincing pitch that not only emphasizes the topic but also showcases your presentation skills.
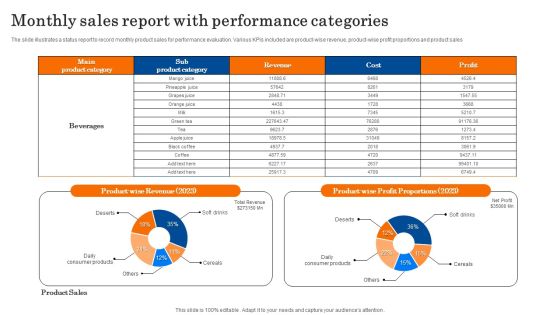
Monthly Sales Report With Performance Categories Diagrams PDF
The slide illustrates a status report to record monthly product sales for performance evaluation. Various KPIs included are product wise revenue, product-wise profit proportions and product sales. Showcasing this set of slides titled Monthly Sales Report With Performance Categories Diagrams PDF. The topics addressed in these templates are Revenue, Profit Proportions, Product Sales. All the content presented in this PPT design is completely editable. Download it and make adjustments in color, background, font etc. as per your unique business setting.
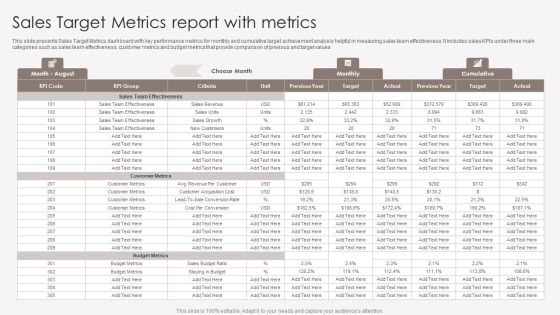
Sales Target Metrics Report With Metrics Introduction PDF
This slide presents Sales Target Metrics dashboard with key performance metrics for monthly and cumulative target achievement analysis helpful in measuring sales team effectiveness. It includes sales KPIs under three main categories such as sales team effectiveness, customer metrics and budget metrics that provide comparison of previous and target values. Pitch your topic with ease and precision using this Sales Target Metrics Report With Metrics Introduction PDF. This layout presents information on Sales Team Effectiveness, Customer Metrics, Budget Metrics. It is also available for immediate download and adjustment. So, changes can be made in the color, design, graphics or any other component to create a unique layout.
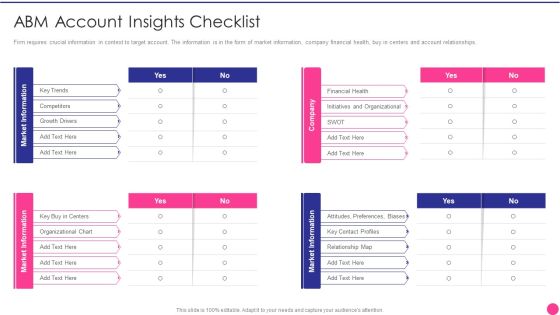
Operating B2B Sales Abm Account Insights Checklist Demonstration PDF
Firm requires crucial information in context to target account. The information is in the form of market information, company financial health, buy in centers and account relationships. Deliver an awe inspiring pitch with this creative operating b2b sales abm account insights checklist demonstration pdf bundle. Topics like competitors, key trends, growth drivers, organizational chart can be discussed with this completely editable template. It is available for immediate download depending on the needs and requirements of the user.

International Sales Performance Dashboard With Regional Market Report Inspiration PDF
This slide showcases global report that can help organization to estimate forecast of the sales and identify yearly revenue generated. Its key elements are yearly sales, market share, regional outlook, competitor analysis and geographical sales. Pitch your topic with ease and precision using this International Sales Performance Dashboard With Regional Market Report Inspiration PDF. This layout presents information on Regional Outlook, Sales And Forecast, Market Share Overview. It is also available for immediate download and adjustment. So, changes can be made in the color, design, graphics or any other component to create a unique layout.

Company Sales And Revenue Performance Analysis Ppt Ideas Format PDF
This slide covers sales and revenue generated by a business entity. It also includes elements such profits earned, cost incurred, marketing and sales cost breakdown, annual sales revenue graph, sales generated through social media, revenue from up OR cross selling, etc. Pitch your topic with ease and precision using this Company Sales And Revenue Performance Analysis Ppt Ideas Format PDF. This layout presents information on Total Sales, Revenue Generation, Profit Earned, Cost Incurred. It is also available for immediate download and adjustment. So, changes can be made in the color, design, graphics or any other component to create a unique layout.
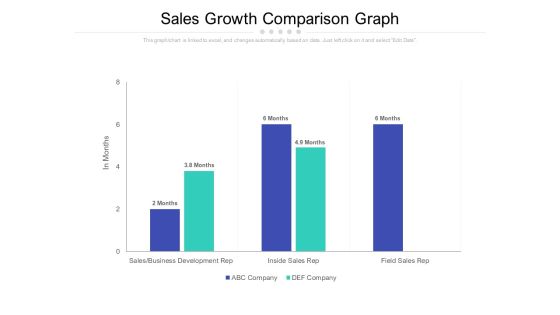
Sales Growth Comparison Graph Ppt PowerPoint Presentation Outline Demonstration
Presenting this set of slides with name sales growth comparison graph ppt powerpoint presentation outline demonstration. The topics discussed in these slides are sales, business development rep, inside sales rep, field sales rep. This is a completely editable PowerPoint presentation and is available for immediate download. Download now and impress your audience.
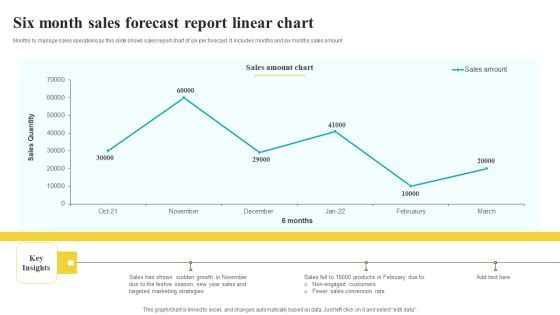
Six Month Sales Forecast Report Linear Chart Themes PDF
Months to manage sales operations as this slide shows sales report chart of six per forecast. It includes months and six months sales amount Showcasing this set of slides titled Six Month Sales Forecast Report Linear Chart Themes PDF. The topics addressed in these templates are Sales Amount Chart, Key Insights, Conversion Rate. All the content presented in this PPT design is completely editable. Download it and make adjustments in color, background, font etc. as per your unique business setting.
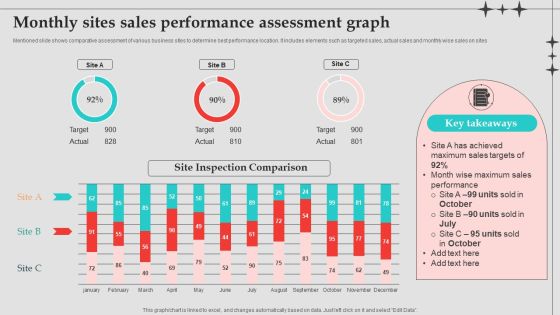
Monthly Sites Sales Performance Assessment Graph Designs PDF
Mentioned slide shows comparative assessment of various business sites to determine best performance location. It includes elements such as targeted sales, actual sales and monthly wise sales on sites. Pitch your topic with ease and precision using this Monthly Sites Sales Performance Assessment Graph Designs PDF. This layout presents information on Sales Performance, Sales Targets, Performance Assessment Graph . It is also available for immediate download and adjustment. So, changes can be made in the color, design, graphics or any other component to create a unique layout.

Actual And Forecasted Customer Sales Performance Comparison Elements PDF
This slide shows the actual and forecasted customer sales comparison. It also includes client name and variance in actual and forecasted sales. Showcasing this set of slides titled Actual And Forecasted Customer Sales Performance Comparison Elements PDF. The topics addressed in these templates are Forecasted Sales, Actual Sales, Price. All the content presented in this PPT design is completely editable. Download it and make adjustments in color, background, font etc. as per your unique business setting.
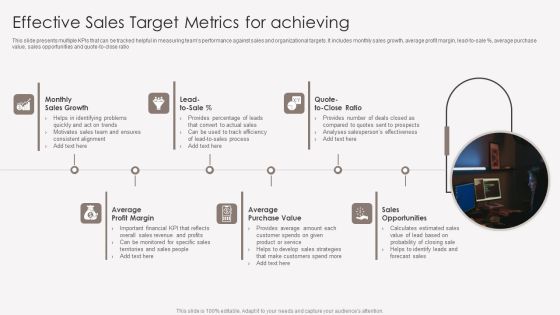
Effective Sales Target Metrics For Achieving Elements PDF
This slide presents multiple KPIs that can be tracked helpful in measuring teams performance against sales and organizational targets. It includes monthly sales growth, average profit margin, lead to sale, average purchase value, sales opportunities and quote to close ratio. Presenting Effective Sales Target Metrics For Achieving Elements PDF to dispense important information. This template comprises six stages. It also presents valuable insights into the topics including Monthly Sales Growth, Average Purchase Value, Sales Opportunities. This is a completely customizable PowerPoint theme that can be put to use immediately. So, download it and address the topic impactfully.
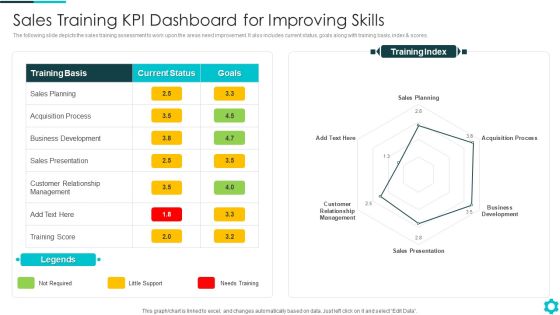
Sales Training KPI Dashboard For Improving Skills Portrait PDF
The following slide depicts the sales training assessment to work upon the areas need improvement. It also includes current status, goals along with training basis, index and scores.Showcasing this set of slides titled Sales Training KPI Dashboard For Improving Skills Portrait PDF The topics addressed in these templates are Acquisition Process, Sales Presentation, Customer Relationship Management All the content presented in this PPT design is completely editable. Download it and make adjustments in color, background, font etc. as per your unique business setting.

Company Sales KPI And Revenue Generation Progress Scorecard Formats PDF
This slide covers status and earnings from sales in an organization. It includes details such as sales count, revenue generated, profit earned and cost incurred to raise sales and profitable sales channel.Showcasing this set of slides titled Company Sales KPI And Revenue Generation Progress Scorecard Formats PDF. The topics addressed in these templates are Accumulated Revenue, Annual Sales Revenue, Incremental Sales. All the content presented in this PPT design is completely editable. Download it and make adjustments in color, background, font etc. as per your unique business setting.
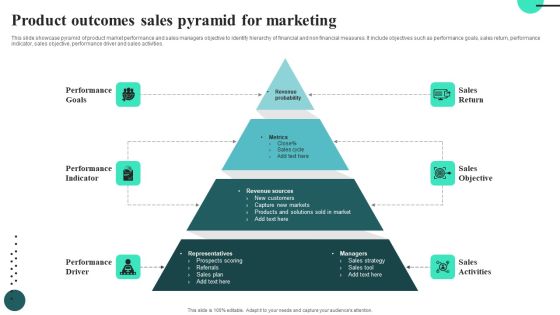
Product Outcomes Sales Pyramid For Marketing Information PDF
This slide showcase pyramid of product market performance and sales managers objective to identify hierarchy of financial and non financial measures. It include objectives such as performance goals, sales return, performance indicator, sales objective, performance driver and sales activities.Presenting Product Outcomes Sales Pyramid For Marketing Information PDF to dispense important information. This template comprises four stages. It also presents valuable insights into the topics including Sales Return, Sales Objective. This is a completely customizable PowerPoint theme that can be put to use immediately. So, download it and address the topic impactfully.
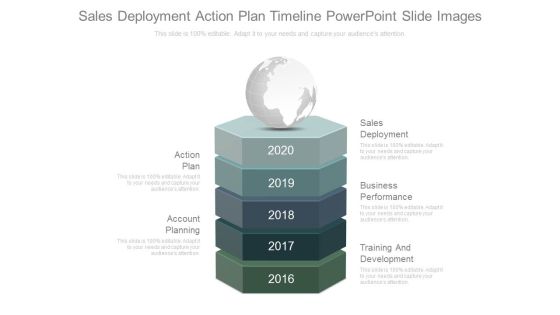
Sales Deployment Action Plan Timeline Powerpoint Slide Images
This is a sales deployment action plan timeline powerpoint slide images. This is a five stage process. The stages in this process are action plan, sales deployment, business performance, training and development, account planning.
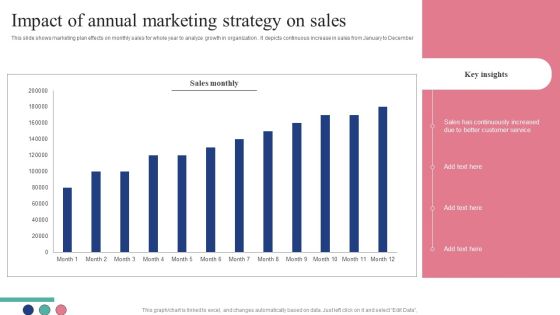
Impact Of Annual Marketing Strategy On Sales Download PDF
This slide shows marketing plan effects on monthly sales for whole year to analyze growth in organization . It depicts continuous increase in sales from January to December Showcasing this set of slides titled Impact Of Annual Marketing Strategy On Sales Download PDF. The topics addressed in these templates are Sales Monthly, Key Insights, Sales. All the content presented in this PPT design is completely editable. Download it and make adjustments in color, background, font etc. as per your unique business setting.

Decline In Total Sales Of Company Abc Slides PDF
This slide shows graph of impact of sales pipeline challenges on overall sales of the company. Additionally, it provides the reasons behind the sales decline Deliver and pitch your topic in the best possible manner with this Decline In Total Sales Of Company Abc Slides PDF. Use them to share invaluable insights on Management, Sales, Opportunities and impress your audience. This template can be altered and modified as per your expectations. So, grab it now.
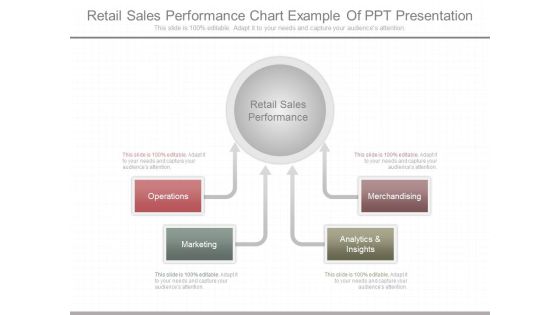
Retail Sales Performance Chart Example Of Ppt Presentation
This is a retail sales performance chart example of ppt presentation. This is a four stage process. The stages in this process are operations, marketing, analytics and insights, merchandising, retail sales performance.

KPI Dashboard To Evaluate Corporate Sales Introduction PDF
This slide contains KPI dashboard which can be used by company to track e-commerce sales. It includes kpis such as total orders, order quantity, sales quantity, sales by location, etc. Pitch your topic with ease and precision using this KPI Dashboard To Evaluate Corporate Sales Introduction PDF. This layout presents information on KPI Dashboard, Evaluate Corporate Sales. It is also available for immediate download and adjustment. So, changes can be made in the color, design, graphics or any other component to create a unique layout.

Kpis For Sales Managers To Build Strategic Plan Inspiration PDF
This slide shows essential KPIs in sales to be considered by the managers. It includes competitor pricing, employee satisfaction, client engagement and sale volume. Presenting Kpis For Sales Managers To Build Strategic Plan Inspiration PDF to dispense important information. This template comprises four stages. It also presents valuable insights into the topics including Competitor Pricing, Client Engagement, Employee Satisfaction. This is a completely customizable PowerPoint theme that can be put to use immediately. So, download it and address the topic impactfully.
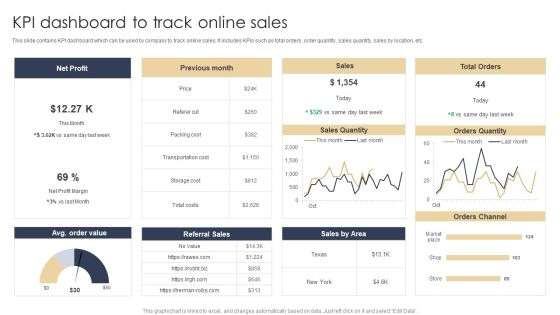
KPI Dashboard To Track Online Sales Structure PDF
This slide contains KPI dashboard which can be used by company to track online sales. It includes KPIs such as total orders, order quantity, sales quantity, sales by location, etc. Pitch your topic with ease and precision using this KPI Dashboard To Track Online Sales Structure PDF. This layout presents information on Net Profit, Sales, Orders Quantity. It is also available for immediate download and adjustment. So, changes can be made in the color, design, graphics or any other component to create a unique layout.

 Home
Home