Sales Icons

Clustered Column Ppt PowerPoint Presentation Infographic Template Backgrounds
This is a clustered column ppt powerpoint presentation infographic template backgrounds. This is a two stage process. The stages in this process are sales in percentage, financial year, product.
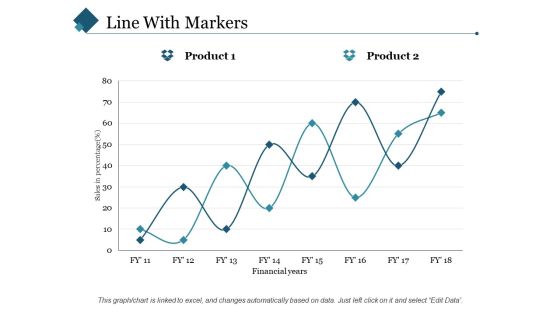
Line With Markers Ppt PowerPoint Presentation Styles Slide Portrait
This is a line with markers ppt powerpoint presentation styles slide portrait. This is a two stage process. The stages in this process are sales in percentage, financial years, product.
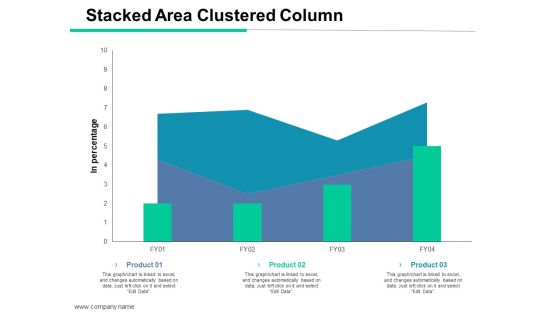
Stacked Area Clustered Column Ppt PowerPoint Presentation File Templates
This is a stacked area clustered column ppt powerpoint presentation file templates. This is a three stage process. The stages in this process are stacked area clustered column, product, financial, sales in percentage, management.

Four Steps Towards Monetary Profit Powerpoint Templates
Concept of target achievement can be defined with this diagram. This PowerPoint template contains the graphic of four steps towards monetary profit. Use this PPT slide for business and sales related presentations.
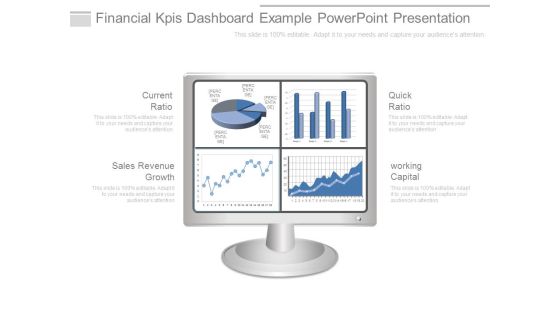
Financial Kpis Dashboard Example Powerpoint Presentation
This is a financial kpis dashboard example powerpoint presentation. This is a four stage process. The stages in this process are current ratio, sales revenue growth, quick ratio, working capital.

Financial Statement Ppt PowerPoint Presentation Professional Clipart
This is a financial statement ppt powerpoint presentation professional clipart. This is a five stage process. The stages in this process are revenue trends, revenue growth, deal drop off by stage, trends of sales cycle times.

Channel Kpis Ppt PowerPoint Presentation Background Designs
This is a channel kpis ppt powerpoint presentation background designs. This is a four stage process. The stages in this process are sales density, personnel cost, real estate cost, inventory turnover, supermarkets, soft discount, cost reduction, hard discount.

Our Team Ppt PowerPoint Presentation Gallery Graphics Download
This is a our team ppt powerpoint presentation gallery graphics download. This is a three stage process. The stages in this process are web developer, graphic designer, sales manager.

Company Objectives Template 1 Ppt PowerPoint Presentation Styles Infographics
This is a company objectives template 1 ppt powerpoint presentation styles infographics. This is a one stage process. The stages in this process are current customer base, number of sales by, market share, operational expenses.

Break Even Analysis Ppt PowerPoint Presentation Layouts Portrait
This is a break even analysis ppt powerpoint presentation layouts portrait. This is a six stage process. The stages in this process are key comments on the table, units of output, total cost, sales revenue, profit.

Stock Photo Graphics For Business Reports And Charts PowerPoint Slide
This image contains graphics of business reports and charts. Download this image for business and sales presentations where you have to focus on financial growth. Dazzle the audience with your thoughts.
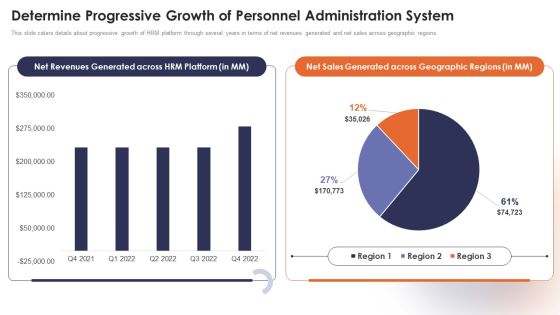
Personnel Administration System Determine Progressive Growth Of Personnel Administration System Demonstration PDF
This slide caters details about progressive growth of HRM platform through several years in terms of net revenues generated and net sales across geographic regions. Deliver and pitch your topic in the best possible manner with this Personnel Administration System Determine Progressive Growth Of Personnel Administration System Demonstration PDF. Use them to share invaluable insights on Revenues Generated, Sales Generated, Geographic Regions and impress your audience. This template can be altered and modified as per your expectations. So, grab it now.

Business Takeover Plan For Inorganic Growth Profitability Ratios Gross Infographics PDF
Deliver and pitch your topic in the best possible manner with this business takeover plan for inorganic growth profitability ratios gross infographics pdf. Use them to share invaluable insights on gross profit ratio, net profit ratio, net profit after tax or net sales, gross profit or net sales and impress your audience. This template can be altered and modified as per your expectations. So, grab it now.
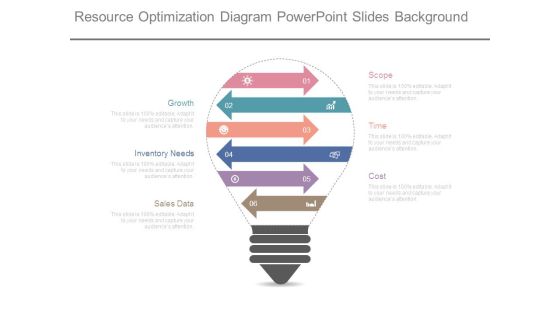
Resource Optimization Diagram Powerpoint Slides Background
This is a resource optimization diagram powerpoint slides background. This is a six stage process. The stages in this process are scope, time, cost, growth, inventory needs, sales data.

Business Diagram Globe Bar Graph And Bulb For International Business Diagram Presentation Template
Graphic of globe and bar graph with bulb has been used to craft this power point template diagram. This PPT diagram contains the concept of international business growth analysis. Use this PPT for global business and sales related presentations.

Some Quick Facts Ppt PowerPoint Presentation Styles Diagrams
This is a some quick facts ppt powerpoint presentation styles diagrams. This is a three stage process. The stages in this process are customers in 2014, sales growth in 2015, staff work weekly.
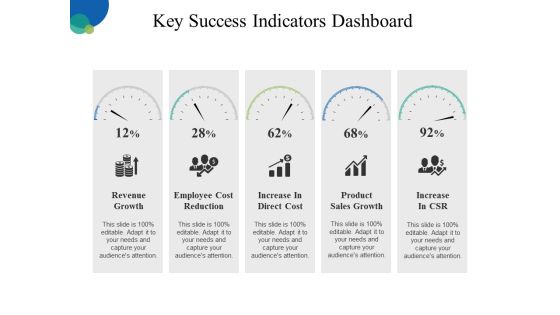
Key Success Indicators Dashboard Ppt PowerPoint Presentation Outline Slideshow
This is a key success indicators dashboard ppt powerpoint presentation outline slideshow. This is a five stage process. The stages in this process are revenue growth, employee cost reduction, increase in direct cost, product sales growth, increase in csr.

Market Trends Ppt PowerPoint Presentation Model Background Images
This is a market trends ppt powerpoint presentation model background images. This is a two stage process. The stages in this process are our analysis, montana, texas, sales in texas.

Stock Photo Twisted Arrows Around Bars PowerPoint Slide
This conceptual image displays graphics of bar graph. This image of bar graph can be used to show growth in sales or profit. Pass your ideas through this image slide in relation to profit growth.
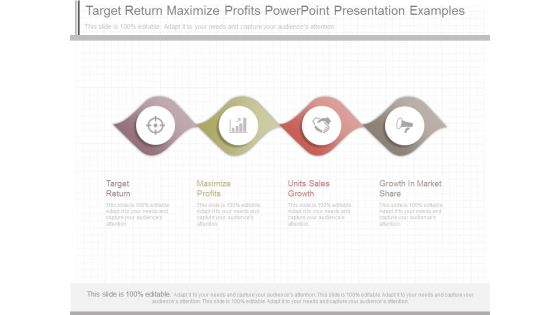
Target Return Maximize Profits Powerpoint Presentation Examples
This is a target return maximize profits powerpoint presentation examples. This is a four stage process. The stages in this process are target return, maximize profits, units sales growth, growth in market share.
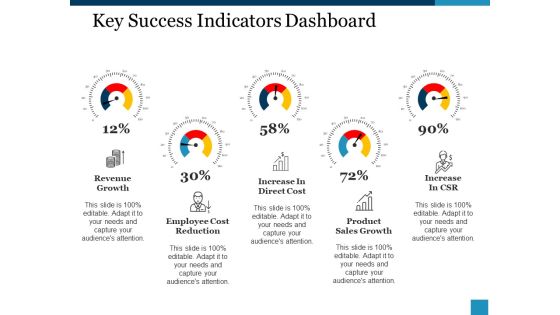
Key Success Indicators Dashboard Ppt PowerPoint Presentation Inspiration Guide
This is a key success indicators dashboard ppt powerpoint presentation inspiration guide. This is a five stage process. The stages in this process are revenue growth, increase in direct cost, increase in csr, employee cost reduction, product, sales growth.

Linkedin Promotional Strategies For Organizational Growth Brand Performance Ranking Scorecard Rules PDF
Below slide highlights performance rating scorecard based on key parameters such as sales revenue, customer chur, customer engagement, customer satisfaction etc Deliver and pitch your topic in the best possible manner with this Linkedin Promotional Strategies For Organizational Growth Brand Performance Ranking Scorecard Rules PDF. Use them to share invaluable insights on Sales, Customer, Average and impress your audience. This template can be altered and modified as per your expectations. So, grab it now.

Bar Graph Ppt PowerPoint Presentation File Slides
This is a bar graph ppt powerpoint presentation file slides. This is a three stage process. The stages in this process are product, sales in percentage, bar graph, growth, success.

The Promotion Mix Template Ppt Presentation
This is a the promotion mix template ppt presentation. This is a five stage process. The stages in this process are advertising, sales promotion, direct marketing, public relations, personal selling, promotional mix.

Bar Chart Ppt PowerPoint Presentation Summary Themes
This is a bar chart ppt powerpoint presentation summary themes. This is a three stage process. The stages in this process are financial years, sales in percentage, business, marketing, graph.
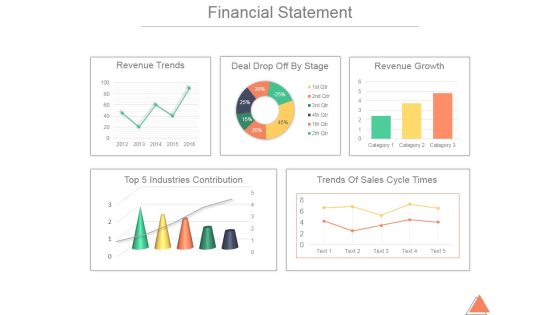
Financial Statement Ppt PowerPoint Presentation Guide
This is a financial statement ppt powerpoint presentation guide. This is a five stage process. The stages in this process are top 5 industries contribution, trends of sales cycle times, revenue trends, deal drop off by stage, revenue growth.

Bar Chart Ppt PowerPoint Presentation Portfolio Diagrams
This is a bar chart ppt powerpoint presentation portfolio diagrams. This is a three stage process. The stages in this process are sales in percentage, business, marketing, graph, finance.

Bar Chart Ppt PowerPoint Presentation Diagram Lists
This is a bar chart ppt powerpoint presentation diagram lists. This is a two stage process. The stages in this process are business, marketing, financial years, sales in percentage, graph.

0814 Global Success Concept Globe And Golden Coins Graphic Image Graphics For PowerPoint
Explain the concept of global success with our exclusive image. This image contains increasing stack of coins with globe. Download this image for business and sales presentations where you have to focus on financial growth.
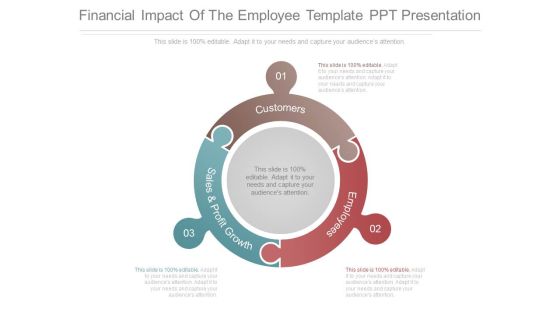
Financial Impact Of The Employee Template Ppt Presentation
This is a financial impact of the employee template ppt presentation. This is a three stage process. The stages in this process are customers, employees, sales and profit growth.
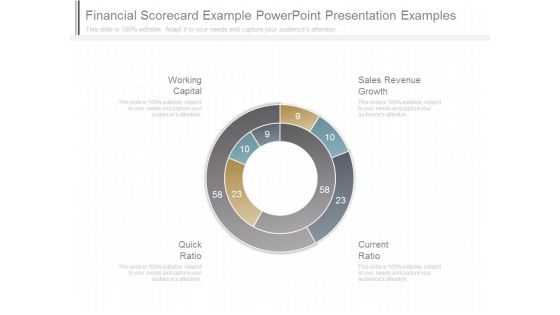
Financial Scorecard Example Powerpoint Presentation Examples
This is a financial scorecard example powerpoint presentation examples. This is a four stage process. The stages in this process are working capital, quick ratio, current ratio, sales revenue growth.

Calculate Marketing Roi Template Powerpoint Layout
This is a calculate marketing roi template powerpoint layout. This is a six stage process. The stages in this process are marketing, cost, gain, sales growth, calculate, basic marketing roi.

Measuring Content Marketing Performance Ppt PowerPoint Presentation Design Ideas
This is a measuring content marketing performance ppt powerpoint presentation design ideas. This is a eight stage process. The stages in this process are conversion rate, quality of leads, website traffic, number of leads, sales revenue, subscriber list growth.
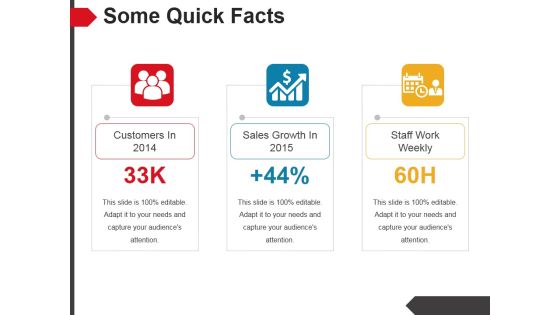
Some Quick Facts Ppt PowerPoint Presentation Example 2015
This is a some quick facts ppt powerpoint presentation example 2015. This is a two stage process. The stages in this process are staff work weekly, sales growth in, customers in .

Clustered Column Line Ppt PowerPoint Presentation Slide
This is a clustered column line ppt powerpoint presentation slide. This is a three stage process. The stages in this process are bar graph, growth, finance, product, sales in percentage.
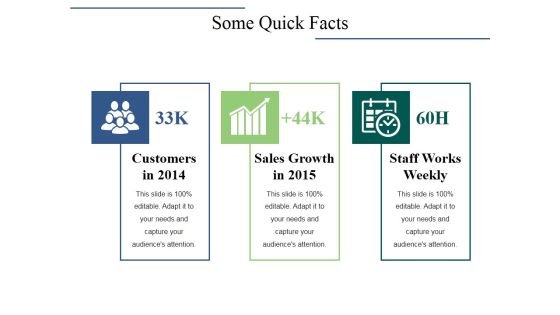
Some Quick Facts Ppt PowerPoint Presentation Inspiration Display
This is a some quick facts ppt powerpoint presentation inspiration display. This is a three stage process. The stages in this process are customers, sales growth, staff works weekly.
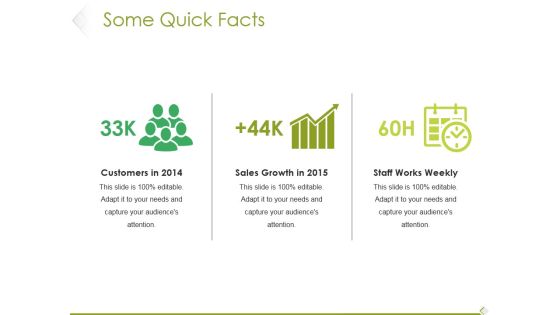
Some Quick Facts Ppt PowerPoint Presentation Professional Designs
This is a some quick facts ppt powerpoint presentation professional designs. This is a three stage process. The stages in this process are customers, sales growth, staff works weekly.

Some Quick Facts Ppt PowerPoint Presentation Summary Example
This is a some quick facts ppt powerpoint presentation summary example. This is a three stage process. The stages in this process are customers, sales growth, staff works weekly.

Partner Relationship Management Diagram Ppt Slide Themes
This is a partner relationship management diagram ppt slide themes. This is a six stage process. The stages in this process are business development, product development, marketing and branding, sales and channels, product and service delivery, customer operations.

Business Diagram Circle Chart For Percentage Ratio Presentation Template
Four staged circular chart has been used to craft this PPT diagram. This PPT contains the concept of result analysis. Use this PPT in your business and sales presentation and display any kind of result analysis in a graphical way.

Bar Chart Ppt PowerPoint Presentation Visual Aids Diagrams
This is a bar chart ppt powerpoint presentation visual aids diagrams. This is a two stage process. The stages in this process are business, marketing, financial years, sales in percentage, graph.

Business Diagram Pie Chart Octagon Shape Presentation Template
This business plan power point template has been designed with pie chart in octagon shape. This PPT contains the concept of result analysis for any business process. Use this PPT for business and sales related presentations.
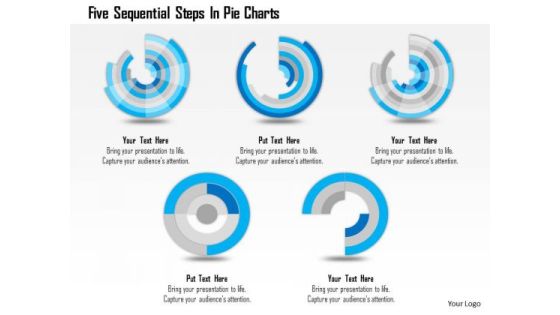
Business Diagram Five Sequential Steps In Pie Charts Presentation Template
Five sequential pie charts are used to craft this power point template. This PPT contains the concept of process flow and result analysis. Use this PPT for your business and sales related presentations and build quality presentation for your viewers.
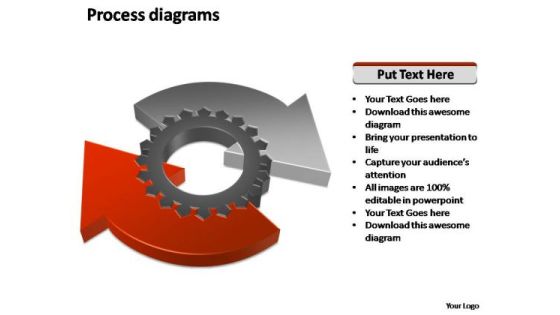
PowerPoint Theme Strategy Business Process Geared Diagram Ppt Slides
PowerPoint Theme Strategy Business Process Geared Diagram PPT Slides-This PowerPoint diagram slide has the Geared Business process representation. Highly useful in most sales and marketing presentations. The colors are editable.-PowerPoint Theme Strategy Business Process Geared Diagram PPT Slides

Business Diagram Three Staged Vertical Timeline Diagram Presentation Template
Three staged vertical timeline diagram has been used to decorate this Power Point template slide. This PPT slide contains the concept of making business timeline. Use this PPT slide for business and sales related presentations.

Online Product Planning Ecommerce Management KPI Dashboard Ppt Layouts Background Image PDF
Presenting this set of slides with name online product planning ecommerce management kpi dashboard ppt layouts background image pdf. The topics discussed in these slides are total volume sold this month, average purchase value, growth in average purchase value, growth in volume sold this month, growth in sales this month, total sales this month. This is a completely editable PowerPoint presentation and is available for immediate download. Download now and impress your audience.
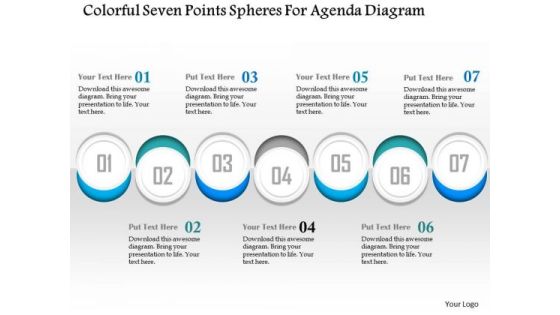
Business Diagram Colorful Seven Points Spheres For Agenda Diagram Presentation Template
Seven staged sphere diagram has been used to design this Power Point template. This diagram displays the concept of business and sales agenda. Use this info graphic in your business presentations and explain business agendas.

Line Chart Ppt PowerPoint Presentation Outline Ideas
This is a line chart ppt powerpoint presentation outline ideas. This is a two stage process. The stages in this process are business, marketing, financial years, sales in percentage, strategy.
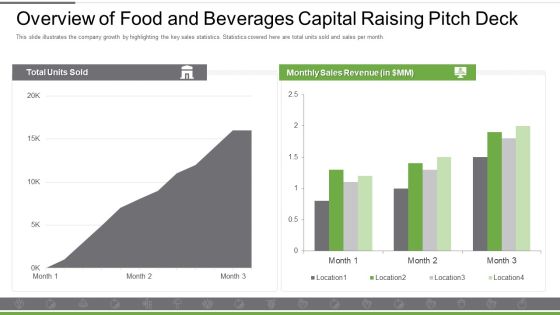
Overview Of Food And Beverages Capital Raising Pitch Deck Rules Themes PDF
This slide illustrates the company growth by highlighting the key sales statistics. Statistics covered here are total units sold and sales per month.Deliver an awe inspiring pitch with this creative overview of food and beverages capital raising pitch deck rules themes pdf bundle. Topics like overview of food and beverages capital raising pitch deck can be discussed with this completely editable template. It is available for immediate download depending on the needs and requirements of the user.

Bar Chart Ppt PowerPoint Presentation Outline Introduction
This is a bar chart ppt powerpoint presentation outline introduction. This is a one stage process. The stages in this process are sales in percentage, product, business, financial years, graph.
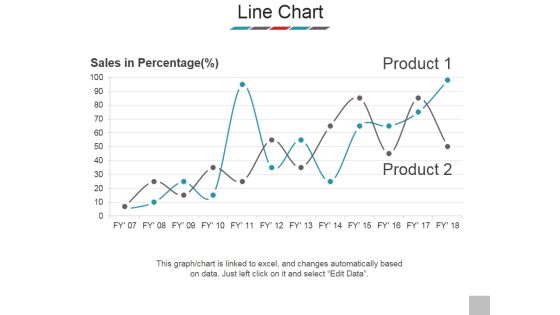
Line Chart Ppt PowerPoint Presentation Outline Samples
This is a line chart ppt powerpoint presentation outline samples. This is a two stage process. The stages in this process are sales in percentage, product, business, marketing, success.

PowerPoint Templates Diagram 3d Puzzle Process Ppt Slide
PowerPoint templates Diagram 3D Puzzle Process PPT Slide-Puzzle diagram is a visual tool that allows you to create and visualize a sales process. -PowerPoint templates Diagram 3D Puzzle Process PPT Slide

Bar Chart Ppt PowerPoint Presentation Outline Backgrounds
This is a bar chart ppt powerpoint presentation outline backgrounds. This is a one stage process. The stages in this process are sales in percentage, financial years, product, bar graph, finance.
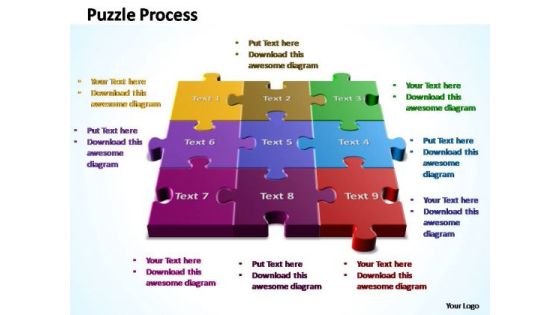
PowerPoint Templates Chart 3d Puzzle Process Ppt Slide
PowerPoint templates Chart 3D Puzzle Process PPT Slide-Puzzle diagram is a visual tool that allows you to create and visualize a sales process. -PowerPoint templates Chart 3D Puzzle Process PPT Slide
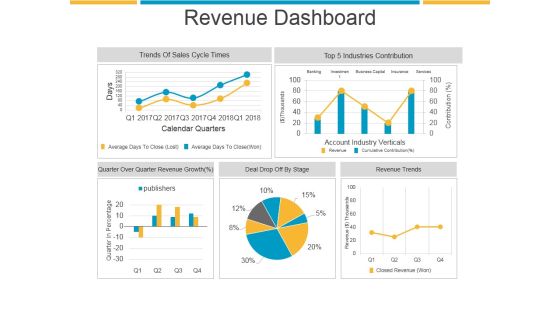
Revenue Dashboard Ppt PowerPoint Presentation Sample
This is a revenue dashboard ppt powerpoint presentation sample. This is a five stage process. The stages in this process are trends of sales cycle times, industries contribution, revenue trends, deal drop off by stage.

Area Chart Ppt PowerPoint Presentation Pictures Template
This is a area chart ppt powerpoint presentation pictures template. This is a two stage process. The stages in this process are sales in percentage, chart, business, marketing, strategy.

Bar Chart Ppt PowerPoint Presentation File Slide
This is a bar chart ppt powerpoint presentation file slide. This is a one stage process. The stages in this process are sales in percentage financial years, business, marketing, strategy, graph.

Area Chart Ppt PowerPoint Presentation File Visuals
This is a area chart ppt powerpoint presentation file visuals. This is a two stage process. The stages in this process are business, sales in percentage, marketing, graph, strategy, finance.

Area Chart Ppt PowerPoint Presentation Layouts Vector
This is a area chart ppt powerpoint presentation layouts vector. This is a two stage process. The stages in this process are area chart, product, sales in percentage, financial year.

Area Chart Ppt PowerPoint Presentation Inspiration Demonstration
This is a area chart ppt powerpoint presentation inspiration demonstration. This is a two stage process. The stages in this process are sales in percentage, chart, percentage, business, marketing.


 Continue with Email

 Home
Home


