Sales Icons
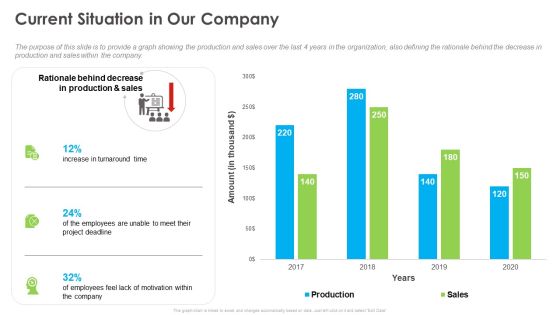
Outstanding Employee Current Situation In Our Company Ppt Show Example File PDF
The purpose of this slide is to provide a graph showing the production and sales over the last 4 years in the organization, also defining the rationale behind the decrease in production and sales within the company. Deliver an awe-inspiring pitch with this creative outstanding employee current situation in our company ppt show example file pdf bundle. Topics like production, sales, project deadline can be discussed with this completely editable template. It is available for immediate download depending on the needs and requirements of the user.
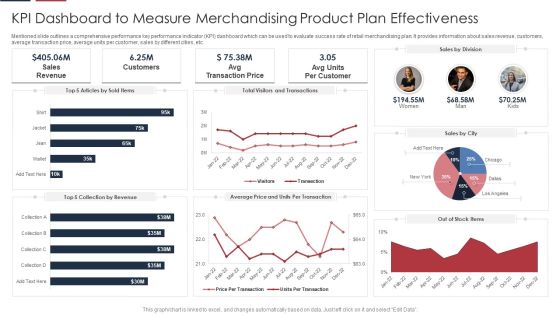
KPI Dashboard To Measure Merchandising Product Plan Effectiveness Guidelines PDF
Mentioned slide outlines a comprehensive performance key performance indicator KPI dashboard which can be used to evaluate success rate of retail merchandising plan. It provides information about sales revenue, customers, average transaction price, average units per customer, sales by different cities, etc. Showcasing this set of slides titled KPI Dashboard To Measure Merchandising Product Plan Effectiveness Guidelines PDF. The topics addressed in these templates are Sales, Customers, Price. All the content presented in this PPT design is completely editable. Download it and make adjustments in color, background, font etc. as per your unique business setting.
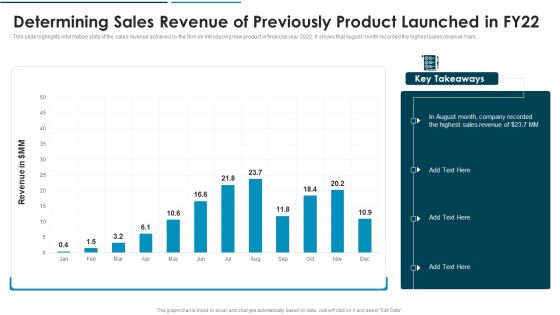
Go To Market Approach For New Product Product Launched In FY22 Inspiration PDF
This slide highlights information stats of the sales revenue achieved by the firm on introducing new product in financial year 2022. It shows that August month recorded the highest sales revenue mark.Deliver and pitch your topic in the best possible manner with this Go To Market Approach For New Product Product Launched In FY22 Inspiration PDF Use them to share invaluable insights on Determining Sales Revenue Of Previously Product Launched In Fy22 and impress your audience. This template can be altered and modified as per your expectations. So, grab it now.
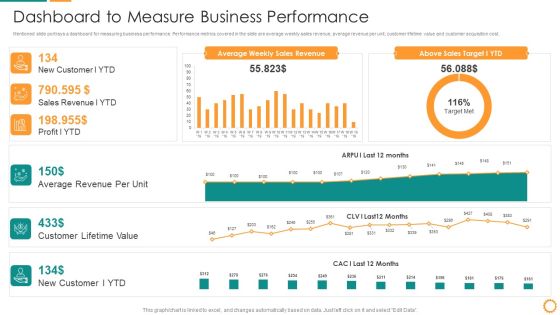
IT Consolidation Post Mergers And Acquisition Dashboard To Measure Business Performance Clipart PDF
Mentioned slide portrays a dashboard for measuring business performance. Performance metrics covered in the slide are average weekly sales revenue, average revenue per unit, customer lifetime value and customer acquisition cost. Deliver and pitch your topic in the best possible manner with this IT Consolidation Post Mergers And Acquisition Dashboard To Measure Business Performance Clipart PDF. Use them to share invaluable insights on Average Revenue, Customer Lifetime Value, Sales Revenue, Sales Target and impress your audience. This template can be altered and modified as per your expectations. So, grab it now.

KPI Dashboard To Track Effectiveness Of Real Estate Business Performance Guidelines PDF
The following slide exhibits key performance indicator KPI dashboard which can be used to measure the financial performance of the real estate company. It covers various kpis such as sales vs target per agent, top 10 projects, top 5 agencies etc.Deliver an awe inspiring pitch with this creative KPI Dashboard To Track Effectiveness Of Real Estate Business Performance Guidelines PDF bundle. Topics like Top Projects, Sales Amount, Sales Amount can be discussed with this completely editable template. It is available for immediate download depending on the needs and requirements of the user.
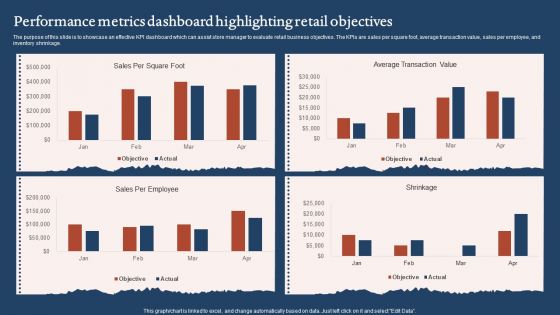
Performance Metrics Dashboard Highlighting Retail Objectives Sample PDF
The purpose of this slide is to showcase an effective KPI dashboard which can assist store manager to evaluate retail business objectives. The KPIs are sales per square foot, average transaction value, sales per employee, and inventory shrinkage. Pitch your topic with ease and precision using this Performance Metrics Dashboard Highlighting Retail Objectives Sample PDF. This layout presents information on Average Transaction Value, Sales Per Employee. It is also available for immediate download and adjustment. So, changes can be made in the color, design, graphics or any other component to create a unique layout.

Real Estate Developers Funding Alternatives Financial Ratios Defining Project Feasibility Download PDF
Mentioned slide provides details about project feasibility financial ratio along with graphical representation. Ratios covered in the slide are net profit sales, quick ratio, debt equity ratio and gross profit sales. Deliver an awe inspiring pitch with this creative Real Estate Real Estate Developers Funding Alternatives Financial Ratios Defining Project Feasibility Download PDF bundle. Topics like Quick Ratio, Debt Equity Ratio, Gross Profit Sales can be discussed with this completely editable template. It is available for immediate download depending on the needs and requirements of the user.

Company Key Figures For Past 5 Years Market Entry Approach For Apparel Sector Clipart PDF
This slide covers the dashboard with major values for the last five years. It includes KPIs such as sales, net operating profit, sales by geographic areas, and number of employees. Deliver an awe inspiring pitch with this creative Company Key Figures For Past 5 Years Market Entry Approach For Apparel Sector Clipart PDF bundle. Topics like Sales Geographical, Number Employees, Operating Profit can be discussed with this completely editable template. It is available for immediate download depending on the needs and requirements of the user.

Column Chart Ppt PowerPoint Presentation Outline Styles
This is a column chart ppt powerpoint presentation outline styles. This is a two stage process. The stages in this process are sales in percentage, financial year in, business, marketing, graph.
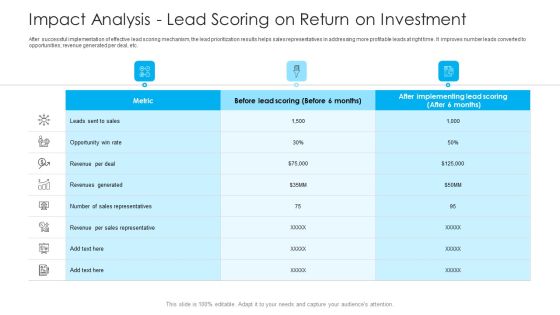
How To Build A Revenue Funnel Impact Analysis Lead Scoring On Return On Investment Diagrams PDF
After successful implementation of effective lead scoring mechanism, the lead prioritization results helps sales representatives in addressing more profitable leads at right time. It improves number leads converted to opportunities revenue generated per deal, etc. Deliver an awe inspiring pitch with this creative how to build a revenue funnel impact analysis increase in sales productivity pictures pdf bundle. Topics like revenue, opportunity, sales, implementing can be discussed with this completely editable template. It is available for immediate download depending on the needs and requirements of the user.

Annual Growth Planning Diagram Ppt Slides
This is a annual growth planning diagram ppt slides. This is a five stage process. The stages in this process are long term plan, supply planning, short term planning, annual budgeting, capital budgeting, sales forecasting.

CRM Investor Fundraising Pitch Deck CRM Application Team Structure Clipart PDF
This slide provides the glimpse about the customer relationship management application team structure which focuses on members involved in a team and their designations. This is a crm investor fundraising pitch deck crm application team structure clipart pdf template with various stages. Focus and dispense information on four stages using this creative set, that comes with editable features. It contains large content boxes to add your information on topics like account manager, sales representative, sales manager, sales research specialist, vp of marketing. You can also showcase facts, figures, and other relevant content using this PPT layout. Grab it now.
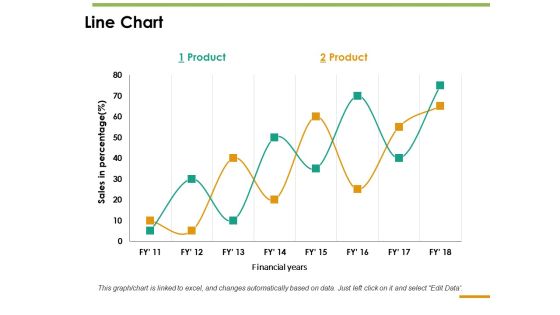
Line Chart Ppt PowerPoint Presentation Inspiration Guide
This is a line chart ppt powerpoint presentation inspiration guide. This is a two stage process. The stages in this process are line chart, sales in percentage, product, financial years.

Combo Chart Ppt PowerPoint Presentation Summary Layouts
This is a combo chart ppt powerpoint presentation summary layouts. This is a eight stage process. The stages in this process are product, sales in percentage, in years, in price, graph.
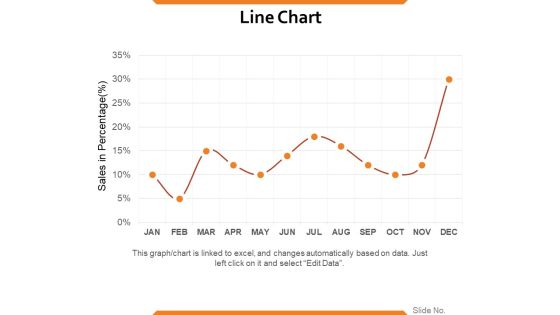
Line Chart Ppt PowerPoint Presentation Summary Samples
This is a line chart ppt powerpoint presentation summary samples. This is a one stage process. The stages in this process are sales in percentage, percentage, business, marketing, strategy.
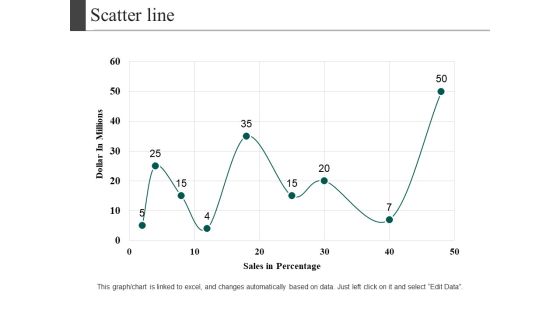
Scatter Line Ppt PowerPoint Presentation Visual Aids Diagrams
This is a scatter line ppt powerpoint presentation visual aids diagrams. This is a one stage process. The stages in this process are dollar in millions, sales in percentage, growth, business, marketing.

Scatter Bubble Chart Ppt PowerPoint Presentation Professional Model
This is a scatter bubble chart ppt powerpoint presentation professional model. This is a six stage process. The stages in this process are sales in profit, financial year, growth, business, marketing, strategy.

Line Chart Ppt PowerPoint Presentation Infographics Graphic Images
This is a line chart ppt powerpoint presentation infographics graphic images. This is a two stage process. The stages in this process are sales in percentage, financial years, growth, business, marketing.

Saas Go To Market Strategy In B2b Environment Portrait PDF
The following slides highlights the go to market strategy of introducing new product in business-to-business sales environment. It includes components such as buying personas, Ads optimization, demand generation, sales cycle analysis, etc. Presenting Saas Go To Market Strategy In B2b Environment Portrait PDF to dispense important information. This template comprises twelve stages. It also presents valuable insights into the topics including Content Marketing, Demand Generation, Sales Strategy. This is a completely customizable PowerPoint theme that can be put to use immediately. So, download it and address the topic impactfully.
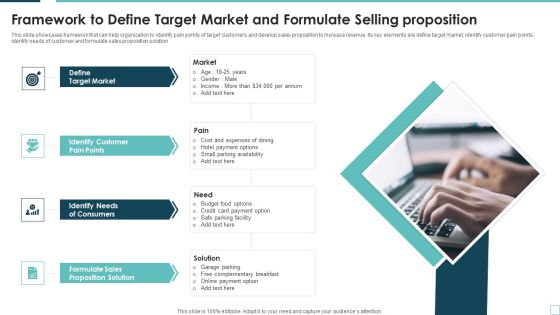
Framework To Define Target Market And Formulate Selling Proposition Background PDF
This slide showcases framework that can help organization to identify pain points of target customers and develop sales proposition to increase revenue. Its key elements are define target market, identify customer pain points, identify needs of customer and formulate sales proposition solution. Presenting Framework To Define Target Market And Formulate Selling Proposition Background PDF to dispense important information. This template comprises four stages. It also presents valuable insights into the topics including Market, Target, Sales. This is a completely customizable PowerPoint theme that can be put to use immediately. So, download it and address the topic impactfully.

Key Steps Of Retail Workflow Management Process Inspiration PDF
This slide showcases various steps to manage retail workflow process for increasing customer satisfaction and boost revenue. It includes key steps such as internal planning, procurement, fulfilment, promotions and sales and sales, service and support. Presenting Key Steps Of Retail Workflow Management Process Inspiration PDF to dispense important information. This template comprises one stages. It also presents valuable insights into the topics including Procurement, Fulfillment, Sales. This is a completely customizable PowerPoint theme that can be put to use immediately. So, download it and address the topic impactfully.
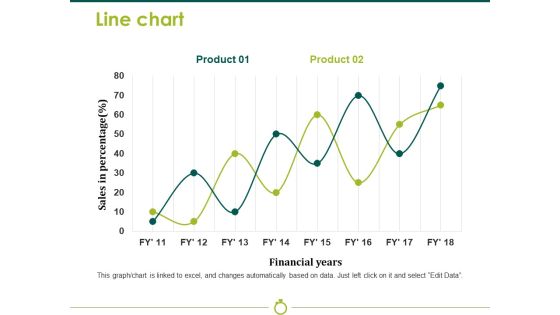
Line Chart Template 2 Ppt PowerPoint Presentation Model Background Image
This is a line chart template 2 ppt powerpoint presentation model background image. This is a two stage process. The stages in this process are sales in percentage, financial years, business, marketing, strategy, graph.
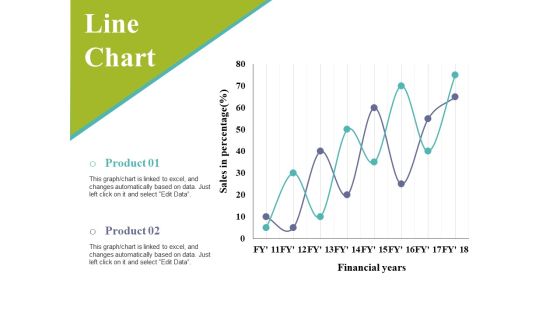
Line Chart Ppt PowerPoint Presentation Infographic Template Slides
This is a line chart ppt powerpoint presentation infographic template slides. This is a two stage process. The stages in this process are sales in percentage, financial years, business, marketing, graph.

3 Year Roadmap For Retail Store Launch Sample PDF
This slide showcases three year timeline for sales forecast that can help to set up the retail store and increase its online presence. It also showcases budgeted costs and sales promotion strategies in different years. Presenting 3 Year Roadmap For Retail Store Launch Sample PDF to dispense important information. This template comprises Four stages. It also presents valuable insights into the topics including Purpose Budgeted Costs, Sales Promotion Strategy. This is a completely customizable PowerPoint theme that can be put to use immediately. So, download it and address the topic impactfully.

Comparison Of B2B Market And B2C Segmentation Based On Customer Involvement Ideas PDF
This slide covers segmentation of B2C and B2B markets based on involvement in comparative form. It includes comparison based on target market size, number of buyers, buying process, sales cycle durations, sales drivers. Presenting Comparison Of B2B Market And B2C Segmentation Based On Customer Involvement Ideas PDF to dispense important information. This template comprises five stages. It also presents valuable insights into the topics including Involvement, Sales Cycle Duration, Target Market Size. This is a completely customizable PowerPoint theme that can be put to use immediately. So, download it and address the topic impactfully.

Company AR Process To Collect Outstanding Amount Topics PDF
This slide contains the process to collect the outstanding balance from customers who have purchased goods or services on credit. It includes steps such as sales quotation, sales order, delivery, invoice, collect payment and reconciliation. Presenting Company AR Process To Collect Outstanding Amount Topics PDF to dispense important information. This template comprises six stages. It also presents valuable insights into the topics including Reconciliation, Collect Payment, Sales Quotation. This is a completely customizable PowerPoint theme that can be put to use immediately. So, download it and address the topic impactfully.

Financial Statement Ppt PowerPoint Presentation Outline File Formats
This is a financial statement ppt powerpoint presentation outline file formats. This is a five stage process. The stages in this process are trends of sales cycle times, quarter over quarter revenue growth, revenue trends, deal drop off by stage.

Line Chart Ppt PowerPoint Presentation Model Design Templates
This is a line chart ppt powerpoint presentation model design templates. This is a two stage process. The stages in this process are sales in percentage, financial years, product.

Essential Features Of Customer Relationship Management Software Formats PDF
This slide shows the essential features of customer relationship management software which includes customer contact management, managing prospects, opportunity management, forecasting sales, marketing technology, sales data analysis, statistical reports, etc. Presenting Essential Features Of Customer Relationship Management Software Formats PDF to dispense important information. This template comprises tweleve stages. It also presents valuable insights into the topics including Marketing Technology, Sales Data Analysis, Statistical Reports. This is a completely customizable PowerPoint theme that can be put to use immediately. So, download it and address the topic impactfully.

Operational Marketing Tactical Plan Kpis To Track Performance Background PDF
This slide provides KPIs to determine the overall effectiveness of the companys marketing plan. These include KPIs such as cost per lead, cost per customer acquisition, marketing rate of investment, sales qualified leads, and sales revenue. Presenting Operational Marketing Tactical Plan Kpis To Track Performance Background PDF to dispense important information. This template comprises five stages. It also presents valuable insights into the topics including Cost Per Lead, Cost Per Customer Acquisition, Sales Qualified Leads. This is a completely customizable PowerPoint theme that can be put to use immediately. So, download it and address the topic impactfully.

Line Chart Ppt PowerPoint Presentation Ideas Example
This is a line chart ppt powerpoint presentation ideas example. This is a two stage process. The stages in this process are sales in percentage, bar graph, business, marketing, growth.

Line Chart Ppt PowerPoint Presentation Gallery Rules
This is a line chart ppt powerpoint presentation gallery rules. This is a two stage process. The stages in this process are financial years, product, sales in percentage, line chart, growth.

Scatter Chart Template 1 Ppt PowerPoint Presentation Outline Gridlines
This is a scatter chart template 1 ppt powerpoint presentation outline gridlines. This is a one stage process. The stages in this process are scatter chart, sales in percentage, business, marketing, growth.

Combo Chart Ppt PowerPoint Presentation Shapes
This is a combo chart ppt powerpoint presentation shapes. This is a eight stage process. The stages in this process are combo chart, business, marketing, sales in percentage, bar graph.
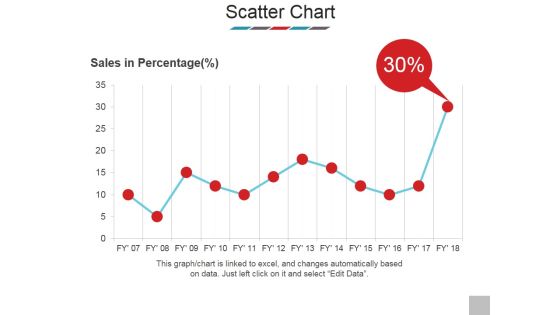
Scatter Chart Ppt PowerPoint Presentation Model Show
This is a scatter chart ppt powerpoint presentation model show. This is a one stage process. The stages in this process are sales in percentage, scatter chart, business, bar graph, marketing.

Area Chart Ppt PowerPoint Presentation Styles Images
This is a area chart ppt powerpoint presentation styles images. This is a two stage process. The stages in this process are sales in percentage, product, graph, business, marketing.

Bar Chart Ppt PowerPoint Presentation Ideas Graphic Tips
This is a bar chart ppt powerpoint presentation ideas graphic tips. This is a seven stage process. The stages in this process are sales in percentage, bar chart, growth, business, marketing.

Area Chart Financial Ppt PowerPoint Presentation Outline Professional
This is a area chart financial ppt powerpoint presentation outline professional. This is a four stage process. The stages in this process are product, sales in percentage, financial year.

Area Chart Ppt PowerPoint Presentation Infographics File Formats
This is a area chart ppt powerpoint presentation infographics file formats. This is a two stage process. The stages in this process are area chart, product, sales in percentage, growth, success.
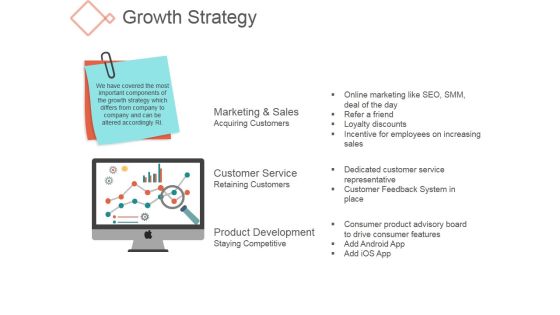
Growth Strategy Ppt PowerPoint Presentation Clipart
This is a growth strategy ppt powerpoint presentation clipart. This is a one stage process. The stages in this process are marketing and sales acquiring customers, customer service retaining customers.

Column Chart Ppt PowerPoint Presentation Gallery Design Inspiration
This is a column chart ppt powerpoint presentation gallery design inspiration. This is a two stage process. The stages in this process are column chart, product, sales in percentage, financial years.

Four Pyramids With Growth Steps Powerpoint Slides
This business slide has been designed with four pyramids. This PowerPoint template may use to display sales growth and analysis. Prove the viability of your ideas using this impressive slide.
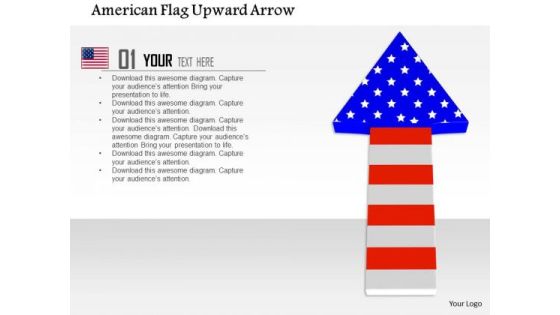
Stock Photo American Flag Upward Arrow PowerPoint Slide
Show the growth of US market and marketing strategy with this innovative image slide. This image slide contains the graphic of US flag and upward arrow. Use this image for your US business and sales growth related topics.

Circle Of Marketing For Growth Sample Diagram Ppt Images Gallery
This is a circle of marketing for growth sample diagram ppt images gallery. This is a five stage process. The stages in this process are channel development, websites that work, sales and distribution, new ways to sell, branding to lead.

Bar Chart Ppt PowerPoint Presentation Infographic Template Skills
This is a bar chart ppt powerpoint presentation infographic template skills. This is a nine stage process. The stages in this process are sales in percentage, finance, business, marketing, strategy, success.

Stacked Column Template 2 Ppt PowerPoint Presentation Visuals
This is a stacked column template 2 ppt powerpoint presentation visuals. This is a twelve stage process. The stages in this process are business, marketing, analysis, sales in percentage, finance, growth strategy.

Clustered Column Line Ppt Powerpoint Presentation Gallery Mockup
This is a clustered column line ppt powerpoint presentation gallery mockup. This is a four stage process. The stages in this process are product, sales in percentage, product, growth.

Scatter Chart Template 3 Ppt PowerPoint Presentation Styles Demonstration
This is a scatter chart template 3 ppt powerpoint presentation styles demonstration. This is a one stage process. The stages in this process are sales in percentage, finance, business, marketing, growth.

Column Chart Ppt PowerPoint Presentation Ideas Vector
This is a column chart ppt powerpoint presentation ideas vector. This is a two stage process. The stages in this process are column chart, product, financial years, sales in percentage, growth.

Column Chart Ppt PowerPoint Presentation Layouts Tips
This is a column chart ppt powerpoint presentation layouts tips. This is a six stage process. The stages in this process are sales in percentage, financial year, bar graph, growth, success.

Area Chart Ppt PowerPoint Presentation Inspiration Graphics
This is a area chart ppt powerpoint presentation inspiration graphics. This is a two stage process. The stages in this process are product, area chart, business, growth, sales in percentage.

Column Chart Ppt PowerPoint Presentation Slides Show
This is a column chart ppt powerpoint presentation slides show. This is a two stage process. The stages in this process are column chart, product, sales in percentage, financial year, growth.

3d Man With Blue Bar Graph And Red Growth Arrow
This Power Point diagram has been designed with graphic of 3d man and business graphs. This conceptual image can be used to displays business progress and growth. Use this editable slide for business and sales growth related presentations.

Line Chart Ppt PowerPoint Presentation Layouts Example
This is a line chart ppt powerpoint presentation layouts example. This is a two stage process. The stages in this process are sales in percentage, product, financial years, growth, success.

Line Chart Ppt PowerPoint Presentation Show Guide
This is a line chart ppt powerpoint presentation show guide. This is a two stage process. The stages in this process are product, sales in percentage, financial years, growth, success.

Bar Diagram Ppt PowerPoint Presentation Gallery Structure
This is a bar diagram ppt powerpoint presentation gallery structure. This is a three stage process. The stages in this process are financial in years, sales in percentage, bar graph, growth, success.
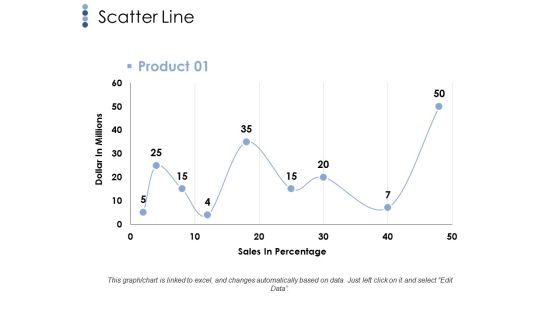
Scatter Line Ppt PowerPoint Presentation File Infographics
This is a scatter line ppt powerpoint presentation file infographics. This is a one stage process. The stages in this process are scatter line, dollar in millions, sales in percentage, business.

Line Chart Ppt PowerPoint Presentation Professional Grid
This is a line chart ppt powerpoint presentation professional grid. This is a two stage process. The stages in this process are sales in percentage, financial years, product, line chart.
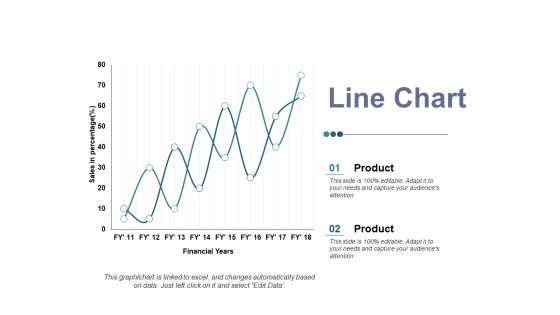
Line Chart Ppt PowerPoint Presentation Ideas Elements
This is a line chart ppt powerpoint presentation ideas elements. This is a two stage process. The stages in this process are product, sales in percentage, financial year, business, line chart.

Curve Chart For Product Life Cycle Presentation Outline
This is a curve chart for product life cycle presentation outline. This is a five stage process. The stages in this process are sales over time, product extension, introduction, growth, maturity, decline, time.


 Continue with Email

 Home
Home


