AI PPT Maker
Templates
PPT Bundles
Design Services
Business PPTs
Business Plan
Management
Strategy
Introduction PPT
Roadmap
Self Introduction
Timelines
Process
Marketing
Agenda
Technology
Medical
Startup Business Plan
Cyber Security
Dashboards
SWOT
Proposals
Education
Pitch Deck
Digital Marketing
KPIs
Project Management
Product Management
Artificial Intelligence
Target Market
Communication
Supply Chain
Google Slides
Research Services
 One Pagers
All Categories
-
Home
- Customer Favorites
- Revenue
Revenue
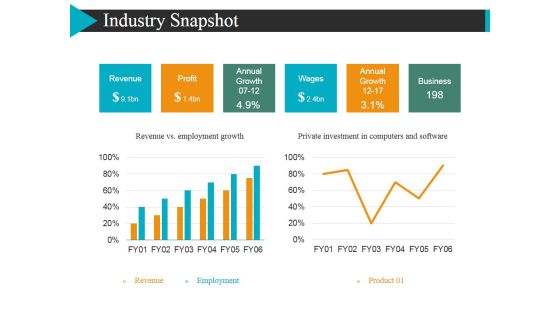
Industry Snapshot Template 2 Ppt Powerpoint Presentation Layouts Sample
This is a industry snapshot template 2 ppt powerpoint presentation layouts sample. This is a two stage process. The stages in this process are revenue, profit, annual growth, wages.

Competitor Analysis Ppt PowerPoint Presentation Pictures Designs Download
This is a competitor analysis ppt powerpoint presentation pictures designs download. This is a six stage process. The stages in this process are revenue, profit, market share, main activity, number of employee, product quality.

Break Even Analysis Ppt PowerPoint Presentation Layouts Portrait
This is a break even analysis ppt powerpoint presentation layouts portrait. This is a six stage process. The stages in this process are key comments on the table, units of output, total cost, sales revenue, profit.

competition comparison table ppt powerpoint presentation infographics design inspiration
This is a competition comparison table ppt powerpoint presentation infographics design inspiration. This is a seven stage process. The stages in this process are revenue, profit, market share, main activity, number of employee.

Competitor Analysis Ppt PowerPoint Presentation Outline Rules
This is a competitor analysis ppt powerpoint presentation outline rules. This is a seven stage process. The stages in this process are revenue, profit, market share, main activity, number of employee.

Competitor Analysis Ppt PowerPoint Presentation Layouts Background Image
This is a competitor analysis ppt powerpoint presentation layouts background image. This is a five stage process. The stages in this process are profit, revenue, market share, main activity, number of employee, product quality.

Break Even Analysis Ppt PowerPoint Presentation Styles Samples
This is a break even analysis ppt powerpoint presentation styles samples. This is a two stage process. The stages in this process are break even point, break even volume, profit, total revenue, total costs, variable cost.

Competitor Analysis Ppt PowerPoint Presentation Show Infographics
This is a competitor analysis ppt powerpoint presentation show infographics. This is a seven stage process. The stages in this process are revenue, profit, market, share, main activity, number of employee.
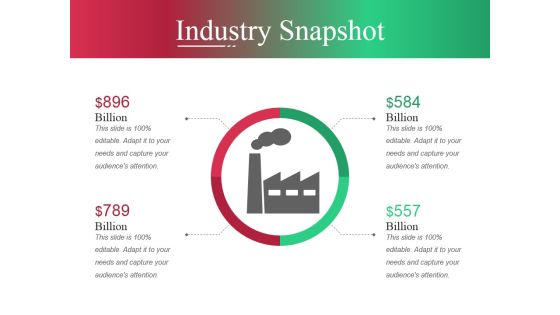
Industry Snapshot Template Ppt PowerPoint Presentation Slides Shapes
This is a industry snapshot template ppt powerpoint presentation slides shapes. This is a two stage process. The stages in this process are revenue, profit, annual growth, wages, annual growth, business.

Competitor Analysis Ppt PowerPoint Presentation Ideas Icons
This is a competitor analysis ppt powerpoint presentation ideas icons. This is a seven stage process. The stages in this process are revenue, profit, market share, main activity, number of employee.

Competitor Analysis Template Ppt PowerPoint Presentation Pictures Diagrams
This is a competitor analysis template ppt powerpoint presentation pictures diagrams. This is a seven stage process. The stages in this process are revenue, profit, market share, number of employee, product quality, main activity.

Consequences Of Poor Quality Ppt PowerPoint Presentation Show Grid
This is a consequences of poor quality ppt powerpoint presentation show grid. This is a six stage process. The stages in this process are lost revenue, lost customers, increased costs, lost productivity, lower profits.

Break Even Analysis Ppt PowerPoint Presentation Portfolio Clipart
This is a break even analysis ppt powerpoint presentation portfolio clipart. This is a five stage process. The stages in this process are fixed cost, variable cost, sales revenue, profit, key comments on the table, units of output.

Comparison Based On Criteria Ppt PowerPoint Presentation Outline Pictures
This is a comparison based on criteria ppt powerpoint presentation outline pictures. This is a six stage process. The stages in this process are revenue, profit, market share, main activity, number of employee.

Comparison Based On Criteria Ppt PowerPoint Presentation Show Icon
This is a comparison based on criteria ppt powerpoint presentation show icon. This is a six stage process. The stages in this process are revenue, profit, market share, main activity, number of employee.

Comparison Based On Criteria Ppt PowerPoint Presentation Gallery Themes
This is a comparison based on criteria ppt powerpoint presentation gallery themes. This is a seven stage process. The stages in this process are revenue, profit, market share, main activity, product quality.

Comparison Based On Criteria Ppt PowerPoint Presentation Gallery Sample
This is a comparison based on criteria ppt powerpoint presentation gallery sample. This is a six stage process. The stages in this process are revenue, profit, market share, main activity, number of employee.

Comparison Based On Criteria Ppt PowerPoint Presentation Icon Example Introduction
This is a comparison based on criteria ppt powerpoint presentation icon example introduction. This is a six stage process. The stages in this process are criteria, revenue, profit, market share, main activity.

Comparison Based On Criteria Ppt PowerPoint Presentation Show File Formats
This is a comparison based on criteria ppt powerpoint presentation show file formats. This is a six stage process. The stages in this process are revenue, profit, market share, main activity, number of employee.

Comparison Based On Criteria Ppt PowerPoint Presentation Slides Skills
This is a comparison based on criteria ppt powerpoint presentation slides skills. This is a five stage process. The stages in this process are revenue, profit, market share, main activity, number of employees, product quality.

Comparison Based On Criteria Ppt PowerPoint Presentation Show Outline
This is a comparison based on criteria ppt powerpoint presentation show outline. This is a six stage process. The stages in this process are revenue, profit, market share, main activity, number of employees.

Comparison Based On Criteria Ppt PowerPoint Presentation Show Graphics Pictures
This is a comparison based on criteria ppt powerpoint presentation show graphics pictures. This is a seven stage process. The stages in this process are competitor, revenue, profit, market share, main activity.

Comparison Based On Criteria Ppt PowerPoint Presentation Styles Picture
This is a comparison based on criteria ppt powerpoint presentation styles picture. This is a five stage process. The stages in this process are competitor, revenue, profit, criteria, market share.

Comparison Based On Criteria Ppt PowerPoint Presentation Infographic Template Layout Ideas
This is a comparison based on criteria ppt powerpoint presentation infographic template layout ideas. This is a seven stage process. The stages in this process are revenue, profit, market share, main activity, number of employees, product quality.

Comparison Based On Criteria Ppt PowerPoint Presentation Styles Designs
This is a comparison based on criteria ppt powerpoint presentation styles designs. This is a three stage process. The stages in this process are revenue, profit, market share, main activity, number of employees, product quality.

Comparison Based On Criteria Ppt PowerPoint Presentation Model Inspiration
This is a comparison based on criteria ppt powerpoint presentation model inspiration. This is a seven stage process. The stages in this process are revenue, profit, market share, number of employees, product quality.

Quarterly Budget Analysis Ppt PowerPoint Presentation Outline Background Image
This is a quarterly budget analysis ppt powerpoint presentation outline background image. This is a two stage process. The stages in this process are budget, this quarter, sales revenue, cost of sales, gross profits.

Actual Vs Target Variance Ppt PowerPoint Presentation Professional Clipart Images
This is a actual vs target variance ppt powerpoint presentation professional clipart images. This is a seven stage process. The stages in this process are cost, budget, variation, revenue, profit.

Comparison Based On Criteria Ppt PowerPoint Presentation Model Layouts
This is a comparison based on criteria ppt powerpoint presentation model layouts. This is a seven stage process. The stages in this process are revenue, profit, market share, main activity, product quality.

Forecast And Projection Ppt PowerPoint Presentation Gallery Display
This is a forecast and projection ppt powerpoint presentation gallery display. This is a four stage process. The stages in this process are revenue, expenses, purchases, project profit, budget.

Consequences Of Poor Quality Ppt PowerPoint Presentation Styles Guidelines
This is a consequences of poor quality ppt powerpoint presentation styles guidelines. This is a six stage process. The stages in this process are lost revenue, lost customers, increased cost, damaged brand, lower profits.

Comparison Based On Criteria Ppt PowerPoint Presentation Gallery Information
This is a comparison based on criteria ppt powerpoint presentation gallery information. This is a six stage process. The stages in this process are criteria, revenue, profit, business, competitor.

Consequences Of Poor Quality Ppt PowerPoint Presentation Ideas Graphics
This is a Consequences Of Poor Quality Ppt PowerPoint Presentation Ideas Graphics. This is a six stage process. The stages in this process are lost revenue, lost customers, increased costs, lost productivity, lower profits, damaged brand.

Executive Summary Ppt PowerPoint Presentation Layouts Clipart
This is a executive summary ppt powerpoint presentation layouts clipart. This is a seven stage process. The stages in this process are revenue, profits, operational cost, total customers, marketing channels.

Executive Summary Ppt PowerPoint Presentation Outline Diagrams
This is a executive summary ppt powerpoint presentation outline diagrams. This is a two stage process. The stages in this process are revenue, profits, operational cost, total customers, marketing channels.

Annual Business Financial Summary Dashboard Themes PDF
This slide shows annual financial report dashboard of company to monitor yearly business performance. It includes various indicators such as revenue, net profits, costs and breakdown of cost. Showcasing this set of slides titled Annual Business Financial Summary Dashboard Themes PDF. The topics addressed in these templates are Revenue, Costs, Net Profit. All the content presented in this PPT design is completely editable. Download it and make adjustments in color, background, font etc. as per your unique business setting.
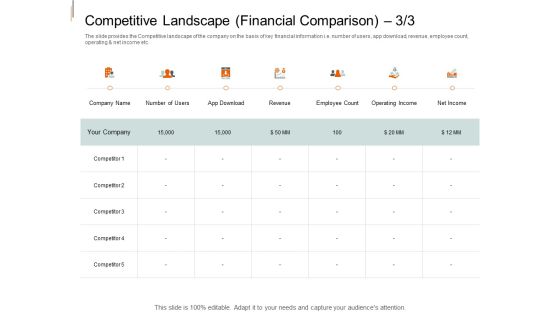
Equity Crowd Investing Competitive Landscape Financial Comparison Competitor Ideas PDF
The slide provides the Competitive landscape of the company on the basis of key financial information i.e. number of users, app download, revenue, employee count, operating and net income etc. Deliver an awe inspiring pitch with this creative equity crowd investing competitive landscape financial comparison competitor ideas pdf bundle. Topics like revenue, employee count, operating income, net income can be discussed with this completely editable template. It is available for immediate download depending on the needs and requirements of the user.

Business Statistics Related To Operations And Financial Statements Themes PDF
This slide provides information about some of the company financial and operational details such as Revenue, Worldwide Monthly Users, Global Market Share, Data Centers, number of consumers globally etc. Deliver an awe inspiring pitch with this creative business statistics related to operations and financial statements themes pdf bundle. Topics like revenue, operating income, product development expenses, net income, market share can be discussed with this completely editable template. It is available for immediate download depending on the needs and requirements of the user.
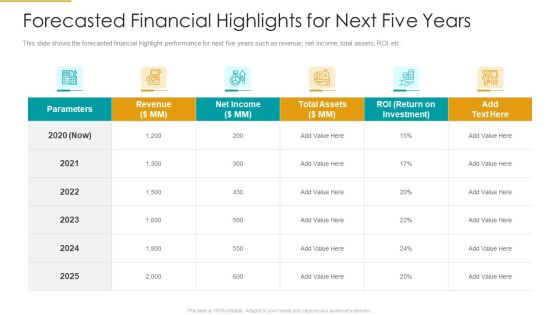
Forecasted Financial Highlights For Next Five Years Portrait PDF
This slide shows the forecasted financial highlight performance for next five years such as revenue, net income, total assets, ROI, etc. Deliver an awe inspiring pitch with this creative forecasted financial highlights for next five years portrait pdf. Topics like parameters, revenue, net income, total assets, investment can be discussed with this completely editable template. It is available for immediate download depending on the needs and requirements of the user.
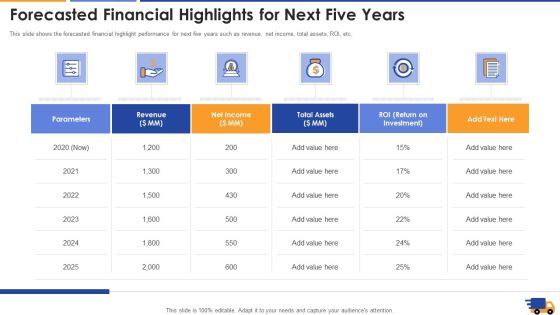
Forecasted Financial Highlights For Next Five Years Demonstration Pdf
This slide shows the forecasted financial highlight performance for next six years such as revenue, net income, total assets, ROI, etc. Deliver and pitch your topic in the best possible manner with this forecasted financial highlights for next five years demonstration pdf. Use them to share invaluable insights on revenue, net income, investment and impress your audience. This template can be altered and modified as per your expectations. So, grab it now.
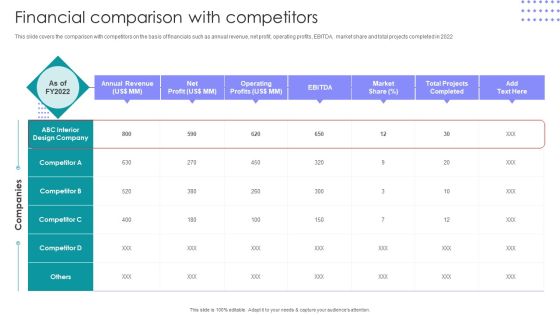
Interior Design Company Outline Financial Comparison With Competitors Download PDF
This slide covers the comparison with competitors on the basis of financials such as annual revenue, net profit, operating profits, EBITDA, market share and total projects completed in 2022. Deliver and pitch your topic in the best possible manner with this Interior Design Company Outline Financial Comparison With Competitors Download PDF. Use them to share invaluable insights on Annual Revenue, Net Profit, Operating Profits and impress your audience. This template can be altered and modified as per your expectations. So, grab it now.

Clinical Services Company Profile Research Business Financials Rules PDF
The slide describes financial details for Research business vertical. It showcase revenue, gross profit, operating profit, EBIDTA and net profit along with margin. Deliver an awe inspiring pitch with this creative Clinical Services Company Profile Research Business Financials Rules PDF bundle. Topics like Net Profit Margin, Revenue, Business can be discussed with this completely editable template. It is available for immediate download depending on the needs and requirements of the user.
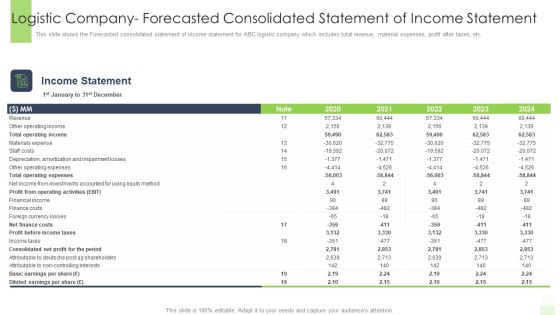
Logistic Company Forecasted Consolidated Statement Of Income Statement Professional PDF
This slide shows the Forecasted consolidated statement of income statement for ABC logistic company which includes total revenue, material expenses, profit after taxes, etc. Deliver and pitch your topic in the best possible manner with this logistic company forecasted consolidated statement of income statement professional pdf. Use them to share invaluable insights on revenue, operating expenses, finance costs and impress your audience. This template can be altered and modified as per your expectations. So, grab it now.
Financial Benchmark Evaluation Of Retail Companies Professional PDF
This slide shows comparison analysis of different retail companies based on various benchmarks . it include benchmarks like revenue, net profit, gross profit etc. Showcasing this set of slides titled Financial Benchmark Evaluation Of Retail Companies Professional PDF. The topics addressed in these templates are Revenue, Net Profit, Gross Profit. All the content presented in this PPT design is completely editable. Download it and make adjustments in color, background, font etc. as per your unique business setting.

Monthly Wise Income Statement Projection For Coming Year Ppt Summary Example PDF
This slide shows the monthly financials of the company which covers net revenue, profit, expenses, EBIT etc. Deliver an awe-inspiring pitch with this creative monthly wise income statement projection for coming year ppt summary example pdf bundle. Topics like revenue, expenses, gross profit, cost goods sold, interest can be discussed with this completely editable template. It is available for immediate download depending on the needs and requirements of the user.
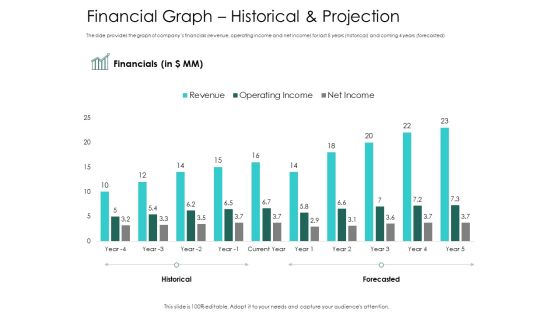
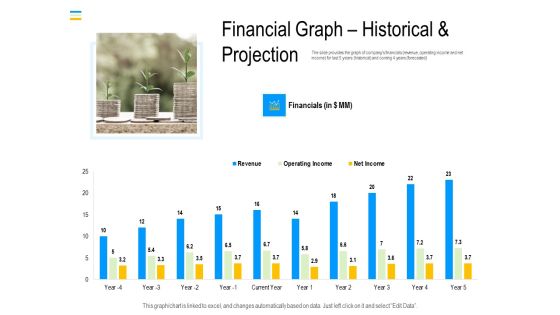
Hybrid Investment Pitch Deck Financial Graph Historical And Projection Ppt Portfolio Design Inspiration PDF
The slide provides the graph of companys financials revenue, operating income and net income for last 5 years historical and coming 4 years forecasted. Deliver an awe inspiring pitch with this creative hybrid investment pitch deck financial graph historical and projection ppt portfolio design inspiration pdf bundle. Topics like financial, revenue, operating income, net income can be discussed with this completely editable template. It is available for immediate download depending on the needs and requirements of the user.

Convertible Debenture Funding Financial Graph Historical And Projection Ppt Professional Themes PDF
The slide provides the graph of companys financials revenue, operating income and net income for the current year and the coming 4 years forecasted. Deliver an awe-inspiring pitch with this creative convertible debenture funding financial graph historical and projection ppt professional themes pdf bundle. Topics like revenue, operating income, net income, forecasted, financials, current year can be discussed with this completely editable template. It is available for immediate download depending on the needs and requirements of the user.

Convertible Bond Financing Pitch Deck Financial Graph Historical And Projection Slides PDF
The slide provides the graph of companys financials revenue, operating income and net income for the current year and the coming 4 years forecasted. Deliver an awe-inspiring pitch with this creative convertible bond financing pitch deck financial graph historical and projection slides pdf bundle. Topics like revenue, operating income, net income, financial can be discussed with this completely editable template. It is available for immediate download depending on the needs and requirements of the user.

Subordinated Loan Funding Financial Graph Historical And Projection Ppt Model File Formats PDF
The slide provides the graph of companys financials revenue, operating income and net income for last 5 years historical and coming 4 years forecasted. Deliver and pitch your topic in the best possible manner with this subordinated loan funding financial graph historical and projection ppt model file formats pdf. Use them to share invaluable insights on revenue, operating income, net income, current year. and impress your audience. This template can be altered and modified as per your expectations. So, grab it now.

Convertible Preferred Stock Funding Pitch Deck Financial Graph Historical And Projection Themes PDF
The slide provides the graph of companys financials revenue, operating income and net income for the current year and the coming 4 years forecasted. Deliver an awe inspiring pitch with this creative convertible preferred stock funding pitch deck financial graph historical and projection themes pdf bundle. Topics like revenue, operating income, net income can be discussed with this completely editable template. It is available for immediate download depending on the needs and requirements of the user.

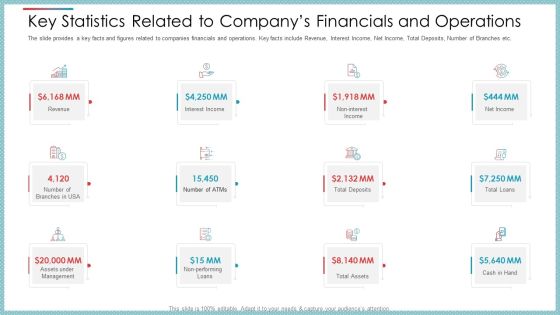
Key Statistics Related To Companys Financials And Operations Ppt File Clipart PDF
The slide provides a key facts and figures related to companies financials and operations. Key facts include Revenue, Interest Income, Net Income, Total Deposits, Number of Branches etc.Deliver and pitch your topic in the best possible manner with this key statistics related to companys financials and operations ppt file clipart pdf. Use them to share invaluable insights on net income, revenue, interest income and impress your audience. This template can be altered and modified as per your expectations. So, grab it now.
Key Statistics Related To Companys Financials And Operations Ppt Pictures Introduction PDF
The slide provides a key facts and figures related to companies financials and operations. Key facts include Revenue, Interest Income, Net Income, Total Deposits, Number of Branches etc. Deliver and pitch your topic in the best possible manner with this key statistics related to companys financials and operations ppt pictures introduction pdf. Use them to share invaluable insights on net income, revenue, interest income and impress your audience. This template can be altered and modified as per your expectations. So, grab it now.

Key Statistics Related To Companys Financials And Operations Ppt Outline Example PDF
The slide provides a key facts and figures related to companies financials and operations. Key facts include Revenue, Interest Income, Net Income, Total Deposits, Number of Branches etc. Deliver an awe-inspiring pitch with this creative key statistics related to companys financials and operations ppt outline example pdf. bundle. Topics like net income, revenue, interest income can be discussed with this completely editable template. It is available for immediate download depending on the needs and requirements of the user.

Tour Management Company Profile Financial Comparison With Competitors Summary PDF
This slide shows the financial comparison with competitors on the basis of annual revenue, operating profit, net profit, market share, employee count and service coverage of 2022.Deliver and pitch your topic in the best possible manner with this Tour Management Company Profile Financial Comparison With Competitors Summary PDF Use them to share invaluable insights on Annual Revenue, Operating Profit, Employee Count and impress your audience. This template can be altered and modified as per your expectations. So, grab it now.

Tour Agency Business Profile Financial Comparison With Competitors Demonstration PDF
This slide shows the financial comparison with competitors on the basis of annual revenue, operating profit, net profit, market share, employee count and service coverage of 2022.Deliver and pitch your topic in the best possible manner with this Tour Agency Business Profile Financial Comparison With Competitors Demonstration PDF Use them to share invaluable insights on Annual Revenue, Operating Profit, Employee Count and impress your audience. This template can be altered and modified as per your expectations. So, grab it now.

Company Financial Performance Indicators Comparative Analysis Of Two Firms Elements PDF
This slide showcases financial comparative analysis of two firms. It includes revenue, net and gross profit, assets, liabilities, capital and shareholders equity. Showcasing this set of slides titled Company Financial Performance Indicators Comparative Analysis Of Two Firms Elements PDF. The topics addressed in these templates are Revenue, Net Profit, Gross Profit. All the content presented in this PPT design is completely editable. Download it and make adjustments in color, background, font etc. as per your unique business setting.

Consolidated Statement Of Income Graphics PDF
This slide shows the consolidated statement of income which includes total revenue, cost of goods sold, gross profit, sales, etc. Presenting consolidated statement of income graphics pdf to provide visual cues and insights. Share and navigate important information on one stages that need your due attention. This template can be used to pitch topics like expenses, sales, income, revenue, gross profit. In addtion, this PPT design contains high resolution images, graphics, etc, that are easily editable and available for immediate download.

Investor Pitch Deck For Interim Financing Monthly Wise Income Statement Projection For Coming Year Clipart PDF
This slide shows the monthly financials of the company which covers net revenue, profit, expenses , EBIT etc.Deliver and pitch your topic in the best possible manner with this investor pitch deck for interim financing monthly wise income statement projection for coming year clipart pdf. Use them to share invaluable insights on total net revenue, expenses, advertising and promotion, depreciation and amortization and impress your audience. This template can be altered and modified as per your expectations. So, grab it now.
Mezzanine Debt Financing Pitch Deck Financial Graph Historical And Projection Demonstration PDF
The slide provides the graph of companys financials revenue, operating income and net income for last five years historical and coming four years forecasted. Deliver and pitch your topic in the best possible manner with this mezzanine debt financing pitch deck financial graph historical and projection demonstration pdf. Use them to share invaluable insights on financials, revenue, operating income and impress your audience. This template can be altered and modified as per your expectations. So, grab it now.

Reduce Expenses Powerpoint Slide Presentation Examples
This is a reduce expenses powerpoint slide presentation examples. This is a seven stage process. The stages in this process are reduce expenses, increase gross revenue, performance and service, operations management process, customer management process, innovation process, communication amongst workers.
