AI PPT Maker
Templates
PPT Bundles
Design Services
Business PPTs
Business Plan
Management
Strategy
Introduction PPT
Roadmap
Self Introduction
Timelines
Process
Marketing
Agenda
Technology
Medical
Startup Business Plan
Cyber Security
Dashboards
SWOT
Proposals
Education
Pitch Deck
Digital Marketing
KPIs
Project Management
Product Management
Artificial Intelligence
Target Market
Communication
Supply Chain
Google Slides
Research Services
 One Pagers
All Categories
-
Home
- Customer Favorites
- Revenue
Revenue

Pandl Kpis Ppt PowerPoint Presentation Professional Backgrounds
This is a pandl kpis ppt powerpoint presentation professional backgrounds. This is a four stage process. The stages in this process are business, revenue, operating profit, cogs, net profit.

Company Sales And Performance Dashboard Ppt PowerPoint Presentation Show Structure
This is a company sales and performance dashboard ppt powerpoint presentation show structure. This is a four stage process. The stages in this process are year product sales, month growth in revenue, profit margins graph, year profits.

Financials Summary Base Plan Vs Stretch Plan Ppt PowerPoint Presentation Microsoft
This is a financials summary base plan vs stretch plan ppt powerpoint presentation microsoft. This is a three stage process. The stages in this process are revenue, cost of sales, gross profit, customer acquisition cost, other operating cost expense.

Current State Analysis Financial Comparison Ppt Powerpoint Presentation File Graphic Tips
This is a current state analysis financial comparison ppt powerpoint presentation file graphic tips. This is a five stage process. The stages in this process are revenue, profits, cash balance.
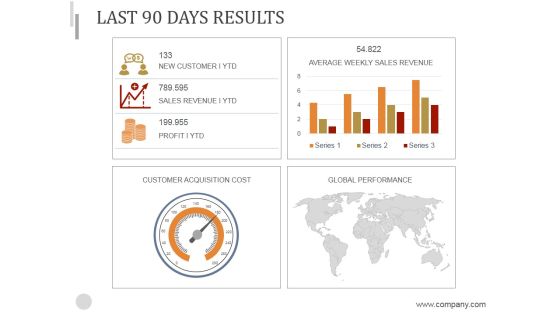
Last 90 Days Results Ppt PowerPoint Presentation Background Image
This is a last 90 days results ppt powerpoint presentation background image. This is a four stage process. The stages in this process are customer acquisition cost, global performance, average weekly sales revenue.

Last 90 Days Results Ppt PowerPoint Presentation Graphics
This is a last 90 days results ppt powerpoint presentation graphics. This is a five stage process. The stages in this process are new customer ytd, average weekly sales revenue, above sales target i ytd, customer acquisition cost, global performance.

External Analysis Industry Trends Ppt PowerPoint Presentation File Outfit
This is a external analysis industry trends ppt powerpoint presentation file outfit. This is a two stage process. The stages in this process are revenue, export, bar, finance, analysis.
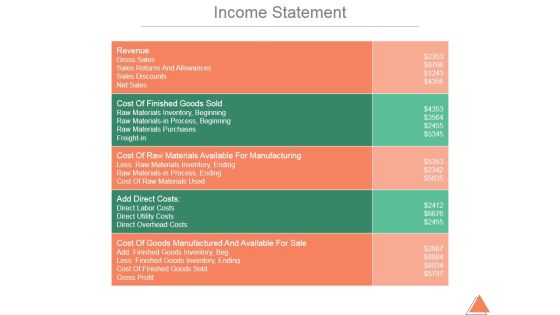
Income Statement Ppt PowerPoint Presentation Background Images
This is a income statement ppt powerpoint presentation background images. This is a five stage process. The stages in this process are revenue, gross sales, sales returns and allowances, sales discounts, net sales.
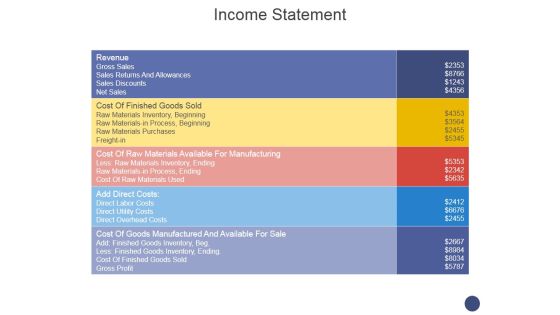
Income Statement Ppt PowerPoint Presentation Model Background
This is a income statement ppt powerpoint presentation model background. This is a five stage process. The stages in this process are revenue, gross sales, net sales, sales discounts, freight in.
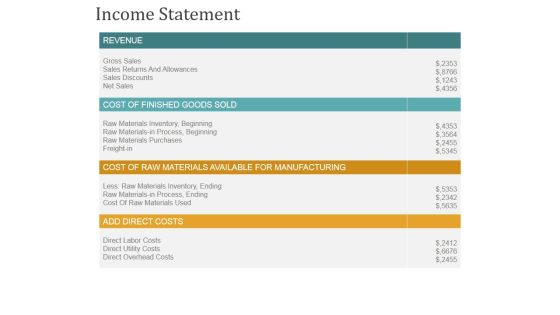
Income Statement Ppt PowerPoint Presentation Model Slide
This is a income statement ppt powerpoint presentation model slide. This is a four stage process. The stages in this process are revenue, cost of finished goods sold, add direct costs.

Financial Projections Table 1 Ppt PowerPoint Presentation Background Image
This is a financial projections table 1 ppt powerpoint presentation background image. This is a four stage process. The stages in this process are clients, revenue, net, financial projections.

Financial Projections Table 1 Ppt PowerPoint Presentation Summary Outline
This is a financial projections table 1 ppt powerpoint presentation summary outline. This is a four stage process. The stages in this process are financial projections, clients, revenue, net.

Financial Projections Table 1 Ppt PowerPoint Presentation Summary Background Image
This is a financial projections table 1 ppt powerpoint presentation summary background image. This is a four stage process. The stages in this process are financial projections, clients, revenue, net.
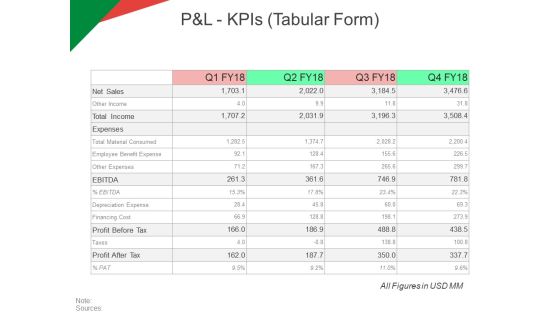
P And L Kpis Tabular Form Ppt PowerPoint Presentation Model Ideas
This is a p and l kpis tabular form ppt powerpoint presentation model ideas. This is a four stage process. The stages in this process are revenue, operating profit, cogs, net profit.
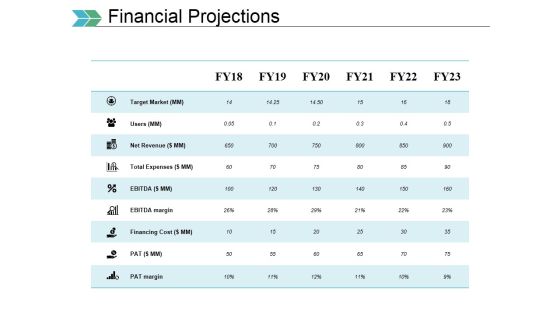
Financial Projections Ppt PowerPoint Presentation Ideas Example Introduction
This is a financial projections ppt powerpoint presentation ideas example introduction. This is a five stage process. The stages in this process are target market, users, net revenue, total expenses, financing cost.
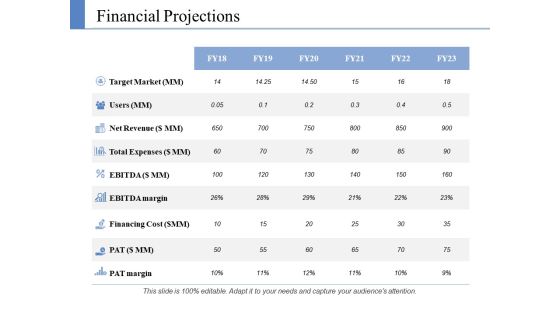
Financial Projections Ppt PowerPoint Presentation Layouts Example File
This is a financial projections ppt powerpoint presentation layouts example file. This is a six stage process. The stages in this process are target market, users, net revenue, total expenses, financing cost.

Potential Price And Profit Margins Ppt PowerPoint Presentation Design Templates
This is a potential price and profit margins ppt powerpoint presentation design templates. This is a three stage process. The stages in this process are cost item, beginning, revenue, cost of production, gross profit, gross profit margin, other income, wages.
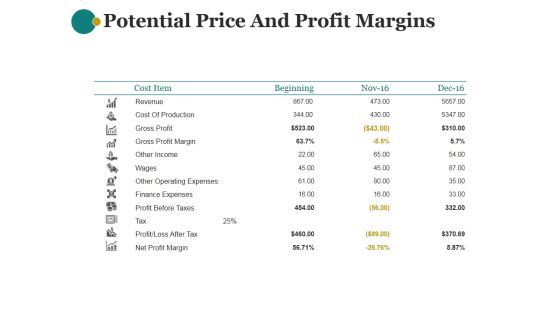
Potential Price And Profit Margins Ppt PowerPoint Presentation Background Images
This is a potential price and profit margins ppt powerpoint presentation background images. This is a three stage process. The stages in this process are cost item, beginning, revenue, cost of production, gross profit, gross profit margin, other income.
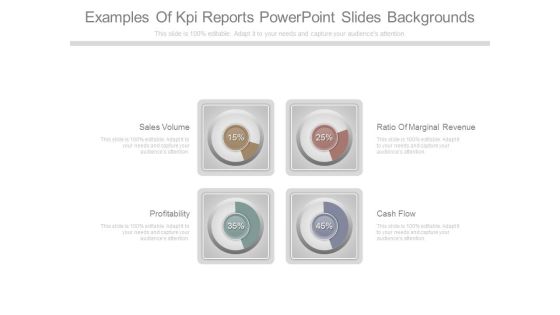
Examples Of Kpi Reports Powerpoint Slides Backgrounds
This is a examples of kpi reports powerpoint slides backgrounds. This is a four stage process. The stages in this process are sales volume, profitability, ratio of marginal revenue, cash flow.

Industry Overview Template 1 Ppt PowerPoint Presentation Show
This is a industry overview template 1 ppt powerpoint presentation show. This is a six stage process. The stages in this process are revenue, profit, annual growth, wages, businesses.

Internet Marketing Objectives Ppt PowerPoint Presentation Layouts Smartart
This is a internet marketing objectives ppt powerpoint presentation layouts smartart. This is a six stage process. The stages in this process are sales leads, product types, sales revenue, profit margins, repeat sales, web visitors.

Consequences Of Poor Quality Ppt PowerPoint Presentation Portfolio Graphics Tutorials
This is a consequences of poor quality ppt powerpoint presentation portfolio graphics tutorials. This is a six stage process. The stages in this process are lost revenue, lost customers, increased costs, lower profits, lost productivity.

Consequences Of Poor Quality Ppt PowerPoint Presentation Gallery Layout Ideas
This is a consequences of poor quality ppt powerpoint presentation gallery layout ideas. This is a six stage process. The stages in this process are lost revenue, lost productivity, lower profits, lost customers, increased costs.

Consequences Of Poor Quality Ppt PowerPoint Presentation File Graphics
This is a consequences of poor quality ppt powerpoint presentation file graphics. This is a six stage process. The stages in this process are lost revenue, lost customers, increased costs, damaged brand, lower profits.

Sales Performance Dashboard Ppt PowerPoint Presentation Ideas Portfolio
This is a sales performance dashboard ppt powerpoint presentation ideas portfolio. This is a three stage process. The stages in this process are revenue, new customers, gross profit, customer satisfaction, sales comparison.
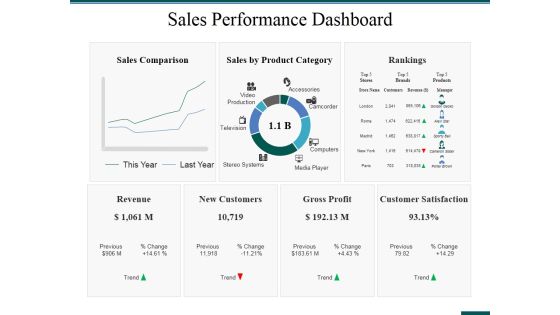
Sales Performance Dashboard Ppt PowerPoint Presentation Ideas Format Ideas
This is a sales performance dashboard ppt powerpoint presentation ideas format ideas. This is a three stage process. The stages in this process are rankings, revenue, new customers, gross profit, customer satisfaction.
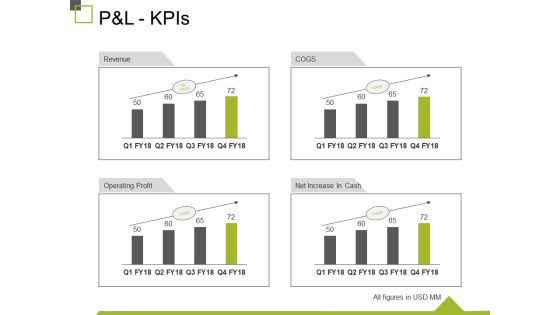
P And L Kpis Ppt PowerPoint Presentation Show Design Inspiration
This is a p and l kpis ppt powerpoint presentation show design inspiration. This is a four stage process. The stages in this process are revenue, operating profit, cogs, net increase in cash, business.

Sales Performance Dashboard Template Ppt PowerPoint Presentation Professional Elements
This is a sales performance dashboard template ppt powerpoint presentation professional elements. This is a eight stage process. The stages in this process are sales comparison, sales by product category, sales by month, brand profitability, revenue.

Competitor Analysis Ppt PowerPoint Presentation Inspiration Ideas
This is a competitor analysis ppt powerpoint presentation inspiration ideas. This is a four stage process. The stages in this process are sales development, performance indicators, revenue, sales, sales development of industry.
Sales Kpi Tracker Ppt PowerPoint Presentation Layout
This is a sales kpi tracker ppt powerpoint presentation layout. This is a six stage process. The stages in this process are leads created, sales ratio, opportunities won, top products in revenue, actual.

Competitor Analysis Ppt PowerPoint Presentation Pictures Visuals
This is a competitor analysis ppt powerpoint presentation pictures visuals. This is a four stage process. The stages in this process are sales development, performance indicators, sales development of industry, sales, revenue.
Highlights Ppt PowerPoint Presentation Icon Infographics
This is a highlights ppt powerpoint presentation icon infographics. This is a five stage process. The stages in this process are countries, stores worldwide, total revenue, associates, monthly website visitors.

Competitor Analysis Ppt PowerPoint Presentation File Influencers
This is a competitor analysis ppt powerpoint presentation file influencers. This is a four stage process. The stages in this process are revenue, sales, placeholder, performance indicators, sales development.

Competitor Analysis Ppt PowerPoint Presentation File Graphics Example
This is a competitor analysis ppt powerpoint presentation file graphics example. This is a four stage process. The stages in this process are revenue, sales development of industry, own company, placeholder, competitor.
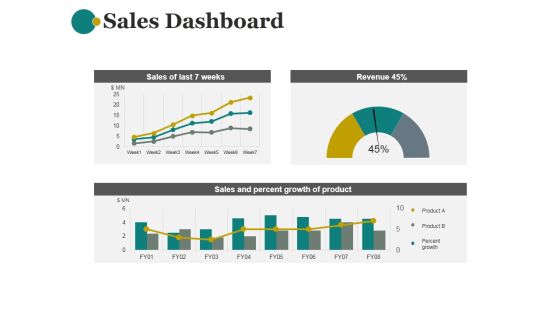
Sales Dashboard Template 1 Ppt PowerPoint Presentation Show
This is a sales dashboard template 1 ppt powerpoint presentation show. This is a three stage process. The stages in this process are sales of last 7 weeks, revenue, sales and percent growth of product.

Executive Summary Template Ppt PowerPoint Presentation Slides Themes
This is a executive summary template ppt powerpoint presentation slides themes. This is a six stage process. The stages in this process are about us, our revenue, marketing plan, our mission and vision, our targets, operating plan.
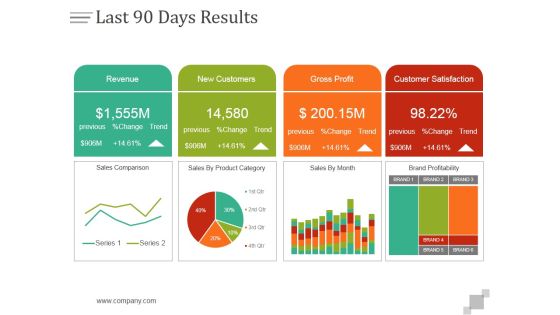
Last 90 Days Results Ppt PowerPoint Presentation Design Templates
This is a last 90 days results ppt powerpoint presentation design templates. This is a four stage process. The stages in this process are revenue, new customers, gross profit, customer satisfaction.

Industry Snapshot Template 2 Ppt PowerPoint Presentation Layouts Examples
This is a industry snapshot template 2 ppt powerpoint presentation layouts examples. This is a three stage process. The stages in this process are revenue, profit, annual growth, wages, annual growth, business.

Industry Snapshot Template 1 Ppt PowerPoint Presentation Gallery Design Ideas
This is a industry snapshot template 1 ppt powerpoint presentation gallery design ideas. This is a three stage process. The stages in this process are revenue, profit, annual growth, wages, business.
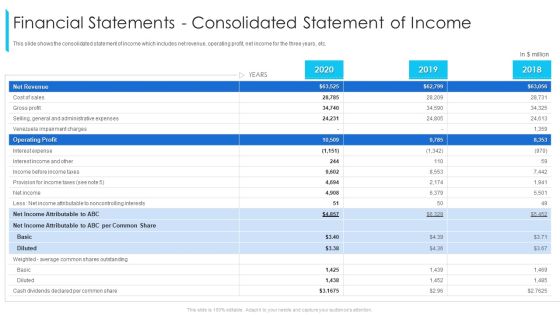
Financial Statements Consolidated Statement Of Income Ppt Infographics Inspiration PDF
This slide shows the consolidated statement of income which includes net revenue, operating profit, net income for the three years, etc. Deliver and pitch your topic in the best possible manner with this financial statements consolidated statement of income ppt infographics inspiration pdf. Use them to share invaluable insights on net revenue, operating profit, gross profit, cost of sales, interest expense and impress your audience. This template can be altered and modified as per your expectations. So, grab it now.
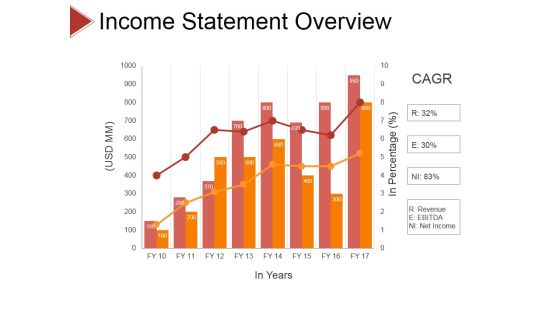
Income Statement Overview Ppt PowerPoint Presentation Slides Samples
This is a income statement overview ppt powerpoint presentation slides samples. This is a eight stage process. The stages in this process are business, strategy, analysis, pretention, revenue, ebitda, net income.

Financial Statements Consolidated Statement Of Income Ppt Portfolio Picture PDF
This slide shows the consolidated statement of income which includes net revenue, operating profit, net income for the three years, etc. Deliver and pitch your topic in the best possible manner with this financial statements consolidated statement of income ppt portfolio picture pdf. Use them to share invaluable insights on net revenue, cost of sales, gross profit and impress your audience. This template can be altered and modified as per your expectations. So, grab it now.
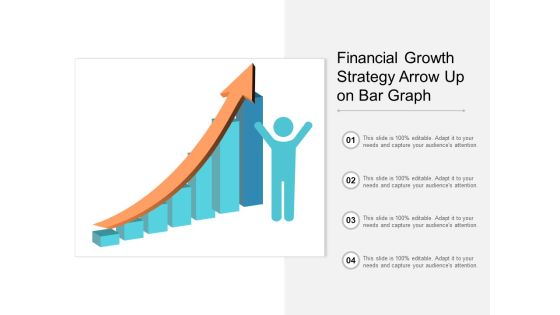
Financial Growth Strategy Arrow Up On Bar Graph Ppt PowerPoint Presentation Gallery Example
This is a financial growth strategy arrow up on bar graph ppt powerpoint presentation gallery example. This is a four stage process. The stages in this process are growth, increase sales, increase revenue.

Website Performance Review Template 2 Ppt PowerPoint Presentation Gallery Objects
This is a website performance review template 2 ppt powerpoint presentation gallery objects. This is a three stage process. The stages in this process are margin, revenue, expense, support, other operational.

Executive Summary Ppt PowerPoint Presentation Visual Aids Inspiration
This is a executive summary ppt powerpoint presentation visual aids inspiration. This is a five stage process. The stages in this process are company overview, financials, net revenue, particulars.

Profitability And Cost Management Presentation Backgrounds
This is a profitability and cost management presentation backgrounds. This is a four stage process. The stages in this process are increased revenue, market situation, reduced risk, resource utilization, asset utilization, smarter investment, decreased cost, performance measurement.

Company Annual Report Table With Percentages Ppt PowerPoint Presentation Slides
This is a company annual report table with percentages ppt powerpoint presentation slides. This is ten stage process. The stages in this process are send date time, email name, recipients, delivered, spam, opt out, open, transactions, revenue.
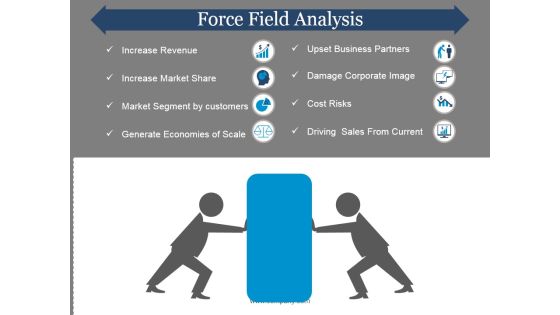
Force Field Analysis Template 1 Ppt PowerPoint Presentation Pictures
This is a force field analysis template 1 ppt powerpoint presentation pictures. This is a two stage process. The stages in this process are increase revenue, increase market sharel, market segment by customers, generate economies of scale.

Competitor Analysis Template 1 Ppt PowerPoint Presentation Gallery Demonstration
This is a competitor analysis template 1 ppt powerpoint presentation gallery demonstration. This is a four stage process. The stages in this process are business, strategy, marketing, planning, your company, revenue.

Content Marketing Performance Ppt PowerPoint Presentation Guidelines
This is a content marketing performance ppt powerpoint presentation guidelines. This is a eight stage process. The stages in this process are conversion rate, quality of leads, number of leads, sales revenue, website traffic.

Content Marketing Performance Template 1 Ppt PowerPoint Presentation Icon Skills
This is a content marketing performance template 1 ppt powerpoint presentation icon skills. This is a eight stage process. The stages in this process are conversion rate, website traffic, number of leads, sales revenue, quality of leads.

External Analysis Industry Trends Ppt PowerPoint Presentation Infographic Template Visuals
This is a external analysis industry trends ppt powerpoint presentation infographic template visuals. This is a two stage process. The stages in this process are export, revenue, percentage, years, business, analysis.
Sales KPI Tracker Ppt PowerPoint Presentation Icon Themes
This is a sales kpi tracker ppt powerpoint presentation icon themes. This is a six stage process. The stages in this process are business, marketing, opportunities won, top products in revenue, leads created.
Sales Kpi Tracker Ppt PowerPoint Presentation Visual Aids Files
This is a sales kpi tracker ppt powerpoint presentation visual aids files. This is a six stage process. The stages in this process are leads created, sales ratio, opportunities won, top products in revenue, open deals vs last yr.

Competitor Analysis Ppt PowerPoint Presentation Model Visual Aids
This is a competitor analysis ppt powerpoint presentation model visual aids. This is a four stage process. The stages in this process are competitor analysis, revenue, sales, sales development, performance indicators.
Sales Kpi Tracker Ppt PowerPoint Presentation Pictures Designs
This is a sales kpi tracker ppt powerpoint presentation pictures designs. This is a two stage process. The stages in this process are leads created, sales ratio, opportunities won, top products in revenue, win ratio vs last yr.

Competitor Analysis Ppt PowerPoint Presentation Layouts Background Images
This is a competitor analysis ppt powerpoint presentation layouts background images. This is a four stage process. The stages in this process are sales development of industry, revenue, performance indicators, sales development.

Competitor Analysis Ppt PowerPoint Presentation Model Show
This is a competitor analysis ppt powerpoint presentation model show. This is a four stage process. The stages in this process are performance indicators, sales development of industry, sales development, revenue, sales.

Competitor Analysis Template 1 Ppt PowerPoint Presentation File Grid
This is a competitor analysis template 1 ppt powerpoint presentation file grid. This is a four stage process. The stages in this process are finance, marketing, business, graph, analysis, revenue.

Competitor Analysis Ppt PowerPoint Presentation Outline Ideas
This is a competitor analysis ppt powerpoint presentation outline ideas. This is a four stage process. The stages in this process are sales development of industry, revenue, sales, performance indicators.
