Revenue Growth
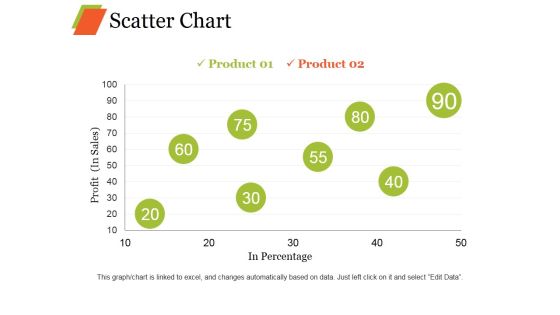
Scatter Chart Ppt PowerPoint Presentation Professional Graphic Images
This is a scatter chart ppt powerpoint presentation professional graphic images. This is a eight stage process. The stages in this process are product, profit, in percentage growth, business.
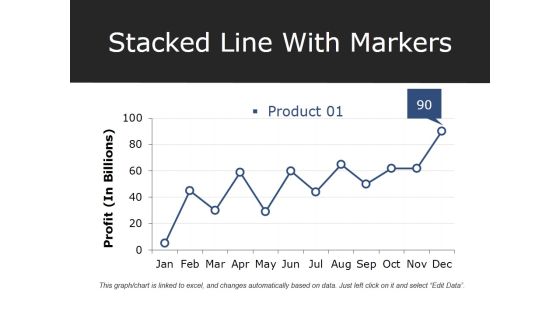
Stacked Line With Markers Ppt PowerPoint Presentation Professional Deck
This is a stacked line with markers ppt powerpoint presentation professional deck. This is a one stage process. The stages in this process are product, profit, growth, success, graph.

Clustered Column Line Ppt PowerPoint Presentation Show Influencers
This is a clustered column line ppt powerpoint presentation show influencers. This is a four stage process. The stages in this process are financial year, sales in percentage, product, growth, success.

Line Chart Ppt PowerPoint Presentation Layouts Example
This is a line chart ppt powerpoint presentation layouts example. This is a two stage process. The stages in this process are sales in percentage, product, financial years, growth, success.

Bar Diagram Ppt PowerPoint Presentation Gallery Structure
This is a bar diagram ppt powerpoint presentation gallery structure. This is a three stage process. The stages in this process are financial in years, sales in percentage, bar graph, growth, success.

Column Chart Ppt PowerPoint Presentation Layouts Tips
This is a column chart ppt powerpoint presentation layouts tips. This is a six stage process. The stages in this process are sales in percentage, financial year, bar graph, growth, success.

Bar Diagram Ppt PowerPoint Presentation Pictures Background Image
This is a bar diagram ppt powerpoint presentation pictures background image. This is a three stage process. The stages in this process are financial in years, sales in percentage, bar graph, growth, success.

Bar Graph Ppt PowerPoint Presentation Ideas Graphic Tips
This is a bar graph ppt powerpoint presentation ideas graphic tips. This is a three stage process. The stages in this process are financial year, sales in percentage, product, bar graph, growth.

Clustered Column Line Ppt PowerPoint Presentation Portfolio Outline
This is a clustered column line ppt powerpoint presentation portfolio outline. This is a four stage process. The stages in this process are sales in percentage, financial year, product, graph, growth.

Column Chart Ppt PowerPoint Presentation Gallery Slide Portrait
This is a column chart ppt powerpoint presentation gallery slide portrait. This is a two stage process. The stages in this process are sales in percentage, financial year, product, bar graph, growth.

Column Chart Ppt PowerPoint Presentation Ideas Vector
This is a column chart ppt powerpoint presentation ideas vector. This is a two stage process. The stages in this process are column chart, product, financial years, sales in percentage, growth.

Column Chart Ppt PowerPoint Presentation Slides Show
This is a column chart ppt powerpoint presentation slides show. This is a two stage process. The stages in this process are column chart, product, sales in percentage, financial year, growth.
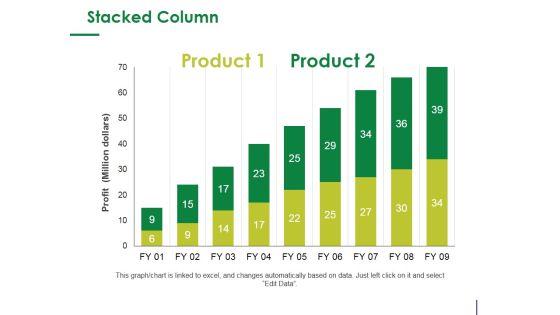
Stacked Column Ppt PowerPoint Presentation Infographic Template Design Ideas
This is a stacked column ppt powerpoint presentation infographic template design ideas. This is a two stage process. The stages in this process are product, profit, bar graph, growth, success.
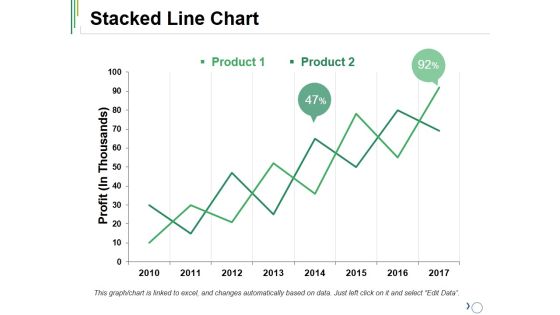
Stacked Line Chart Ppt PowerPoint Presentation Ideas Outfit
This is a stacked line chart ppt powerpoint presentation ideas outfit. This is a two stage process. The stages in this process are product, stacked line, profit, growth, success.

Column Chart Ppt PowerPoint Presentation Slides Visual Aids
This is a column chart ppt powerpoint presentation slides visual aids. This is a six stage process. The stages in this process are bar graph, growth, success, sales in percentage, financial year.

Line Chart Ppt PowerPoint Presentation Show Guide
This is a line chart ppt powerpoint presentation show guide. This is a two stage process. The stages in this process are product, sales in percentage, financial years, growth, success.
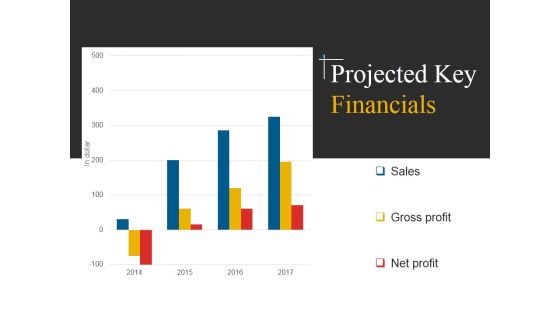
Projected Key Financials Template 2 Ppt PowerPoint Presentation Inspiration Example File
This is a projected key financials template 2 ppt powerpoint presentation inspiration example file. This is a four stage process. The stages in this process are sales, gross profit, net profit.
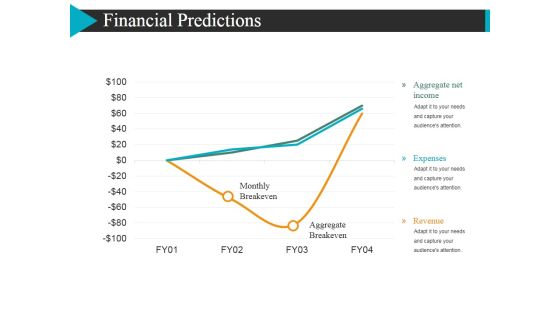
Financial Predictions Template 1 Ppt Powerpoint Presentation Portfolio Example Introduction
This is a financial predictions template 1 ppt powerpoint presentation portfolio example introduction. This is a three stage process. The stages in this process are monthly break even, aggregate net income, expenses.

Financial Management Cash Debtors Creditors Ppt PowerPoint Presentation Summary Mockup
This is a financial management cash debtors creditors ppt powerpoint presentation summary mockup. This is a four stage process. The stages in this process are financial capital, working capital management, companys managerial accounting.

Methods Of Raising Equity Capital Ppt PowerPoint Presentation Infographics Images
Presenting this set of slides with name methods of raising equity capital ppt powerpoint presentation infographics images. This is a seven stage process. The stages in this process are financial strategy, business financial trend, business strategy. This is a completely editable PowerPoint presentation and is available for immediate download. Download now and impress your audience.
Scatter Chart Ppt PowerPoint Presentation Icon Example Introduction
This is a scatter chart ppt powerpoint presentation icon example introduction. This is a two stage process. The stages in this process are product, profit, in percentage, growth, scattered chart.

Area Chart Ppt PowerPoint Presentation Infographic Template Layout
This is a area chart ppt powerpoint presentation infographic template layout. This is a two stage process. The stages in this process are product, profit, area chart, growth, success.
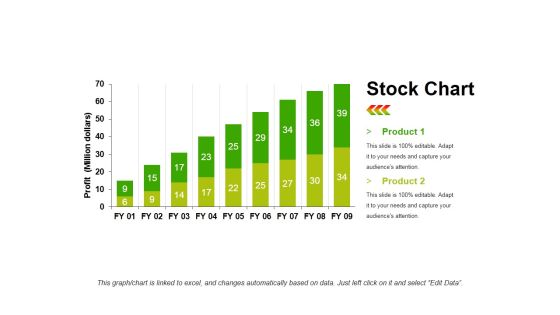
Stock Chart Template 1 Ppt PowerPoint Presentation Infographic Template Objects
This is a stock chart template 1 ppt powerpoint presentation infographic template objects. This is a two stage process. The stages in this process are product, profit, bar graph, growth, success.
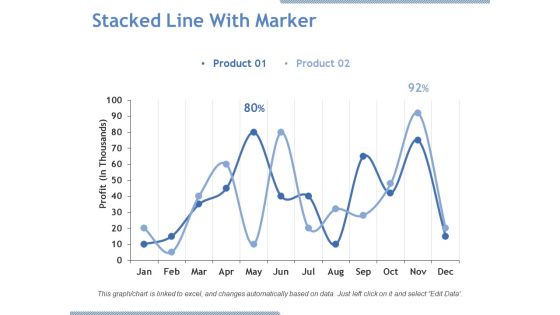
Stacked Line With Marker Ppt PowerPoint Presentation Pictures Graphics Download
This is a stacked line with marker ppt powerpoint presentation pictures graphics download. This is a two stage process. The stages in this process are product, profit, line chart, business, growth.
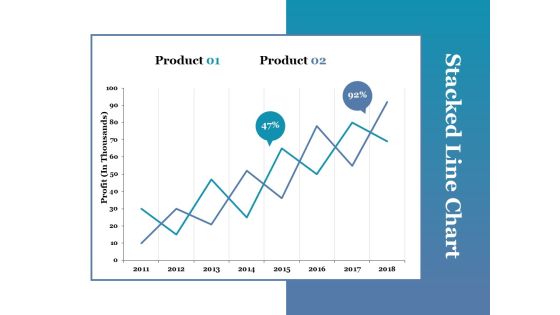
Stacked Line Chart Ppt PowerPoint Presentation Portfolio Picture
This is a stacked line chart ppt powerpoint presentation portfolio picture. This is a two stage process. The stages in this process are stacked line chart, product, profit, growth.

Line Chart Ppt PowerPoint Presentation Professional Graphics Design
This is a line chart ppt powerpoint presentation professional graphics design. This is a two stage process. The stages in this process are financial years, sales in percentage, product, growth, success.

Financial Analysis Ratios Ppt Slide Themes
This is a financial analysis ratios ppt slide themes. This is a five stage process. The stages in this process are liquidity ratio, asset turnover ratios, financial leverage ratios, profitability ratios, dividend policy ratios.
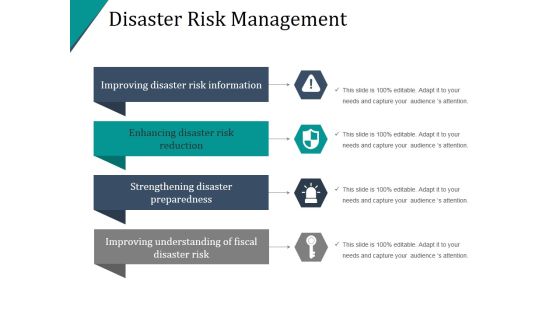
Disaster Risk Management Ppt PowerPoint Presentation Good
This is a disaster risk management ppt powerpoint presentation good. This is a four stage process. The stages in this process are improving disaster risk information, enhancing disaster risk reduction, strengthening disaster preparedness, improving understanding of fiscal disaster risk.
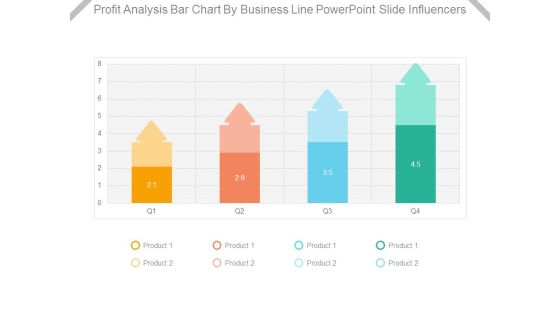
Profit Analysis Bar Chart By Business Line Powerpoint Slide Influencers
This is a profit analysis bar chart by business line powerpoint slide influencers. This is a four stage process. The stages in this process are product.
Ways To Save Money Ppt PowerPoint Presentation Pictures Graphics Download
This is a megaphone for business promotion ppt powerpoint presentation visual aids infographics. This is a stage process. The stages in this process are support, assistance, hand holding.

Business Opportunity Affiliate Business Income Insurance Business Protocol Ppt PowerPoint Presentation Infographics Examples
This is a business opportunity affiliate business income insurance business protocol ppt powerpoint presentation infographics examples. This is a four stage process. The stages in this process are business opportunity affiliate, business income insurance, business protocol.
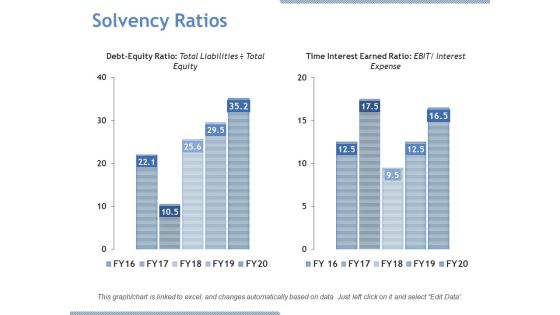
Solvency Ratios Ppt PowerPoint Presentation Inspiration
This is a solvency ratios ppt powerpoint presentation inspiration. This is a two stage process. The stages in this process are debt equity ratio, time interest earned ratio.

Classification Of Working Capital Ppt PowerPoint Presentation Pictures Icons
This is a classification of working capital ppt powerpoint presentation pictures icons. This is a seven stage process. The stages in this process are financial capital, working capital management, companys managerial accounting.

Working Capital Analysis Supplier Management Ppt PowerPoint Presentation Model Grid
This is a working capital analysis supplier management ppt powerpoint presentation model grid. This is a nine stage process. The stages in this process are financial capital, working capital management, companys managerial accounting.
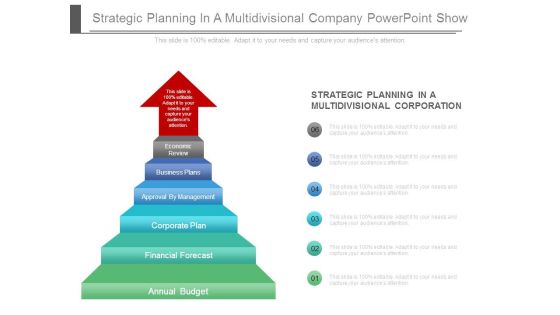
Strategic Planning In A Multidivisional Company Powerpoint Show
This is a strategic planning in a multidivisional company powerpoint show. This is a six stage process. The stages in this process are strategic planning in a multidivisional corporation, economic review, business plans, approval by management, corporate plan, financial forecast, annual budget.

Profit And Loss Break Even Analysis Ppt Sample File
This is a profit and loss break even analysis ppt sample file. This is a two stage process. The stages in this process are cost, loss, profit, fixed costs, break even point, quantity sold, units, total variable costs.

Area Stacked Ppt PowerPoint Presentation Shapes
This is a area stacked ppt powerpoint presentation shapes. This is a two stage process. The stages in this process are business, marketing, product, finance, profit.

Business Capital Investors Graph Powerpoint Presentation
This is a business capital investors graph powerpoint presentation. This is a five stage process. The stages in this process are public, venture capital, seed capital, angles, grants f and f$.

Clustered Column Line Ppt PowerPoint Presentation Icon Good
This is a clustered column line ppt powerpoint presentation icon good. This is a three stage process. The stages in this process are product, financial year, bar graph, business, growth.

Combo Chart Ppt PowerPoint Presentation Slides Outline
This is a combo chart ppt powerpoint presentation slides outline. This is a three stage process. The stages in this process are combo chart, growth, product, financial year, business.

Area Chart Ppt PowerPoint Presentation Show Layout Ideas
This is a area chart ppt powerpoint presentation show layout ideas. This is a two stage process. The stages in this process are product, in percentage, financial year, growth.
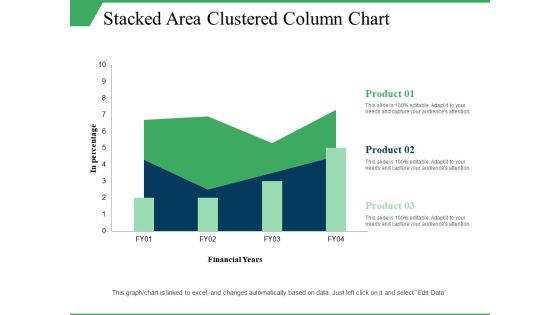
Stacked Area Clustered Column Chart Ppt PowerPoint Presentation Visual Aids Model
This is a stacked area clustered column chart ppt powerpoint presentation visual aids model. This is a three stage process. The stages in this process are in percentage, product, financial years, growth, column chart.

Capital Business Plan Template Presentation Examples
This is a capital business plan template presentation examples. This is a five stage process. The stages in this process are determine viability, business analysis, goal setting, strategic planning, raise capital.
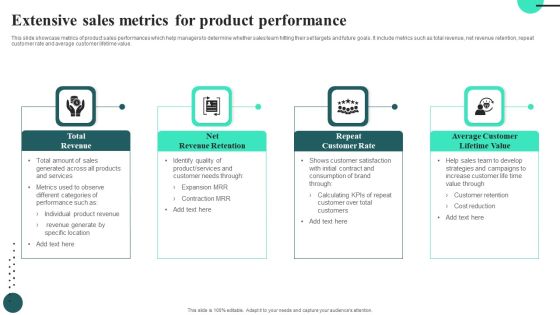
Extensive Sales Metrics For Product Performance Summary PDF
This slide showcase metrics of product sales performances which help managers to determine whether sales team hitting their set targets and future goals. It include metrics such as total revenue, net revenue retention, repeat customer rate and average customer lifetime value.Persuade your audience using this Extensive Sales Metrics For Product Performance Summary PDF. This PPT design covers four stages, thus making it a great tool to use. It also caters to a variety of topics including Total Revenue, Net Revenue Retention. Download this PPT design now to present a convincing pitch that not only emphasizes the topic but also showcases your presentation skills.
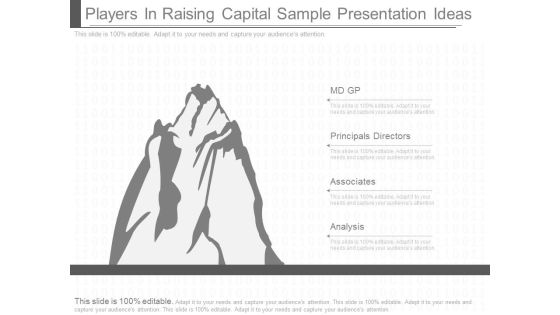
Players In Raising Capital Sample Presentation Ideas
This is a players in raising capital sample presentation ideas. This is a one stage process. The stages in this process are md gp, principals directors, associates, analysis.\n\n
Financials Ppt PowerPoint Presentation Show Icons
This is a financials ppt powerpoint presentation show icons. This is a three stage process. The stages in this process are minimum, medium, maximum.
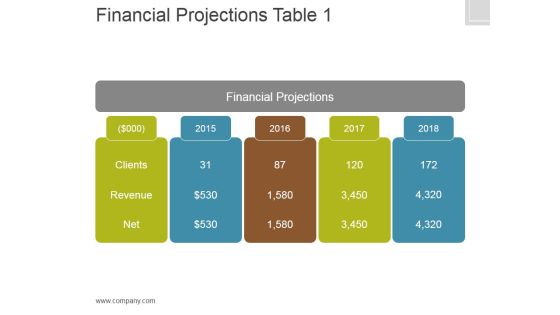
Financial Projections Table 1 Ppt PowerPoint Presentation Tips
This is a financial projections table 1 ppt powerpoint presentation tips. This is a five stage process. The stages in this process are financial projections, clients, revenue, net.

Financial Management Supply Planning And Forecasting Ppt PowerPoint Presentation Styles File Formats
This is a financial management supply planning and forecasting ppt powerpoint presentation styles file formats. This is a eight stage process. The stages in this process are financial capital, working capital management, companys managerial accounting.

Solvency Ratios Ppt PowerPoint Presentation Professional
This is a solvency ratios ppt powerpoint presentation professional. This is a two stage process. The stages in this process are debt equity ratio, time interest earned ratio, total liabilities, total equity, interest expense.
Five Staged Stair Diagram With Business Icons Powerpoint Templates
This business slide has been designed with hand holding dollar coin under water tap. This diagram displays the concept of money saving. Use this slide to make impressive presentations
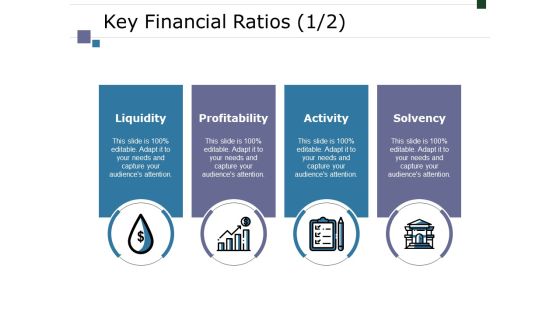
Key Financial Ratios Template 2 Ppt PowerPoint Presentation Ideas Mockup
This is a key financial ratios template 2 ppt powerpoint presentation ideas mockup. This is a four stage process. The stages in this process are liquidity, profitability, activity, solvency, business.

Capital Market Trends Ppt PowerPoint Presentation Layouts Microsoft Cpb
This is a capital market trends ppt powerpoint presentation layouts microsoft cpb. This is a seven stage process. The stages in this process are capital market trends.

Financial Ppt PowerPoint Presentation Files
This is a financial ppt powerpoint presentation files. This is a three stage process. The stages in this process are minimum, medium, maximum.
Wealth Management Icon Ppt PowerPoint Presentation Styles Examples
This is a wealth management icon ppt powerpoint presentation styles examples. This is a four stage process. The stages in this process are financial capital, working capital management, companys managerial accounting.
Green Upward Arrow With Gold Bricks Vector Icon Ppt PowerPoint Presentation Professional Files
Presenting this set of slides with name green upward arrow with gold bricks vector icon ppt powerpoint presentation professional files. This is a one stage process. The stages in this process are gold bar, gold investment, financial growth. This is a completely editable PowerPoint presentation and is available for immediate download. Download now and impress your audience.
Internet Marketing Objectives Ppt PowerPoint Presentation Icon Images
This is a internet marketing objectives ppt powerpoint presentation icon images. This is a six stage process. The stages in this process are sales, profit, product, repeat, sales, web.

Image Of Bitcoin Money Payment Network Ppt PowerPoint Presentation Professional Example Introduction
Presenting this set of slides with name image of bitcoin money payment network ppt powerpoint presentation professional example introduction. This is a one stage process. The stages in this dollar, money, currency, wealth, bitcoin. This is a completely editable PowerPoint presentation and is available for immediate download. Download now and impress your audience.
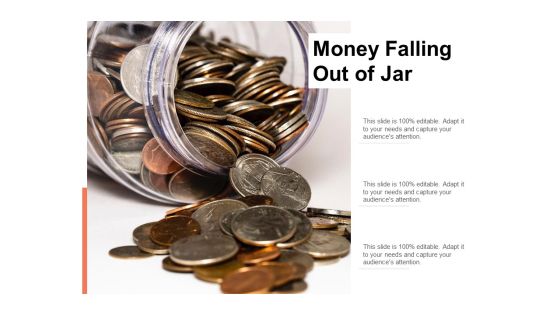
Money Falling Out Of Jar Ppt PowerPoint Presentation Summary Background Images
Presenting this set of slides with name money falling out of jar ppt powerpoint presentation summary background images. This is a one stage process. The stages in this dollar, money, currency, wealth, bitcoin. This is a completely editable PowerPoint presentation and is available for immediate download. Download now and impress your audience.

Cost Cutting And Money Saving Vector Icon Ppt PowerPoint Presentation Summary Objects
This is a cost cutting and money saving vector icon ppt powerpoint presentation summary objects. This is a four stage process. The stages in this process are cost saving icon, expenses saving icon, cost reduction icon.
Dollar On Human Hand Money Saving Vector Icon Ppt PowerPoint Presentation Model Structure
This is a dollar on human hand money saving vector icon ppt powerpoint presentation model structure. This is a four stage process. The stages in this process are cost saving icon, expenses saving icon, cost reduction icon.
 Home
Home