Revenue Growth

Bar Graph Ppt PowerPoint Presentation Outline File Formats
This is a bar graph ppt powerpoint presentation outline file formats. This is a nine stage process. The stages in this process are bar graph, business, management, success, strategy.

Competitor Analysis 2 X 2 Matrix Ppt PowerPoint Presentation Deck
This is a competitor analysis 2 x 2 matrix ppt powerpoint presentation deck. This is a four stage process. The stages in this process are business, marketing, management, matrix, analysis.

Crowdfunding Statistics Template 2 Ppt PowerPoint Presentation Styles Graphics Design
This is a crowdfunding statistics template 2 ppt powerpoint presentation styles graphics design. This is a seven stage process. The stages in this process are raised worldwide, crowding portals worldwide, no of portals.

Customer Service Bench Marketing Ppt PowerPoint Presentation Professional Summary
This is a customer service bench marketing ppt powerpoint presentation professional summary. This is a five stage process. The stages in this process are very poor, poor, good, excellent.

Bar Graph Ppt PowerPoint Presentation Styles Picture
This is a bar graph ppt powerpoint presentation styles picture. This is a four stage process. The stages in this process are business, strategy, marketing, analysis, chart and graph, bar graph.
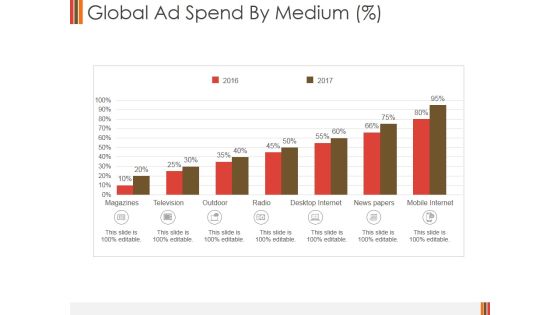
Global Ad Spend By Medium Ppt PowerPoint Presentation Ideas Design Templates
This is a global ad spend by medium ppt powerpoint presentation ideas design templates. This is a seven stage process. The stages in this process are magazines, television, outdoor, radio, desktop internet, news papers, mobile internet.

Web Traffic Insights Ppt PowerPoint Presentation Summary Vector
This is a web traffic insights ppt powerpoint presentation summary vector. This is a five stage process. The stages in this process are website ranks in june, traffic sources, engagement in june, subdomains.

Area Chart Ppt PowerPoint Presentation Styles Designs
This is a area chart ppt powerpoint presentation styles designs. This is a two stage process. The stages in this process are area chart, product.

Stacked Column Ppt PowerPoint Presentation Ideas Pictures
This is stacked column ppt powerpoint presentation ideas pictures. This is a two stage process. The stages in this process are product, in million, strategy management, business, finance.
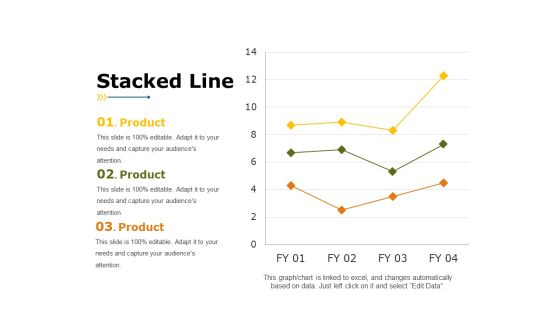
Stacked Line Ppt PowerPoint Presentation Background Image
This is a stacked line ppt powerpoint presentation background image. This is a three stage process. The stages in this process are product, stacked line, business, marketing, finance.
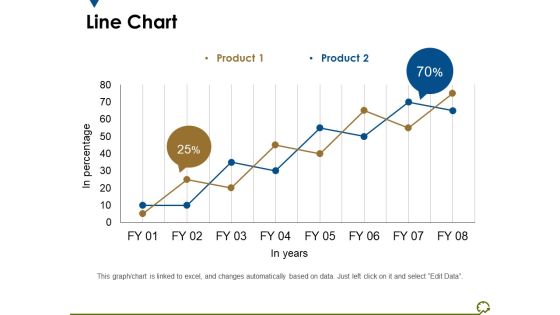
Line Chart Ppt PowerPoint Presentation Outline Diagrams
This is a line chart ppt powerpoint presentation outline diagrams. This is a two stage process. The stages in this process are in percentage, in years, percentage, business, marketing.

Line Chart Ppt PowerPoint Presentation Summary Graphic Tips
This is a line chart ppt powerpoint presentation summary graphic tips. This is a two stage process. The stages in this process are line chart, product, in percentage, analysis, business.

Column Chart Ppt PowerPoint Presentation File Graphics
This is a column chart ppt powerpoint presentation file graphics. This is a two stage process. The stages in this process are column chart, finance, analysis, marketing, business.

Change Management Experience Ppt PowerPoint Presentation Infographic Template Portfolio
This is a change management experience ppt powerpoint presentation infographic template portfolio. This is a one stage process. The stages in this process are finance, marketing, analysis, business, investment.

Combo Chart Finance Ppt PowerPoint Presentation Clipart
This is a combo chart finance ppt powerpoint presentation pictures show. This is a two stage process. The stages in this process are finance, marketing, management, investment, analysis.

Clustered Column Line Ppt PowerPoint Presentation Infographic Template Deck
This is a clustered column line ppt powerpoint presentation infographic template deck. This is a three stage process. The stages in this process are business, strategy, analysis, planning, sales in percentage, financial year.
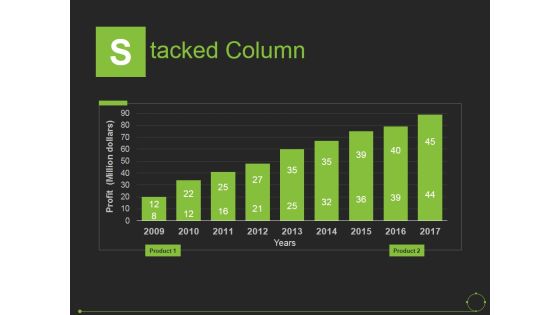
Stacked Column Ppt PowerPoint Presentation Slides Introduction
This is a stacked column ppt powerpoint presentation slides introduction. This is a nine stage process. The stages in this process are years, profit, product, business, marketing.
Line Chart Ppt PowerPoint Presentation Ideas Icon
This is a line chart ppt powerpoint presentation ideas icon. This is a two stage process. The stages in this process are profit, product, line chart.
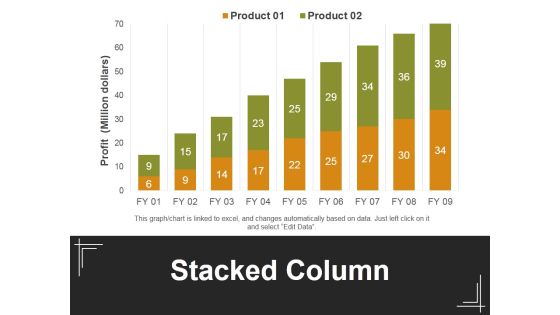
Stacked Column Ppt PowerPoint Presentation Outline Maker
This is a stacked column ppt powerpoint presentation outline maker. This is a two stage process. The stages in this process are profit, stacked bar, product, business, marketing.
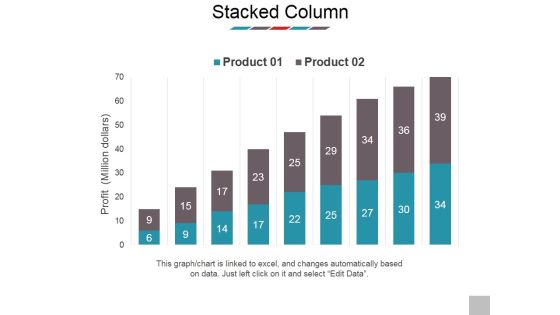
Stacked Column Ppt PowerPoint Presentation Professional Deck
This is a stacked column ppt powerpoint presentation professional deck. This is a two stage process. The stages in this process are profit, business, marketing, presentation, product.

Area Chart Ppt PowerPoint Presentation Samples
This is a area chart ppt powerpoint presentation samples. This is a two stage process. The stages in this process are financial year, sales in percentage, jan, feb.

Column Chart Ppt PowerPoint Presentation Gallery Design Inspiration
This is a column chart ppt powerpoint presentation gallery design inspiration. This is a two stage process. The stages in this process are column chart, product, sales in percentage, financial years.
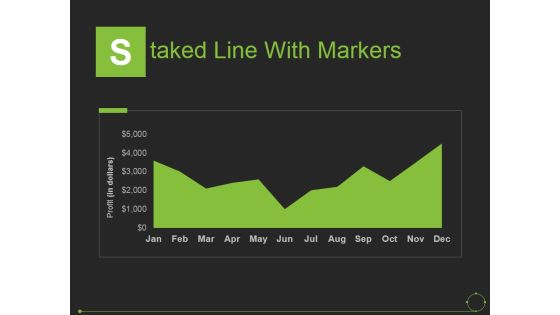
Staked Line With Markers Ppt PowerPoint Presentation Pictures Examples
This is a staked line with markers ppt powerpoint presentation pictures examples. This is a one stage process. The stages in this process are years, profit, product, business, marketing.

Stacked Line Chart Ppt PowerPoint Presentation Outline Examples
This is a stacked line chart ppt powerpoint presentation outline examples. This is a two stage process. The stages in this process are product, stacked line chart, business, marketing, profit.
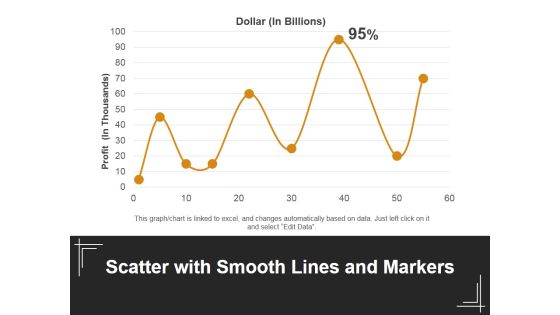
Scatter With Smooth Lines And Markers Ppt PowerPoint Presentation Outline Design Ideas
This is a scatter with smooth lines and markers ppt powerpoint presentation outline design ideas. This is a one stage process. The stages in this process are dollar, profit, line chart, business, marketing.

Bar Graph Ppt PowerPoint Presentation Model Graphic Tips
This is a bar graph ppt powerpoint presentation model graphic tips. This is a two stage process. The stages in this process are we are dollars in millions, financials years, bar graph, product, business.
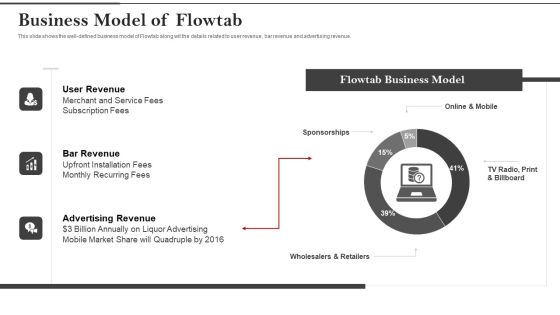
Flowtab Venture Capital Investment Business Model Of Flowtab Elements PDF
This slide shows the well defined business model of Flowtab along wit the details related to user revenue, bar revenue and advertising revenue. This is a flowtab venture capital investment business model of flowtab elements pdf template with various stages. Focus and dispense information on three stages using this creative set, that comes with editable features. It contains large content boxes to add your information on topics like user revenue, bar revenue, advertising revenue. You can also showcase facts, figures, and other relevant content using this PPT layout. Grab it now.

Conversion Rate Template 1 Ppt PowerPoint Presentation Styles
This is a conversion rate template 1 ppt powerpoint presentation styles. This is a two stage process. The stages in this process are net revenue, gross revenue.
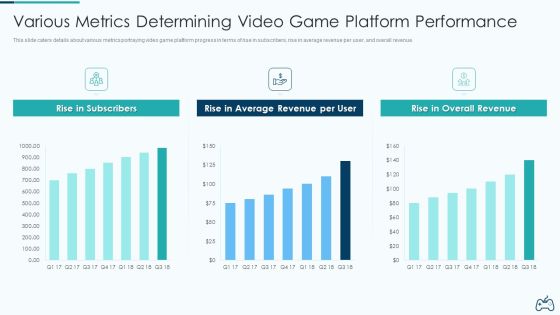
Electronic Game Pitch Deck Various Metrics Determining Video Game Platform Performance Designs PDF
This slide caters details about various metrics portraying video game platform progress in terms of rise in subscribers, rise in average revenue per user, and overall revenue. Deliver an awe inspiring pitch with this creative electronic game pitch deck various metrics determining video game platform performance designs pdf bundle. Topics like rise in subscribers, average revenue, overall revenue can be discussed with this completely editable template. It is available for immediate download depending on the needs and requirements of the user.
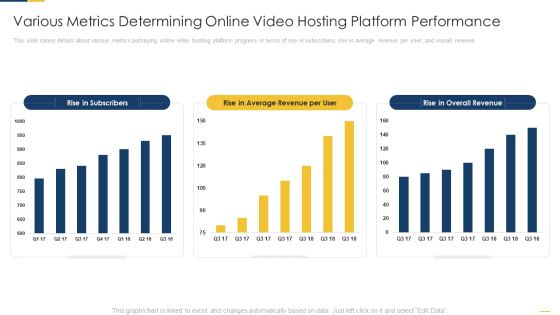
Various Metrics Determining Online Video Hosting Platform Performance Slides PDF
This slide caters details about various metrics portraying online video hosting platform progress in terms of rise in subscribers, rise in average revenue per user, and overall revenue. Deliver an awe inspiring pitch with this creative various metrics determining online video hosting platform performance slides pdf bundle. Topics like rise in subscribers, average revenue, overall revenue can be discussed with this completely editable template. It is available for immediate download depending on the needs and requirements of the user.

Competitor Analysis Template 4 Ppt PowerPoint Presentation Ideas Graphics Example
This is a competitor analysis template 4 ppt powerpoint presentation ideas graphics example. This is a four stage process. The stages in this process are revenue, your company, market share, competitor, analysis.

Key Metrics In Software Sales Strategy Pictures PDF
This slide presents key metrics to be tracked in software sales plan, that helps organisations to keep track of growth and profits generated over time. It includes monthly recurring revenue, average revenue per user, customer lifetime value and lead velocity rate Presenting Key Metrics In Software Sales Strategy Pictures PDF to dispense important information. This template comprises four stages. It also presents valuable insights into the topics including Monthly Recurring Revenue, Customer Lifetime Value, Lead Velocity Rate. This is a completely customizable PowerPoint theme that can be put to use immediately. So, download it and address the topic impactfully.

Crm Dashboard Kpis Ppt PowerPoint Presentation Inspiration Brochure
This is a crm dashboard kpis ppt powerpoint presentation inspiration brochure. This is a three stage process. The stages in this process are acquisition, active subscribers, revenue.

Financial Projections Ppt PowerPoint Presentation Images
This is a financial projections ppt powerpoint presentation images. This is a three stage process. The stages in this process are pat margin, target market, users, net revenue.

External Analysis Template 2 Ppt PowerPoint Presentation Pictures Grid
This is a external analysis template 2 ppt powerpoint presentation pictures grid. This is a two stage process. The stages in this process are revenue, export.

Competitor Comparison Template 2 Ppt PowerPoint Presentation Show Design Ideas
This is a competitor comparison template 2 ppt powerpoint presentation show design ideas. This is a four stage process. The stages in this process are competitor, profit, revenue.

Kpi Dashboard To Track Progress Of Tactics To Launch New Product Infographics PDF
Mentioned slide showcases KPI dashboard to monitor impact of product launch strategy on increasing business market share. It includes elements such as revenue, new customers, lead generation rate, customer satisfaction rate, revenue by customers, revenue and lead generation by marketing platform. Showcasing this set of slides titled Kpi Dashboard To Track Progress Of Tactics To Launch New Product Infographics PDF. The topics addressed in these templates are Quarterly Sales Comparison, Revenue Marketing, Revenue Customers. All the content presented in this PPT design is completely editable. Download it and make adjustments in color, background, font etc. as per your unique business setting.

Financial Business PowerPoint Template 0610
Calculation of the financial growth and investment

Network Business PowerPoint Template 0810
Business financial growth and network concept illustration

Financial Ppt PowerPoint Presentation File Format Ideas
This is a financial ppt powerpoint presentation file format ideas. This is a six stage process. The stages in this process are total assets, total tax paid, loan, revenue, deposits, net income.
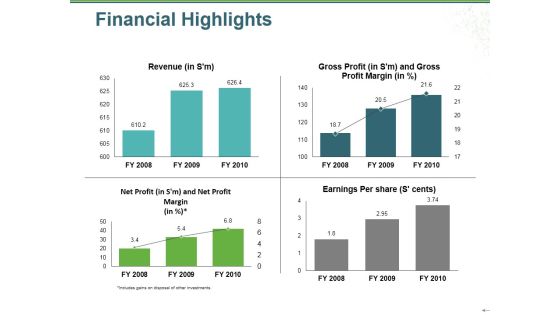
Financial Highlights Ppt PowerPoint Presentation Gallery Graphics Example
This is a financial highlights ppt powerpoint presentation gallery graphics example. This is a four stage process. The stages in this process are revenue, gross profit, net profit, earnings per share, bar graph.
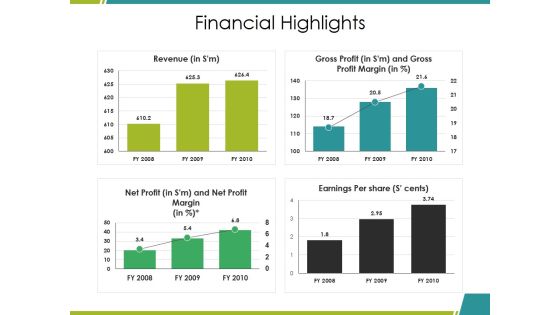
Financial Highlights Ppt PowerPoint Presentation Ideas Graphics Download
This is a financial highlights ppt powerpoint presentation ideas graphics download. This is a four stage process. The stages in this process are revenue, gross profit, net profit, earnings per share, bar graph.

Current Financial Highlights Ppt PowerPoint Presentation File Demonstration
This is a current financial highlights ppt powerpoint presentation show example. This is a four stage process. The stages in this process are revenue, net profit, earnings per share, gross profit.

Current State Analysis Financial Comparison Ppt PowerPoint Presentation Inspiration Good
This is a current state analysis financial comparison ppt powerpoint presentation inspiration good. This is a five stage process. The stages in this process are revenue, profits, cash balance, competitor.

Income Statement Graphical Representation Ppt PowerPoint Presentation Infographics Layouts
This is a income statement graphical representation ppt powerpoint presentation infographics layouts. This is a four stage process. The stages in this process are revenue, cogs, operating profit, net profit.
Income Statement Overview Ppt PowerPoint Presentation Infographic Template Icon
This is a income statement overview ppt powerpoint presentation infographic template icon. This is a five stage process. The stages in this process are revenue, profit margin, operating profit margin.
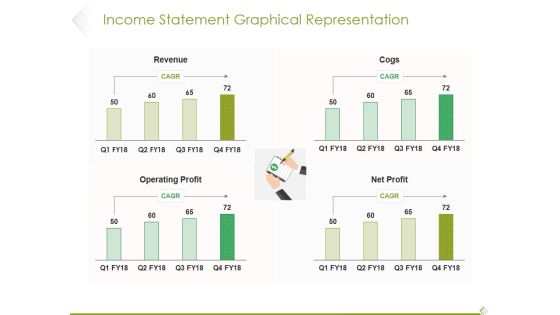
Income Statement Graphical Representation Ppt PowerPoint Presentation Infographic Template Influencers
This is a income statement graphical representation ppt powerpoint presentation infographic template influencers. This is a four stage process. The stages in this process are revenue, cogs, operating profit, profit.
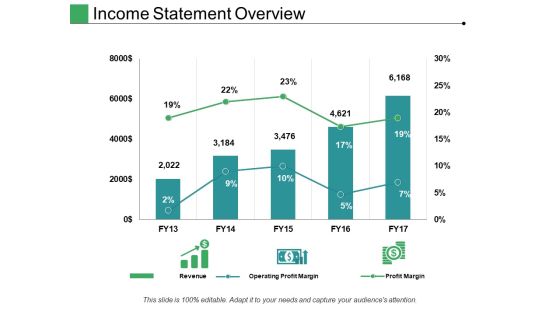
Income Statement Overview Ppt PowerPoint Presentation File Structure
This is a income statement overview ppt powerpoint presentation file structure. This is a five stage process. The stages in this process are revenue, operating profit margin, profit margin.

Pandl Kpis Tabular Form Ppt PowerPoint Presentation Visual Aids
This is a pandl kpis tabular form ppt powerpoint presentation visual aids. This is a four stage process. The stages in this process are revenue, cogs, operating profit, net profit.

Current State Analysis Financial Comparison Ppt Powerpoint Presentation File Graphic Tips
This is a current state analysis financial comparison ppt powerpoint presentation file graphic tips. This is a five stage process. The stages in this process are revenue, profits, cash balance.

Potential Price And Profit Margins Ppt PowerPoint Presentation Design Templates
This is a potential price and profit margins ppt powerpoint presentation design templates. This is a three stage process. The stages in this process are cost item, beginning, revenue, cost of production, gross profit, gross profit margin, other income, wages.

Competitor Analysis Template 1 Ppt PowerPoint Presentation Gallery Demonstration
This is a competitor analysis template 1 ppt powerpoint presentation gallery demonstration. This is a four stage process. The stages in this process are business, strategy, marketing, planning, your company, revenue.

Break Even Analysis Ppt PowerPoint Presentation Design Templates
This is a break even analysis ppt powerpoint presentation design templates. This is a two stage process. The stages in this process are sales, break even volume, total revenue, loss, profit.

Combo Chart Ppt PowerPoint Presentation Infographic Template Graphic Images
This is a combo chart ppt powerpoint presentation infographic template graphic images. This is a three stage process. The stages in this process are market size, growth rate, percentage, business, marketing.

Consulting Methodology Ppt Powerpoint Templates
This is a consulting methodology ppt powerpoint templates. This is a four stage process. The stages in this process are target markets, increase revenue, generate leads, drive sales, align people.

Competitor Analysis Ppt PowerPoint Presentation Professional Designs
This is a competitor analysis ppt powerpoint presentation professional designs. This is a four stage process. The stages in this process are sales development of industry, sales development, performance indicators, revenue.

P And L Kpis Template 2 Ppt PowerPoint Presentation Inspiration Grid
This is a p and l kpis template 2 ppt powerpoint presentation inspiration grid. This is a four stage process. The stages in this process are revenue, cogs, operating profit, net profit.

P And L Kpis Ppt PowerPoint Presentation Designs Download
This is a p and l kpis ppt powerpoint presentation designs download. This is a four stage process. The stages in this process are revenue, cogs, operating profit, net profit.

Gap Analysis Graph Ppt PowerPoint Presentation Slides Graphics Pictures
This is a gap analysis graph ppt powerpoint presentation slides graphics pictures. This is a five stage process. The stages in this process are revenue, time, high, low, risk.

Break Even Analysis Ppt PowerPoint Presentation Inspiration Layouts
This is a break even analysis ppt powerpoint presentation inspiration layouts. This is a three stage process. The stages in this process are total revenue, total costs, variable cost, fixed costs, units sold.
 Home
Home