Revenue Dashboard

Smart Manufacturing Dashboard To Track Production Quality Rules PDF
This slide represents smart manufacturing dashboard. It covers production volume, downtime causes, top product sold item, sales revenue, active machinery etc.Boost your pitch with our creative Smart Manufacturing Dashboard To Track Production Quality Rules PDF. Deliver an awe-inspiring pitch that will mesmerize everyone. Using these presentation templates you will surely catch everyones attention. You can browse the ppts collection on our website. We have researchers who are experts at creating the right content for the templates. So you do not have to invest time in any additional work. Just grab the template now and use them.
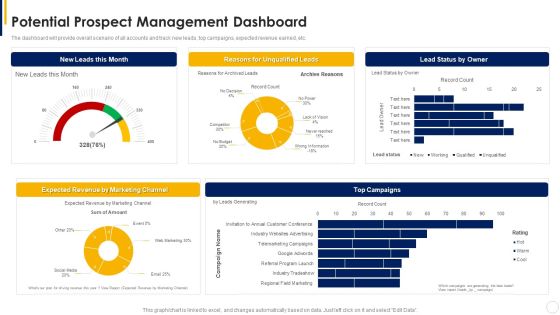
Manual To Develop Strawman Proposal Potential Prospect Management Dashboard Themes PDF
The dashboard will provide overall scenario of all accounts and track new leads, top campaigns, expected revenue earned, etc. Deliver an awe inspiring pitch with this creative Manual To Develop Strawman Proposal Potential Prospect Management Dashboard Themes PDF bundle. Topics like Expected Revenue, Marketing Channel, Management Dashboard can be discussed with this completely editable template. It is available for immediate download depending on the needs and requirements of the user.

Corporate Security And Risk Management Financial Performance Tracking Dashboard Introduction PDF
This slide presents the dashboard which will help firm in tracking the fiscal performance. This dashboard displays revenues and expenses trends and payment received analysis. Deliver an awe inspiring pitch with this creative corporate security and risk management financial performance tracking dashboard introduction pdf bundle. Topics like revenue and expense trends, receivables analysis can be discussed with this completely editable template. It is available for immediate download depending on the needs and requirements of the user.
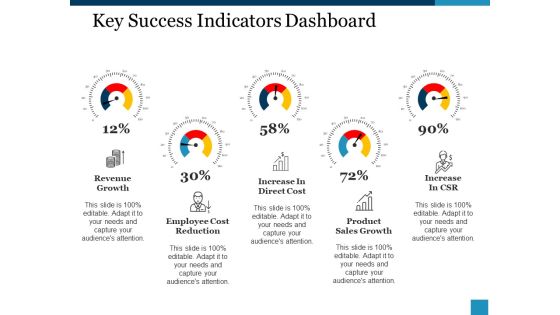
Key Success Indicators Dashboard Ppt PowerPoint Presentation Inspiration Guide
This is a key success indicators dashboard ppt powerpoint presentation inspiration guide. This is a five stage process. The stages in this process are revenue growth, increase in direct cost, increase in csr, employee cost reduction, product, sales growth.

PRM To Streamline Business Processes Customer Relationship Management Dashboard Goal Pictures PDF
This slide covers the customer relationship management dashboard which includes company goals, revenue by deal source, new deals, etc. Deliver an awe inspiring pitch with this creative prm to streamline business processes customer relationship management dashboard goal pictures pdf bundle. Topics like revenue goal attainment, revenue by deal source, revenue by deal source by owner, pipeline coverage can be discussed with this completely editable template. It is available for immediate download depending on the needs and requirements of the user.
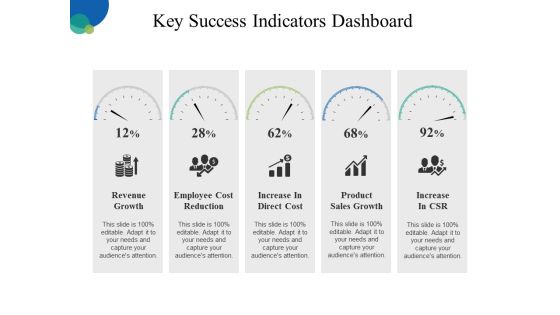
Key Success Indicators Dashboard Ppt PowerPoint Presentation Outline Slideshow
This is a key success indicators dashboard ppt powerpoint presentation outline slideshow. This is a five stage process. The stages in this process are revenue growth, employee cost reduction, increase in direct cost, product sales growth, increase in csr.

Dashboard To Measure Business Financial Performance Summary PDF
This slide shows the dashboard to measure business financial performance which focuses on revenues, debt to equity, net profit margin, gross profit margin and return on equity. Are you searching for a Dashboard To Measure Business Financial Performance Summary PDF that is uncluttered, straightforward, and original Its easy to edit, and you can change the colors to suit your personal or business branding. For a presentation that expresses how much effort youve put in, this template is ideal With all of its features, including tables, diagrams, statistics, and lists, its perfect for a business plan presentation. Make your ideas more appealing with these professional slides. Download Dashboard To Measure Business Financial Performance Summary PDF from Slidegeeks today.

Ecommerce Marketing Activities KPI Dashboard To Analyse Performance Guidelines PDF
This slide covers ecommerce marketing KPI dashboard to track performance. It involves details such as ecommerce revenue generated, number of new customers, repeat buying rate, attribute revenue and conversion rate and attributed revenue and conversion rate by marketing channel.Pitch your topic with ease and precision using this Ecommerce Marketing Activities KPI Dashboard To Analyse Performance Guidelines PDF. This layout presents information on Revenue Generated, Ecommerce Revenue, Generate Conversion. It is also available for immediate download and adjustment. So, changes can be made in the color, design, graphics or any other component to create a unique layout.
Risk Management For Organization Essential Assets Financial Performance Tracking Dashboard Designs PDF
This slide presents the dashboard which will help firm in tracking the fiscal performance. This dashboard displays revenues and expenses trends and payment received analysis. Deliver an awe inspiring pitch with this creative risk management for organization essential assets financial performance tracking dashboard designs pdf bundle. Topics like receivables analysis, revenue and expense trends can be discussed with this completely editable template. It is available for immediate download depending on the needs and requirements of the user.

Sales Dashboard Template 2 Ppt PowerPoint Presentation Introduction
This is a sales dashboard template 2 ppt powerpoint presentation introduction. This is a four stage process. The stages in this process are total sales by month, lead sources revenue share, win loss ratio, opportunities total sales by probability.

Business Performance Dashboard Brand Techniques Structure Introduction PDF
Following slide covers business performance dashboard of the firm. It include KPIs such as average weekly sales revenue, above sales target, sales revenue and profit generated. Deliver an awe inspiring pitch with this creative business performance dashboard brand techniques structure introduction pdf bundle. Topics like average, revenue, sales, profit, cost can be discussed with this completely editable template. It is available for immediate download depending on the needs and requirements of the user.

Opportunity Analysis Dashboard Indicating Business Performance Information Rules PDF
This slide shows opportunity analysis dashboard indicating market performance which contains opportunity count by size, sales stage, region, revenue and average revenue. Pitch your topic with ease and precision using this Opportunity Analysis Dashboard Indicating Business Performance Information Rules PDF. This layout presents information on Opportunity Count, Revenue, Sales. It is also available for immediate download and adjustment. So, changes can be made in the color, design, graphics or any other component to create a unique layout.

Customer Attrition And Retention Analysis Dashboard Background PDF
This slide illustrates facts and figures related to customer retention and churn prediction. It includes customer churn, revenue churn, net revenue, MRR growth etc. Showcasing this set of slides titled Customer Attrition And Retention Analysis Dashboard Background PDF. The topics addressed in these templates are Net Promoter Score, Loyal Customers, Premium Users, Customer Churn, Revenue Churn. All the content presented in this PPT design is completely editable. Download it and make adjustments in color, background, font etc. as per your unique business setting.

Restaurant Promotion Marketing Analysis Dashboard For Hospitality Company Microsoft PDF
This slide shows the dashboard to be used by the hospitality company for analyzing the restaurant marketing. It includes details related to revenue, cost of revenue, net income, food and beverage revenue by location and type etc.Showcasing this set of slides titled Restaurant Promotion Marketing Analysis Dashboard For Hospitality Company Microsoft PDF The topics addressed in these templates are Beverage Revenue, Food Beverage, Expenses Account All the content presented in this PPT design is completely editable. Download it and make adjustments in color, background, font etc. as per your unique business setting.

Dashboard For Tracking Sales Target Metrics Introduction PDF
This slide presents KPI dashboard for tracking Sales Target Metrics achievement monthly and region wise helpful in adjusting activities as per ongoing performance. It includes average weekly sales revenue, average sales target, annual sales growth, regional sales performance and average revenue per unit that should be regularly tracked. Showcasing this set of slides titled Dashboard For Tracking Sales Target Metrics Introduction PDF. The topics addressed in these templates are Average Revenue, Per Unit, Average Weekly, Sales Revenue. All the content presented in this PPT design is completely editable. Download it and make adjustments in color, background, font etc. as per your unique business setting.

Creating Successful Advertising Campaign Shopping Cart Conversion Rate Dashboard Ideas PDF
This slide shows shopping cart conversion rate dashboard. It includes details of online revenue share, shipping error rate, shopping cart conversion rate, coupon conversion, product views per session and revenue per visitors. Deliver an awe inspiring pitch with this creative Creating Successful Advertising Campaign Shopping Cart Conversion Rate Dashboard Ideas PDF bundle. Topics like target, revenue per visitors, conversion rate can be discussed with this completely editable template. It is available for immediate download depending on the needs and requirements of the user.

Deliver Efficiency Innovation Measuring Business Unit Performance Dashboard Background PDF
This slide covers dashboard that shows business unit performance such as new customers, average weekly sales revenue, sales revenues, profits, customer lifetime value, etc. Deliver an awe inspiring pitch with this creative Deliver Efficiency Innovation Measuring Business Unit Performance Dashboard Background PDF bundle. Topics like Customer Lifetime Value, Customer Acquisition Cost, Average Revenue Per Unit, Above Sales Target YTD can be discussed with this completely editable template. It is available for immediate download depending on the needs and requirements of the user.

Prospective Buyer Retention Dashboard With Key Performance Indicators Themes PDF
This slide shows the dashboard representing the key performance metrics for retention of potential customers of the organization. It shows no. of active users, churn rate, cost of customer acquisition, their life time value, monthly recurring revenue etc.Pitch your topic with ease and precision using this Prospective Buyer Retention Dashboard With Key Performance Indicators Themes PDF. This layout presents information on Recurring Revenue, Revenue Growth, Customer Acquisition. It is also available for immediate download and adjustment. So, changes can be made in the color, design, graphics or any other component to create a unique layout.

Corporate Sales Capability And Financial Forecast Dashboard Download PDF
This slide illustrates facts and figures related to expected revenue generation in upcoming months in a corporation. It includes expected sales revenue for FY23, yearly sales revenue etc. Showcasing this set of slides titled Corporate Sales Capability And Financial Forecast Dashboard Download PDF. The topics addressed in these templates are Corporate Sales, Capability And Financial, Forecast Dashboard. All the content presented in this PPT design is completely editable. Download it and make adjustments in color, background, font etc. as per your unique business setting

Dashboard Tracking Essential Kpis For Ecommerce Performance Slides PDF
This slide provides information regarding essential KPIs for ecommerce performance dashboard tracking average bounce rate, new vs. old customers, channel revenue vs. channel acquisitions costs, channel revenue vs. sales, average conversion rate, etc. Deliver an awe inspiring pitch with this creative Dashboard Tracking Essential Kpis For Ecommerce Performance Slides PDF bundle. Topics like Average Bounce Rate, Channel Acquisition Costs, Channel Revenue can be discussed with this completely editable template. It is available for immediate download depending on the needs and requirements of the user.
Monthly Sales Performance Tracking And Monitoring Dashboard Diagrams PDF
This slide showcases a dashboard presenting various metrics to measure and analyze sales performance for revenue growth. It includes key components such as number of sales, revenue, profit, cost, sales revenue, sales increment, cost analysis and cross sell. Make sure to capture your audiences attention in your business displays with our gratis customizable Monthly Sales Performance Tracking And Monitoring Dashboard Diagrams PDF. These are great for business strategies, office conferences, capital raising or task suggestions. If you desire to acquire more customers for your tech business and ensure they stay satisfied, create your own sales presentation with these plain slides.
Monthly Sales Performance Tracking And Monitoring Dashboard Designs PDF
This slide showcases a dashboard presenting various metrics to measure and analyze sales performance for revenue growth. It includes key components such as number of sales, revenue, profit, cost, sales revenue, sales increment, cost analysis and cross sell. Make sure to capture your audiences attention in your business displays with our gratis customizable Monthly Sales Performance Tracking And Monitoring Dashboard Designs PDF. These are great for business strategies, office conferences, capital raising or task suggestions. If you desire to acquire more customers for your tech business and ensure they stay satisfied, create your own sales presentation with these plain slides.
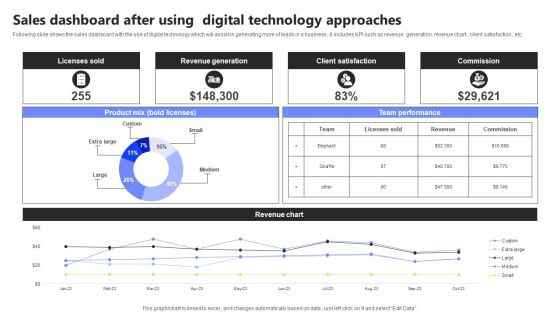
Sales Dashboard After Using Digital Technology Approaches Infographics PDF
Following slide shows the sales dashboard with the use of digital technology which will assist in generating more of leads in a business . It includes KPI such as revenue generation, revenue chart , client satisfaction , etc. Showcasing this set of slides titled Sales Dashboard After Using Digital Technology Approaches Infographics PDF. The topics addressed in these templates are Licenses Sold, Revenue Generation, Client Satisfaction. All the content presented in this PPT design is completely editable. Download it and make adjustments in color, background, font etc. as per your unique business setting.

Dashboard To Track Referral Marketing Recommendation Program Results Structure PDF
The following slide showcases KPI dashboard which can be used by marketers to track and analyze referral program results. The template provides information about revenue generated, paying customers, promotors, clicks, cancelled customers etc. Showcasing this set of slides titled Dashboard To Track Referral Marketing Recommendation Program Results Structure PDF. The topics addressed in these templates are Revenue Generated, Recurring Revenue, Paying Customers. All the content presented in this PPT design is completely editable. Download it and make adjustments in color, background, font etc. as per your unique business setting.
Marketing And Operations Dashboard For Performance Management Icons PDF
This slide covers sales and operation dashboard for performance management. It involves details such as number of new buyers, sales revenue, average revenue per unit etc. Pitch your topic with ease and precision using this Marketing And Operations Dashboard For Performance Management Icons PDF. This layout presents information on Average Revenue Per Unit, Customer Acquisition Cost, Customer Lifetime Value. It is also available for immediate download and adjustment. So, changes can be made in the color, design, graphics or any other component to create a unique layout.

Business Performance Review Dashboard With Customer Acquisition Cost Diagrams PDF
The following slide highlights KPI dashboard which can be used for quarterly business review QBR. It provides detailed information about actual revenue vs target, number of new customers, average revenue per customer, customer acquisition cost CAC etc. Pitch your topic with ease and precision using this Business Performance Review Dashboard With Customer Acquisition Cost Diagrams PDF. This layout presents information on Revenue, Customer Acquisition Cost, Current Quarter. It is also available for immediate download and adjustment. So, changes can be made in the color, design, graphics or any other component to create a unique layout.
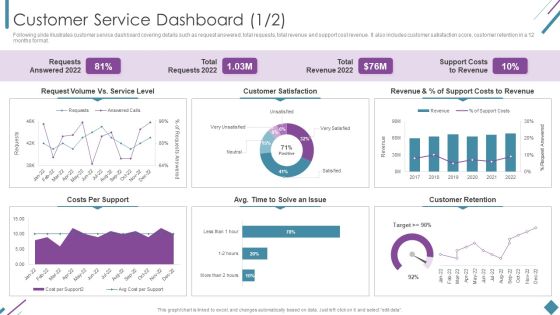
Metrics To Measure Business Performance Customer Service Dashboard Sample PDF
Following slide illustrates customer service dashboard covering details such as request answered, total requests, total revenue and support cost revenue. It also includes customer satisfaction score, customer retention in a 12 months format. Deliver and pitch your topic in the best possible manner with this Metrics To Measure Business Performance Customer Service Dashboard Sample PDF. Use them to share invaluable insights on Requests Answered 2022, Total Requests 2022, Total Revenue 2022 and impress your audience. This template can be altered and modified as per your expectations. So, grab it now.
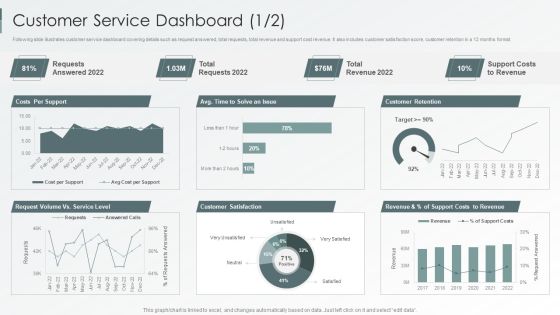
Enterprise Sustainability Performance Metrics Customer Service Dashboard Professional PDF
Following slide illustrates customer service dashboard covering details such as request answered, total requests, total revenue and support cost revenue. It also includes customer satisfaction score, customer retention in a 12 months format.Deliver and pitch your topic in the best possible manner with this Enterprise Sustainability Performance Metrics Customer Service Dashboard Professional PDF. Use them to share invaluable insights on Customer Satisfaction, Customer Retention, Support Revenue and impress your audience. This template can be altered and modified as per your expectations. So, grab it now.

Customer Service Dashboard Company Performance Evaluation Using KPI Themes PDF
Following slide illustrates customer service dashboard covering details such as request answered, total requests, total revenue and support cost revenue. It also includes customer satisfaction score, customer retention in a 12 months format. Deliver and pitch your topic in the best possible manner with this Customer Service Dashboard Company Performance Evaluation Using KPI Themes PDF. Use them to share invaluable insights on Requests Answered, Total Revenue, Customer Retention and impress your audience. This template can be altered and modified as per your expectations. So, grab it now.
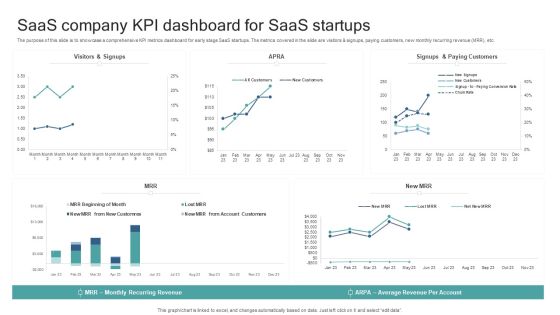
Saas Company KPI Dashboard For Saas Startups Background PDF
The purpose of this slide is to showcase a comprehensive KPI metrics dashboard for early stage SaaS startups. The metrics covered in the slide are visitors and signups, paying customers, new monthly recurring revenue MRR, etc. Showcasing this set of slides titled Saas Company KPI Dashboard For Saas Startups Background PDF. The topics addressed in these templates are Average Revenue Per Account, Monthly Recurring Revenue. All the content presented in this PPT design is completely editable. Download it and make adjustments in color, background, font etc. as per your unique business setting.

Sales Highlights Ideas Analysis Dashboard Powerpoint Slide Ideas
This is a sales highlights ideas analysis dashboard powerpoint slide ideas. This is a four stage process. The stages in this process are lead sources revenue share, opportunities total sales by probability, total sale amount, total sales by month, opportunity name, total sale amount.

Business Executive Summary KPI Dashboard For Year 2023 Graphics PDF
The following slide highlights the overall business performance for the financial year 2021 to assess variations and trace accuracy. It includes KPIs such as total income, expenditures, revenue and expense breakdown, fund structure etc. Pitch your topic with ease and precision using this Business Executive Summary KPI Dashboard For Year 2023 Graphics PDF. This layout presents information on Revenue Breakdown, Revenue Category, Expense Breakdown. It is also available for immediate download and adjustment. So, changes can be made in the color, design, graphics or any other component to create a unique layout.

Brand Development Manual Business Performance KPI Dashboard Background PDF
Following slide covers business performance dashboard of the firm. It include KPIs such as average weekly sales revenue, above sales target, sales revenue and profit generated.Deliver an awe inspiring pitch with this creative Brand Development Manual Business Performance KPI Dashboard Background PDF bundle. Topics like Business Performance KPI Dashboard can be discussed with this completely editable template. It is available for immediate download depending on the needs and requirements of the user.
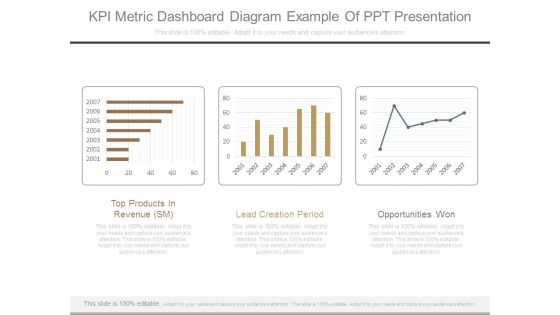
Kpi Metric Dashboard Diagram Example Of Ppt Presentation
This is a kpi metric dashboard diagram example of ppt presentation. This is a three stage process. The stages in this process are top products in revenue sm, lead creation period, opportunities won.
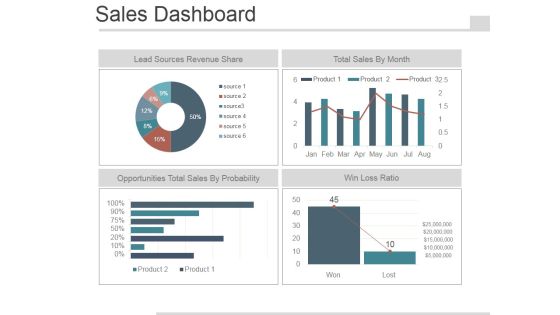
Sales Dashboard Slide Template 2 Ppt PowerPoint Presentation Images
This is a sales dashboard slide template 2 ppt powerpoint presentation images. This is a four stage process. The stages in this process are lead sources revenue share, total sales by month, opportunities total sales by probability, win loss ratio.

Sales Dashboard Template 2 Ppt PowerPoint Presentation Examples
This is a sales dashboard template 2 ppt powerpoint presentation examples. This is a four stage process. The stages in this process are sales distribution, win loss ratio, lead sources revenue share, total sales by month.
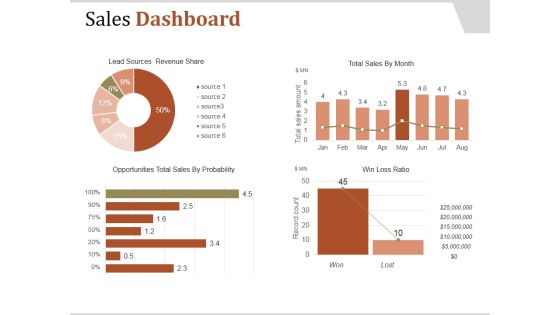
Sales Dashboard Template 2 Ppt PowerPoint Presentation Clipart
This is a sales dashboard template 2 ppt powerpoint presentation clipart. This is a four stage process. The stages in this process are lead sources revenue share, total sales by month, win loss ratio, opportunities total sales by probability.

Key Account Marketing Approach Managing Account Dashboard Channel Themes PDF
The dashboard will provide overall scenario of all accounts and track new leads, top campaigns, expected revenue earned, etc. Deliver and pitch your topic in the best possible manner with this key account marketing approach managing account dashboard channel themes pdf. Use them to share invaluable insights on campaigns, revenue, marketing and impress your audience. This template can be altered and modified as per your expectations. So, grab it now.
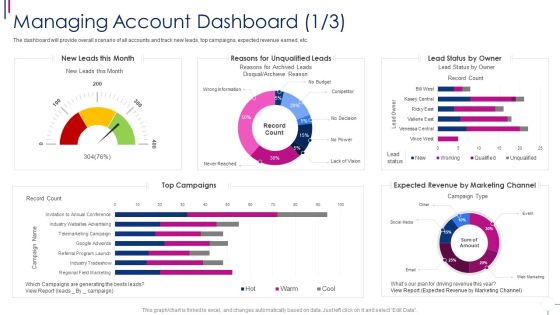
Managing Account Dashboard Successful Account Oriented Marketing Techniques Graphics PDF
The dashboard will provide overall scenario of all accounts and track new leads, top campaigns, expected revenue earned, etc. Deliver an awe inspiring pitch with this creative managing account dashboard successful account oriented marketing techniques graphics pdf bundle. Topics like revenue, marketing can be discussed with this completely editable template. It is available for immediate download depending on the needs and requirements of the user.

Optimize Enterprise Core Potential Prospect Management Dashboard Information PDF
The dashboard will provide overall scenario of all accounts and track new leads, top campaigns, expected revenue earned, etc. Deliver an awe inspiring pitch with this creative Optimize Enterprise Core Potential Prospect Management Dashboard Information PDF bundle. Topics like New Leads, Top Campaigns, Lead Status, Expected Revenue can be discussed with this completely editable template. It is available for immediate download depending on the needs and requirements of the user.
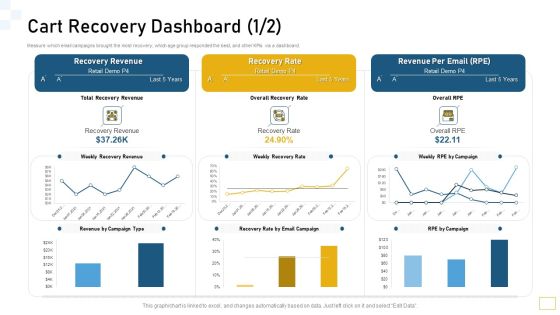
Guidelines Customer Conduct Assessment Cart Recovery Dashboard Demo Microsoft PDF
Measure which email campaigns brought the most recovery, which age group responded the best, and other KPIs via a dashboard. Deliver and pitch your topic in the best possible manner with this guidelines customer conduct assessment cart recovery dashboard demo microsoft pdf. Use them to share invaluable insights on recovery revenue, recovery rate, revenue per email and impress your audience. This template can be altered and modified as per your expectations. So, grab it now.
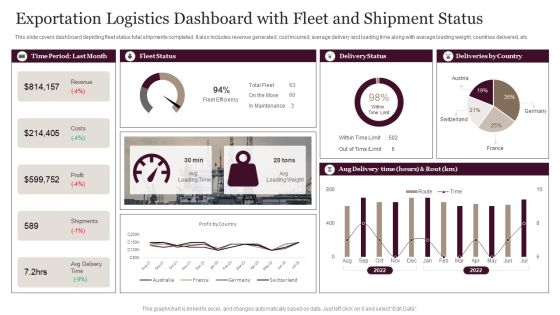
Exportation Logistics Dashboard With Fleet And Shipment Status Demonstration PDF
This slide covers dashboard depicting fleet status total shipments completed. It also includes revenue generated, cost incurred, average delivery and loading time along with average loading weight, countries delivered, etc. Showcasing this set of slides titled Exportation Logistics Dashboard With Fleet And Shipment Status Demonstration PDF. The topics addressed in these templates are Revenue, Costs, Profit. All the content presented in this PPT design is completely editable. Download it and make adjustments in color, background, font etc. as per your unique business setting.

Annual Business Performance Assessment And Evaluation Dashboard Brochure PDF
This slide represents a dashboard highlighting performance of a business concern in various segments. It includes average revenue per unit, customer lifetime value, customer acquisition cost, etc. Showcasing this set of slides titled Annual Business Performance Assessment And Evaluation Dashboard Brochure PDF. The topics addressed in these templates are Profit, Sales Revenue, New Customer. All the content presented in this PPT design is completely editable. Download it and make adjustments in color, background, font etc. as per your unique business setting.

Dashboard For Monitoring Roi Of Customer Value Communication Portrait PDF
This slide exhibits dashboard for assessing return on investment ROI of value communication. It provides information such as revenue by campaign, customer segment and campaign channel. Pitch your topic with ease and precision using this dashboard for monitoring roi of customer value communication portrait pdf. This layout presents information on customer, revenue, marketing expense. It is also available for immediate download and adjustment. So, changes can be made in the color, design, graphics or any other component to create a unique layout.

Executive Marketing And Operations Dashboard For Inventory Management Template PDF
This slide covers executive sales and operations dashboard for inventory management. It involves total number of accounts, monthly recuring revenue, conversion rate and monthly recurring revenue retention rate. Showcasing this set of slides titled Executive Marketing And Operations Dashboard For Inventory Management Template PDF. The topics addressed in these templates are Product, Marketing, Sales. All the content presented in this PPT design is completely editable. Download it and make adjustments in color, background, font etc. as per your unique business setting.
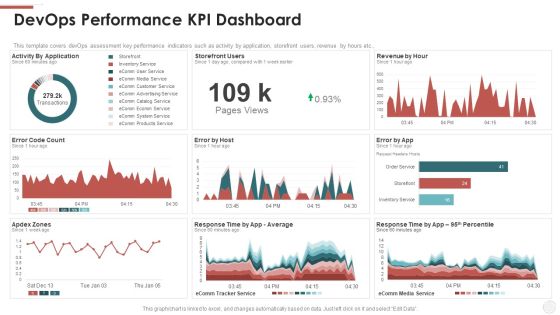
Devops Performance KPI Dashboard Ppt File Example Topics PDF
This template covers devOps assessment key performance indicators such as activity by application, storefront users, revenue by hours etc. Deliver and pitch your topic in the best possible manner with this devops performance kpi dashboard ppt file example topics pdf. Use them to share invaluable insights on revenue, application and impress your audience. This template can be altered and modified as per your expectations. So, grab it now.

Yearly Business Performance Assessment And Evaluation Dashboard Structure PDF
This slide contains annual business review of a company. It includes revenue comparison, sales assessment and profitability representation. Showcasing this set of slides titled Yearly Business Performance Assessment And Evaluation Dashboard Structure PDF. The topics addressed in these templates are Revenue Comparison, Sales, Profitability. All the content presented in this PPT design is completely editable. Download it and make adjustments in color, background, font etc. as per your unique business setting.

Price Optimization Dashboard Product Pricing Strategies Analysis Mockup PDF
This slide covers the details of price optimization which focuses on price changes, leader, distribution, and benchmark. Deliver an awe inspiring pitch with this creative Price Optimization Dashboard Product Pricing Strategies Analysis Mockup PDF bundle. Topics like Quaterly Revenue Goal, Basic Metric Revenue, Portfolio Under Management can be discussed with this completely editable template. It is available for immediate download depending on the needs and requirements of the user.
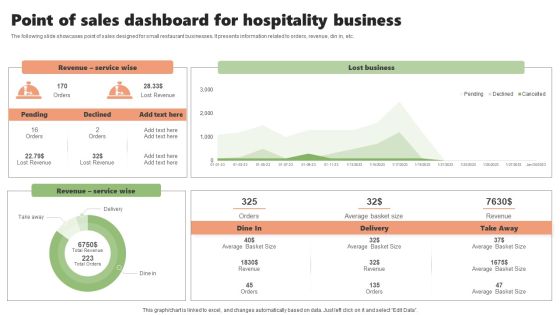
Point Of Sales Dashboard For Hospitality Business Slides PDF
The following slide showcases point of sales designed for small restaurant businesses. It presents information related to orders, revenue, din in, etc. Showcasing this set of slides titled Point Of Sales Dashboard For Hospitality Business Slides PDF. The topics addressed in these templates are Revenue Service Wise, Lost Business, Hospitality Business. All the content presented in this PPT design is completely editable. Download it and make adjustments in color, background, font etc. as per your unique business setting.
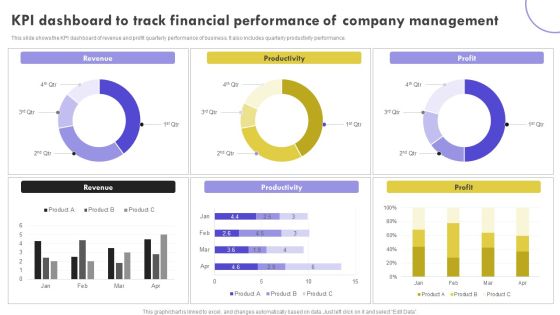
KPI Dashboard To Track Financial Performance Of Company Management Clipart PDF
This slide shows the KPI dashboard of revenue and profit quarterly performance of business. It also includes quarterly productivity performance. Pitch your topic with ease and precision using this KPI Dashboard To Track Financial Performance Of Company Management Clipart PDF. This layout presents information on Revenue, Productivity, Profit. It is also available for immediate download and adjustment. So, changes can be made in the color, design, graphics or any other component to create a unique layout.
Monthly Sales Performance Tracking And Monitoring Dashboard Sample PDF
This slide showcases a dashboard presenting various metrics to measure and analyze sales performance for revenue growth. It includes key components such as number of sales, revenue, profit, cost, sales revenue, sales increment, cost analysis and cross sell. Do you have to make sure that everyone on your team knows about any specific topic I yes, then you should give Monthly Sales Performance Tracking And Monitoring Dashboard Sample PDF a try. Our experts have put a lot of knowledge and effort into creating this impeccable Monthly Sales Performance Tracking And Monitoring Dashboard Sample PDF. You can use this template for your upcoming presentations, as the slides are perfect to represent even the tiniest detail. You can download these templates from the Slidegeeks website and these are easy to edit. So grab these today.

Effective Sales Technique For New Product Launch KPI Dashboard To Monitor Sales Performance Graphics PDF
This slide shows sales performance monitoring dashboard. Metrics included in the dashboard are sales revenue, sales growth, average revenue per unit, customer lifetime value and customer acquisition cost.Deliver an awe inspiring pitch with this creative Effective Sales Technique For New Product Launch KPI Dashboard To Monitor Sales Performance Graphics PDF bundle. Topics like Country Performance, Average Revenue, Customer Acquisition can be discussed with this completely editable template. It is available for immediate download depending on the needs and requirements of the user.

B2B Sales Techniques Playbook B2B Prospects Performance Measurement Dashboard Guidelines PDF
This slide provides information regarding B2B performance tracking dashboard to measure leads, MQL, SQL, customers, revenue goals, total media spend.Deliver an awe inspiring pitch with this creative B2B Sales Techniques Playbook B2B Prospects Performance Measurement Dashboard Guidelines PDF bundle. Topics like Revenue Goal, Total Media, Spend Customers can be discussed with this completely editable template. It is available for immediate download depending on the needs and requirements of the user.
Monthly Sales Performance Tracking And Monitoring Dashboard Inspiration PDF
This slide showcases a dashboard presenting various metrics to measure and analyze sales performance for revenue growth. It includes key components such as number of sales, revenue, profit, cost, sales revenue, sales increment, cost analysis and cross sell. Coming up with a presentation necessitates that the majority of the effort goes into the content and the message you intend to convey. The visuals of a PowerPoint presentation can only be effective if it supplements and supports the story that is being told. Keeping this in mind our experts created Monthly Sales Performance Tracking And Monitoring Dashboard Inspiration PDF to reduce the time that goes into designing the presentation. This way, you can concentrate on the message while our designers take care of providing you with the right template for the situation.

Business Key Performance Metrics Review Dashboard Portrait PDF
The following slide shows a dashboard of sales strategy review of firm that can be used by marketing, product, finance managers for reviewing the business. It further includes KPI that are revenue, new customer, gross profit purchaser satisfaction, income comparison, sales categories and profitability. Showcasing this set of slides titled Business Key Performance Metrics Review Dashboard Portrait PDF. The topics addressed in these templates are Sales, Revenue Comparison, Profitability. All the content presented in this PPT design is completely editable. Download it and make adjustments in color, background, font etc. as per your unique business setting.

Business Referral Marketing Program Performance Metrics Dashboard Introduction PDF
This slide shows KPI dashboard to effectively track performance of business referral program in order to attract more leads and potential customers to the busines. It includes details related to key metrics such as referral participation rate, referred customers, referral conversion rate and total revenue generated. Showcasing this set of slides titled Business Referral Marketing Program Performance Metrics Dashboard Introduction PDF. The topics addressed in these templates are Referral Participation Rate, Referred Customers, Referral Conversion Rate, Total Revenue Generated. All the content presented in this PPT design is completely editable. Download it and make adjustments in color, background, font etc. as per your unique business setting.
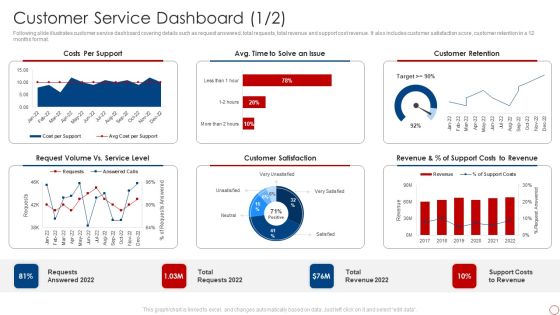
Kpis For Evaluating Business Sustainability Customer Service Dashboard Designs PDF
Following slide illustrates customer service dashboard covering details such as request answered, total requests, total revenue and support cost revenue. It also includes customer satisfaction score, customer retention in a 12 months format. Deliver and pitch your topic in the best possible manner with this Kpis For Evaluating Business Sustainability Customer Service Dashboard Designs PDF. Use them to share invaluable insights on Costs Per Support, Customer Retention, Customer Satisfaction and impress your audience. This template can be altered and modified as per your expectations. So, grab it now.

Digital Marketing KPI Dashboard With Engagement Rate Background PDF
The following slide showcases a comprehensive KPI dashboard which allows the company to track the digital marketing performance. Total visits, cost per click, engagement rate, total impressions, product sales trend, revenue by various channels are some of the key metrics mentioned in the slide. Showcasing this set of slides titled Digital Marketing KPI Dashboard With Engagement Rate Background PDF. The topics addressed in these templates are Demographics, Revenue, Sales. All the content presented in this PPT design is completely editable. Download it and make adjustments in color, background, font etc. as per your unique business setting.

ADC Cosmetics Company Dashboard With Variables Formats PDF
This slide shows a cosmetics and skin care sales dashboard with KPIs such as Profit Margin in 2021, Cross Selling Rate , Market Size, Stock Turnover Rate , Social Media Usage, Revenue etc. Deliver an awe-inspiring pitch with this creative adc cosmetics company dashboard with variables formats pdf bundle. Topics like profit margin, cross selling rate, market size, revenue, social media can be discussed with this completely editable template. It is available for immediate download depending on the needs and requirements of the user.
KPI Dashboard To Monitor Land Asset Management Practices Clipart PDF
Following slide demonstrate KPI dashboard for tracking expenses incurred on real estate asset maintenance and to reduce operational cost. It includes elements such as net income, monthly income and expenses, last quarter rent collection status, rental revenue , budget, etc. Pitch your topic with ease and precision using this KPI Dashboard To Monitor Land Asset Management Practices Clipart PDF. This layout presents information on Revenue, Budget, Income. It is also available for immediate download and adjustment. So, changes can be made in the color, design, graphics or any other component to create a unique layout.

 Home
Home