Revenue Dashboard
Sales Management Playbook Sales Management Activities Tracking Dashboard Themes PDF
This slide provides information regarding various metrics catered to track sales team performance in terms of average revenue per account, win rate, NPS, along with sales representative performance tracking through number of opportunities created, lead response time, etc. Deliver an awe inspiring pitch with this creative Sales Management Playbook Sales Management Activities Tracking Dashboard Themes PDF bundle. Topics like Sales Management Activities Tracking Dashboard can be discussed with this completely editable template. It is available for immediate download depending on the needs and requirements of the user.

Dashboard For Business To Business Market Division Inspiration PDF
This slide illustrates the market segmentation dashboard for B2B which can benefit them to improve the focus and boost the revenue of the organization. It includes the Division according to industries and company size. Showcasing this set of slides titled Dashboard For Business To Business Market Division Inspiration PDF. The topics addressed in these templates are Industries, Service, Automobiles. All the content presented in this PPT design is completely editable. Download it and make adjustments in color, background, font etc. as per your unique business setting.

Online Marketing Activities KPI Dashboard To Improve Sales Ideas PDF
This slide covers online marketing dashboard to improve sales. It involves details such as web performance, conversion funnel, revenue this month, traffic sources and number of followers on social media.Pitch your topic with ease and precision using this Online Marketing Activities KPI Dashboard To Improve Sales Ideas PDF. This layout presents information on Email Performance, Web Performance, Cost Conversion. It is also available for immediate download and adjustment. So, changes can be made in the color, design, graphics or any other component to create a unique layout.
Increasing Customer Kpi Dashboard For Tracking Customer Retention Download PDF
This slide covers the dashboard for analyzing customer loyalty with metrics such as NPS, loyal customer rate, premium users, CLV, customer churn, revenue churn, net retention, MRR growth, etc. From laying roadmaps to briefing everything in detail, our templates are perfect for you. You can set the stage with your presentation slides. All you have to do is download these easy-to-edit and customizable templates. Increasing Customer Kpi Dashboard For Tracking Customer Retention Download PDF will help you deliver an outstanding performance that everyone would remember and praise you for. Do download this presentation today.
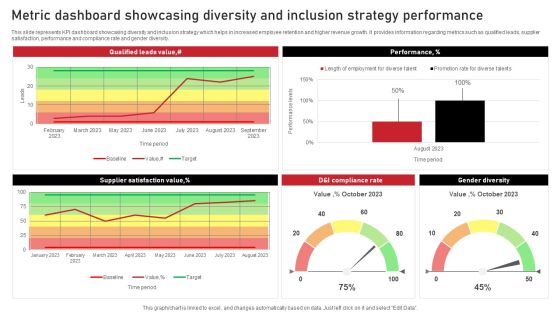
Metric Dashboard Showcasing Diversity And Inclusion Strategy Performance Background PDF
This slide represents KPI dashboard showcasing diversity and inclusion strategy which helps in increased employee retention and higher revenue growth. It provides information regarding metrics such as qualified leads, supplier satisfaction, performance and compliance rate and gender diversity. Showcasing this set of slides titled Metric Dashboard Showcasing Diversity And Inclusion Strategy Performance Background PDF. The topics addressed in these templates are Performance, Gender Diversity, Performance. All the content presented in this PPT design is completely editable. Download it and make adjustments in color, background, font etc. as per your unique business setting.

International Sales Performance Dashboard With Regional Market Report Inspiration PDF
This slide showcases global report that can help organization to estimate forecast of the sales and identify yearly revenue generated. Its key elements are yearly sales, market share, regional outlook, competitor analysis and geographical sales. Pitch your topic with ease and precision using this International Sales Performance Dashboard With Regional Market Report Inspiration PDF. This layout presents information on Regional Outlook, Sales And Forecast, Market Share Overview. It is also available for immediate download and adjustment. So, changes can be made in the color, design, graphics or any other component to create a unique layout.

Managing Customer Experience CRM Application Dashboard Month Mockup PDF
This graph or chart is linked to excel, and changes automatically based on data. Just left click on it and select Edit Data.Deliver an awe-inspiring pitch with this creative managing customer experience crm application dashboard month mockup pdf bundle. Topics like show me the deals by each stage, what is the revenue this month, get me the number of leads created this month by source can be discussed with this completely editable template. It is available for immediate download depending on the needs and requirements of the user.

Client Helpline Dashboard With Retention Rate Ppt Gallery Ideas PDF
This graph or chart is linked to excel, and changes automatically based on data. Just left click on it and select Edit Data. Pitch your topic with ease and precision using this Client Helpline Dashboard With Retention Rate Ppt Gallery Ideas PDF. This layout presents information on Cost per Support 2022, Total Requests, Total Revenue 2022, Avg Requests Answered. It is also available for immediate download and adjustment. So, changes can be made in the color, design, graphics or any other component to create a unique layout.
Sales Techniques Playbook Sales Management Activities Tracking Dashboard Introduction PDF
This slide provides information regarding various metrics catered to track sales team performance in terms of average revenue per account, win rate, NPS, along with sales representative performance tracking through number of opportunities created, lead response time, etc. Deliver an awe inspiring pitch with this creative sales techniques playbook sales management activities tracking dashboard introduction pdf bundle. Topics like growth, sales can be discussed with this completely editable template. It is available for immediate download depending on the needs and requirements of the user.
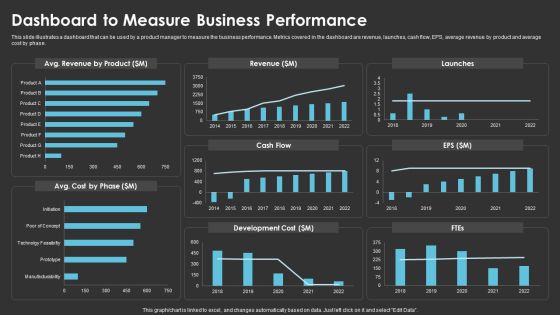
Method To Introduce New Product Offerings In The Industry Dashboard To Measure Business Performance Pictures PDF
This slide illustrates a dashboard that can be used by a product manager to measure the business performance. Metrics covered in the dashboard are revenue, launches, cash flow, EPS, average revenue by product and average cost by phase. Deliver and pitch your topic in the best possible manner with this Method To Introduce New Product Offerings In The Industry Dashboard To Measure Business Performance Pictures PDF. Use them to share invaluable insights on Revenue, Cash Flow, Development Cost and impress your audience. This template can be altered and modified as per your expectations. So, grab it now.

Strategic Marketing For Hair And Beauty Salon To Increase Dashboard Monitoring Sales Slides PDF
This slide presents a dashboard tracking revenue and sales by products and services. It includes KPIs such as revenue by service and products, units sold, monthly revenue. Make sure to capture your audiences attention in your business displays with our gratis customizable Strategic Marketing For Hair And Beauty Salon To Increase Dashboard Monitoring Sales Slides PDF. These are great for business strategies, office conferences, capital raising or task suggestions. If you desire to acquire more customers for your tech business and ensure they stay satisfied, create your own sales presentation with these plain slides.
KPI Dashboard For Tracking Customer Retention Elements PDF
This slide covers the dashboard for analyzing customer loyalty with metrics such as NPS, loyal customer rate, premium users, CLV, customer churn, revenue churn, net retention, MRR growth, etc. Presenting this PowerPoint presentation, titled KPI Dashboard For Tracking Customer Retention Elements PDF, with topics curated by our researchers after extensive research. This editable presentation is available for immediate download and provides attractive features when used. Download now and captivate your audience. Presenting this KPI Dashboard For Tracking Customer Retention Elements PDF. Our researchers have carefully researched and created these slides with all aspects taken into consideration. This is a completely customizable KPI Dashboard For Tracking Customer Retention Elements PDF that is available for immediate downloading. Download now and make an impact on your audience. Highlight the attractive features available with our PPTs.

Dashboard For Tracking Brand Awareness Advertisement Campaign Results Download PDF
This slide showcases dashboard that can help organization to track results of online advertisement campaigns. Its key components ad impressions, click through rate, cost per conversion, revenue per click, impressions, new users and sessions. Here you can discover an assortment of the finest PowerPoint and Google Slides templates. With these templates, you can create presentations for a variety of purposes while simultaneously providing your audience with an eye catching visual experience. Download Dashboard For Tracking Brand Awareness Advertisement Campaign Results Download PDF to deliver an impeccable presentation. These templates will make your job of preparing presentations much quicker, yet still, maintain a high level of quality. Slidegeeks has experienced researchers who prepare these templates and write high quality content for you. Later on, you can personalize the content by editing the Dashboard For Tracking Brand Awareness Advertisement Campaign Results Download PDF.

Dashboard To Measure Display Advertising Campaigns Performance Graphics PDF
This slide provides a dashboard to monitor the display advertising campaign performance in order to reduce overall marketing cost. It incorporates advertising cost, average number of clicks and impressions, clicks per day, revenue by campaign, etc. Formulating a presentation can take up a lot of effort and time, so the content and message should always be the primary focus. The visuals of the PowerPoint can enhance the presenters message, so our Dashboard To Measure Display Advertising Campaigns Performance Graphics PDF was created to help save time. Instead of worrying about the design, the presenter can concentrate on the message while our designers work on creating the ideal templates for whatever situation is needed. Slidegeeks has experts for everything from amazing designs to valuable content, we have put everything into Dashboard To Measure Display Advertising Campaigns Performance Graphics PDF

KPI Dashboard To Evaluate Sales Performance Template PDF
The following slide outlines key performance indicator KPI dashboard to monitor sales performance of company. The key metrics covered in slide are total sales by location, monthly sales trend, average revenue AR by clients, etc. Welcome to our selection of the KPI Dashboard To Evaluate Sales Performance Template PDF. These are designed to help you showcase your creativity and bring your sphere to life. Planning and Innovation are essential for any business that is just starting out. This collection contains the designs that you need for your everyday presentations. All of our PowerPoints are 100 percent editable, so you can customize them to suit your needs. This multi-purpose template can be used in various situations. Grab these presentation templates today

Dashboard For Tracking Brand Awareness Advertisement Campaign Results Designs PDF
This slide showcases dashboard that can help organization to track results of online advertisement campaigns. Its key components ad impressions, click through rate, cost per conversion, revenue per click, impressions, new users and sessions.Are you in need of a template that can accommodate all of your creative concepts This one is crafted professionally and can be altered to fit any style. Use it with Google Slides or PowerPoint. Include striking photographs, symbols, depictions, and other visuals. Fill, move around, or remove text boxes as desired. Test out color palettes and font mixtures. Edit and save your work, or work with colleagues. Download Dashboard For Tracking Brand Awareness Advertisement Campaign Results Designs PDF and observe how to make your presentation outstanding. Give an impeccable presentation to your group and make your presentation unforgettable.

Three Dashboard With Percentage Value Growth Powerpoint Slides
This PowerPoint template has been designed with three dashboards. Use this PPT slide to depict rise in business profit. This professional diagram slide will help you express your views to target audience.

Sales Dashboard Template 1 Ppt PowerPoint Presentation Samples
This is a sales dashboard template 1 ppt powerpoint presentation samples. This is a one stage process. The stages in this process are sales and percent growth of product, revenue, product, percent growth.
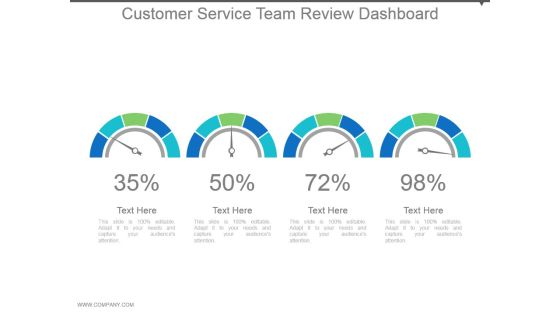
Customer Service Team Review Dashboard Powerpoint Slide Rules
This is a customer service team review dashboard powerpoint slide rules. This is a four stage process. The stages in this process are dashboard, meter, financials, speed, measure.
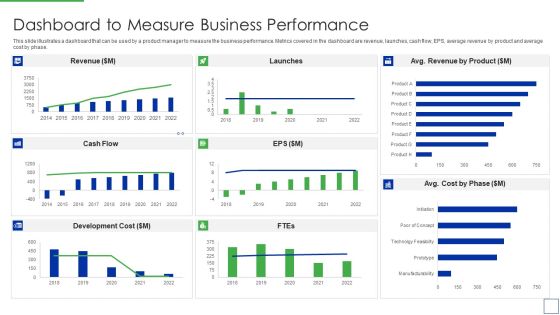
Product Portfolio Management For New Target Region Dashboard To Measure Business Rules PDF
This slide illustrates a dashboard that can be used by a product manager to measure the business performance. Metrics covered in the dashboard are revenue, launches, cash flow, EPS, average revenue by product and average cost by phase.Deliver and pitch your topic in the best possible manner with this Product Portfolio Management For New Target Region Dashboard To Measure Business Rules PDF Use them to share invaluable insights on Dashboard to Measure Business Performance and impress your audience. This template can be altered and modified as per your expectations. So, grab it now.

Bi Dashboard Design For Solutions Ppt Powerpoint Slides
This is a bi dashboard design for solutions ppt powerpoint slides. This is a four stage process. The stages in this process are total understand, total brands, total revenue, total sales.

Dashboard To Measure Business Performance Creating And Offering Multiple Product Ranges In New Business Introduction PDF
This slide illustrates a dashboard that can be used by a product manager to measure the business performance. Metrics covered in the dashboard are revenue, launches, cash flow, EPS, average revenue by product and average cost by phase.There are so many reasons you need a Dashboard To Measure Business Performance Creating And Offering Multiple Product Ranges In New Business Introduction PDF. The first reason is you can notspend time making everything from scratch, Thus, Slidegeeks has made presentation templates for you too. You can easily download these templates from our website easily.

Dashboard Ppt PowerPoint Presentation Infographic Template Graphic Tips
This is a dashboard ppt powerpoint presentation infographic template graphic tips. This is a three stage process. The stages in this process are low, medium, high, finance.

Finance Dashboard Ppt PowerPoint Presentation Model Graphics Example
This is a finance dashboard ppt powerpoint presentation model graphics example. This is a two stage process. The stages in this process are sales, operating expenses, operating income, net income.

Crm Marketing Dashboard Ppt PowerPoint Presentation Gallery Tips
This is a crm marketing dashboard ppt powerpoint presentation gallery tips. This is a two stage process. The stages in this process are leads per week, leads this week.

Change Management Performance Dashboard Ppt PowerPoint Presentation Professional Portrait
This is a change management performance dashboard ppt powerpoint presentation professional portrait. This is a three stage process. The stages in this process are finance, marketing, analysis, business, investment.

Dashboard Ppt PowerPoint Presentation Introduction Ppt PowerPoint Presentation Pictures
This is a dashboard ppt powerpoint presentation introduction ppt powerpoint presentation pictures. This is a three stage process. The stages in this process are business, strategy, marketing, success, dashboard.

Performance Dashboard Template 2 Ppt PowerPoint Presentation Show Backgrounds
This is a performance dashboard template 2 ppt powerpoint presentation show backgrounds. This is a four stage process. The stages in this process are performance dashboard, business, marketing, management, finance.
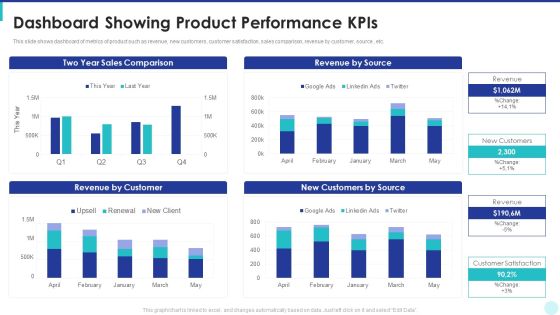
Optimization Of Product Development Life Cycle Dashboard Showing Product Performance Kpis Topics PDF
This slide shows dashboard of metrics of product such as revenue, new customers, customer satisfaction, sales comparison, revenue by customer, source , etc. Deliver an awe inspiring pitch with this creative optimization of product development life cycle dashboard showing product performance kpis topics pdf bundle. Topics like sales comparison, revenue by source, revenue by customer, customers by source can be discussed with this completely editable template. It is available for immediate download depending on the needs and requirements of the user.

Securities Allocation Dashboard For Project Metrics Information PDF
This slide shows the securities allocation dashboard for project management which focuses on expenses incurred on project which includes cash, commends, revenues and inventory with total allocation of securities with the percentage. Showcasing this set of slides titled Securities Allocation Dashboard For Project Metrics Information PDF. The topics addressed in these templates are Inventory, Project, Revenues. All the content presented in this PPT design is completely editable. Download it and make adjustments in color, background, font etc. as per your unique business setting.
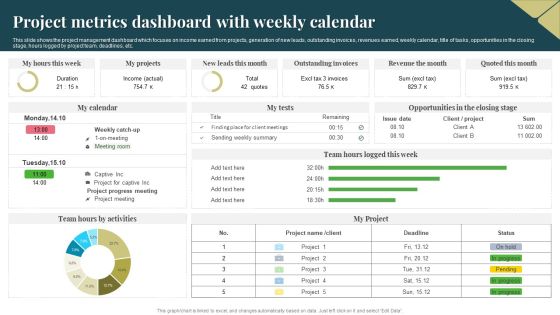
Project Metrics Dashboard With Weekly Calendar Download PDF
This slide shows the project management dashboard which focuses on income earned from projects, generation of new leads, outstanding invoices, revenues earned, weekly calendar, title of tasks, opportunities in the closing stage, hours logged by project team, deadlines, etc. Pitch your topic with ease and precision using this Project Metrics Dashboard With Weekly Calendar Download PDF. This layout presents information on Income, Revenue, Project. It is also available for immediate download and adjustment. So, changes can be made in the color, design, graphics or any other component to create a unique layout.
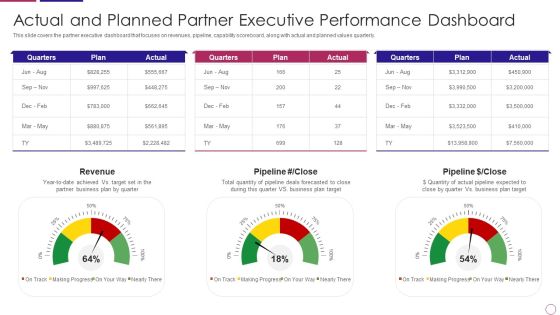
PRM To Streamline Business Processes Actual And Planned Partner Executive Performance Dashboard Demonstration PDF
This slide covers the partner executive dashboard that focuses on revenues, pipeline, capability scoreboard, along with actual and planned values quarterly. Deliver an awe inspiring pitch with this creative prm to streamline business processes actual and planned partner executive performance dashboard demonstration pdf bundle. Topics like revenue, plan, target can be discussed with this completely editable template. It is available for immediate download depending on the needs and requirements of the user.
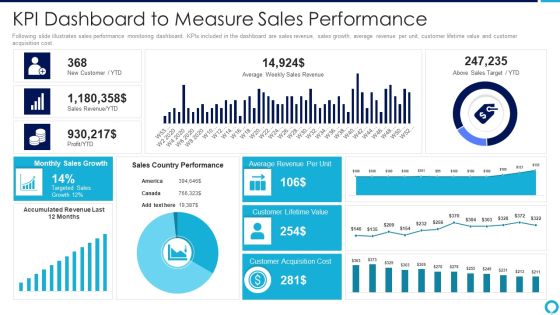
Partnership Management Strategies Kpi Dashboard To Measure Sales Performance Introduction PDF
Following slide illustrates sales performance monitoring dashboard. KPIs included in the dashboard are sales revenue, sales growth, average revenue per unit, customer lifetime value and customer acquisition cost.Deliver and pitch your topic in the best possible manner with this partnership management strategies kpi dashboard to measure sales performance introduction pdf Use them to share invaluable insights on average revenue, monthly sales growth, customer acquisition cost and impress your audience. This template can be altered and modified as per your expectations. So, grab it now.

New Product Sales Strategy And Marketing KPI Dashboard To Monitor Sales Performance Information PDF
This slide shows sales performance monitoring dashboard. Metrics included in the dashboard are sales revenue, sales growth, average revenue per unit, customer lifetime value and customer acquisition cost. Deliver an awe inspiring pitch with this creative New Product Sales Strategy And Marketing KPI Dashboard To Monitor Sales Performance Information PDF bundle. Topics like Sales Revenue, Monthly Sales Growth, Sales Country Performance can be discussed with this completely editable template. It is available for immediate download depending on the needs and requirements of the user.
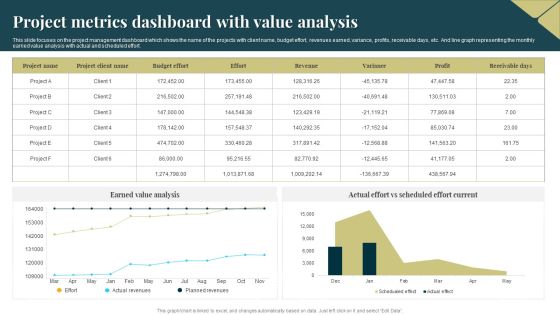
Project Metrics Dashboard With Value Analysis Introduction PDF
This slide focuses on the project management dashboard which shows the name of the projects with client name, budget effort, revenues earned, variance, profits, receivable days, etc. And line graph representing the monthly earned value analysis with actual and scheduled effort. Showcasing this set of slides titled Project Metrics Dashboard With Value Analysis Introduction PDF. The topics addressed in these templates are Budget Effort, Revenues, Earned Value Analysis. All the content presented in this PPT design is completely editable. Download it and make adjustments in color, background, font etc. as per your unique business setting.

Crm Marketing Dashboard Ppt PowerPoint Presentation Icon Graphic Tips
This is a crm marketing dashboard ppt powerpoint presentation icon graphic tips. This is a two stage process. The stages in this process are leads per week, leads this week.
Performance Dashboard Management Ppt PowerPoint Presentation Icon Themes
This is a performance dashboard management ppt powerpoint presentation icon themes. This is a four stage process. The stages in this process are finance, marketing, analysis, business, investment.

Performance Dashboard Marketing Ppt PowerPoint Presentation Show Microsoft
This is a performance dashboard marketing ppt powerpoint presentation show microsoft. This is a four stage process. The stages in this process are finance, marketing, analysis, business, investment.

Performance Dashboard Ppt PowerPoint Presentation Model Graphics Example
This is a performance dashboard ppt powerpoint presentation model graphics example. This is a four stage process. The stages in this process are finance, marketing, analysis, business, investment.

Digital Dashboard Resource Kit Ppt Powerpoint Slides Design
This is a digital dashboard resource kit ppt powerpoint slides design. This is a four stage process. The stages in this process are sales rate, progress, profits, safety.

Equity Capital Funding Dashboard Ppt Model Show PDF
Deliver an awe-inspiring pitch with this creative equity capital funding dashboard ppt model show pdf bundle. Topic like dashboard can be discussed with this completely editable template. It is available for immediate download depending on the needs and requirements of the user.

Sales Performance Dashboard Ppt PowerPoint Presentation Ideas Portfolio
This is a sales performance dashboard ppt powerpoint presentation ideas portfolio. This is a three stage process. The stages in this process are revenue, new customers, gross profit, customer satisfaction, sales comparison.

Dashboard Design And Development For Travel Diagram Background
This is a dashboard design and development for travel diagram background. This is a five stage process. The stages in this process are number of trips, sales, delayed flights, regional load, flight expense.
Sales Performance Dashboard Ppt PowerPoint Presentation Pictures Icons
This is a sales performance dashboard ppt powerpoint presentation pictures icons. This is a six stage process. The stages in this process are top selling plans, top opportunities, new customer, sales funnel, top sales reps.

Dashboard Diagram For Finance And Strategic Analysis Powerpoint Slides
This PowerPoint template display graphics of clock with arrows around it and dollar symbol in center. You may use this PPT slide for financial and strategic analysis. This dashboard slide may useful for multilevel status report creation and approval process.
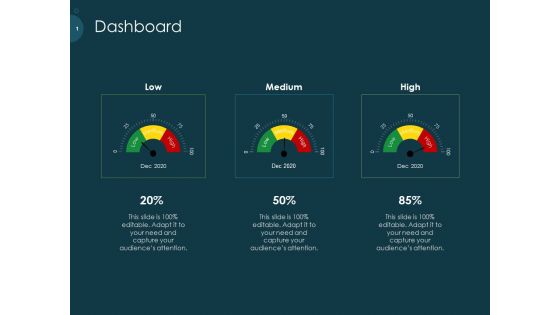
Raise Funding From Pre Seed Capital Dashboard Professional PDF
Showcasing this set of slides titled raise funding from pre seed capital dashboard professional pdf. The topics addressed in these templates is dashboard. All the content presented in this PPT design is completely editable. Download it and make adjustments in color, background, font etc. as per your unique business setting.

Reshaping Business In Digital Digital Finance Dashboard Topics PDF
This slide covers transformation dashboard covering various stages of a business along with the budget and risks involved at every stage. Deliver and pitch your topic in the best possible manner with this Reshaping Business In Digital Digital Finance Dashboard Topics PDF. Use them to share invaluable insights on Digital Finance Management, Total Digital, Sales Revenues and impress your audience. This template can be altered and modified as per your expectations. So, grab it now.

Dashboard Marketing Planning Ppt PowerPoint Presentation Slides Slideshow
This is a dashboard marketing planning ppt powerpoint presentation slides slideshow. This is a three stage process. The stages in this process are dashboard, finance, analysis, business, investment.

Cyber Security Administration In Organization Financial Performance Tracking Dashboard Microsoft PDF
This slide presents the dashboard which will help firm in tracking the fiscal performance. This dashboard displays revenues and expenses trends and payment received analysis. Deliver and pitch your topic in the best possible manner with this cyber security administration in organization financial performance tracking dashboard microsoft pdf. Use them to share invaluable insights on financial performance tracking dashboard and impress your audience. This template can be altered and modified as per your expectations. So, grab it now.

Strategic Partnership Management Plan Customer Relationship Management Dashboard Value Demonstration PDF
This slide covers the customer relationship management dashboard which includes company goals, revenue by deal source, new deals, etc. Deliver and pitch your topic in the best possible manner with this strategic partnership management plan customer relationship management dashboard value demonstration pdf. Use them to share invaluable insights on revenue this quarter, revenue goal attainment this year, revenue by deal source this year, revenue by deal source by owner this year, pipeline coverage this year, forecast this year, new deals by month this year and impress your audience. This template can be altered and modified as per your expectations. So, grab it now.
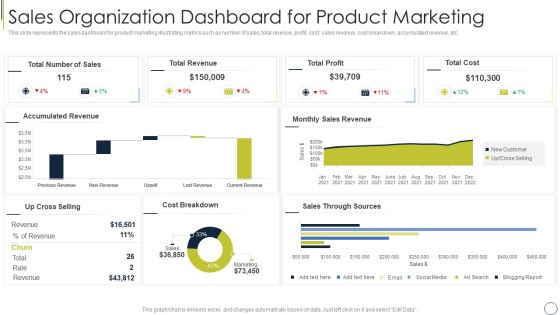
Sales Organization Dashboard For Product Marketing Themes PDF
This slide represents the sales dashboard for product marketing illustrating metrics such as number of sales, total revenue, profit, cost, sales revenue, cost breakdown, accumulated revenue, etc. Pitch your topic with ease and precision using this sales organization dashboard for product marketing themes pdf. This layout presents information on total cost, total profit, total revenue. It is also available for immediate download and adjustment. So, changes can be made in the color, design, graphics or any other component to create a unique layout.

PRM To Streamline Business Processes Partner Executive Performance Dashboard Designs PDF
This slide covers the partner executive dashboard that focuses on revenues, pipeline, capability scoreboard, key program activity summary, etc. Deliver an awe inspiring pitch with this creative prm to streamline business processes partner executive performance dashboard designs pdf bundle. Topics like on revenues, pipeline, capability scoreboard, key program activity summary can be discussed with this completely editable template. It is available for immediate download depending on the needs and requirements of the user.

Crm Dashboard Kpis Ppt PowerPoint Presentation Infographic Template Designs
This is a crm dashboard kpis ppt powerpoint presentation infographic template designs. This is a three stage process. The stages in this process are active subscribers, acquisition, revenue.

Crm Dashboard Kpis Ppt PowerPoint Presentation Inspiration Brochure
This is a crm dashboard kpis ppt powerpoint presentation inspiration brochure. This is a three stage process. The stages in this process are acquisition, active subscribers, revenue.

Performance Dashboard For E Commerce Business Financial Operations Infographics PDF
This slide represents performance dashboard for e-commerce financial process illustrating product sales, number of brands, revenue, number of units sold etc.Pitch your topic with ease and precision using this performance dashboard for e commerce business financial operations infographics pdf This layout presents information on category by total revenue, total revenue, purchase by age breakdown It is also available for immediate download and adjustment. So, changes can be made in the color, design, graphics or any other component to create a unique layout.

Performance Strategic Analysis Dashboard For Tactical Management Rules PDF
This slide defines the dashboard for analyzing the sales key performance indicators KPIs. It includes information related to the number of sales, revenue, profit, and cost. Showcasing this set of slides titled Performance Strategic Analysis Dashboard For Tactical Management Rules PDF. The topics addressed in these templates are Revenue, New Customers, Average Revenue, Per Customer. All the content presented in this PPT design is completely editable. Download it and make adjustments in color, background, font etc. as per your unique business setting.
Organizational Plan Overview Corporate Financial Performance Tracking Dashboard Icons PDF
This slide provides information regarding dashboard utilized by firm to monitor financial performance. The performance is tracked through revenues generated, vendors associated, profit generated, etc. Here you can discover an assortment of the finest PowerPoint and Google Slides templates. With these templates, you can create presentations for a variety of purposes while simultaneously providing your audience with an eye-catching visual experience. Download Organizational Plan Overview Corporate Financial Performance Tracking Dashboard Icons PDF to deliver an impeccable presentation. These templates will make your job of preparing presentations much quicker, yet still, maintain a high level of quality. Slidegeeks has experienced researchers who prepare these templates and write high-quality content for you. Later on, you can personalize the content by editing the Organizational Plan Overview Corporate Financial Performance Tracking Dashboard Icons PDF.
Product And Customer Performance Tracking Dashboard Portrait PDF
This slide provides information regarding dashboard utilized by firm to monitor performance of products offered and customer associated. The performance is tracked through revenues generated, new customer acquired, customer satisfaction, sales comparison, etc. Do you have an important presentation coming up Are you looking for something that will make your presentation stand out from the rest Look no further than Product And Customer Performance Tracking Dashboard Portrait PDF. With our professional designs, you can trust that your presentation will pop and make delivering it a smooth process. And with Slidegeeks, you can trust that your presentation will be unique and memorable. So why wait Grab Product And Customer Performance Tracking Dashboard Portrait PDF today and make your presentation stand out from the rest.
Product And Customer Performance Tracking Dashboard Summary PDF
This slide provides information regarding dashboard utilized by firm to monitor performance of products offered and customer associated. The performance is tracked through revenues generated, new customer acquired, customer satisfaction, sales comparison, etc. If you are looking for a format to display your unique thoughts, then the professionally designed Product And Customer Performance Tracking Dashboard Summary PDF is the one for you. You can use it as a Google Slides template or a PowerPoint template. Incorporate impressive visuals, symbols, images, and other charts. Modify or reorganize the text boxes as you desire. Experiment with shade schemes and font pairings. Alter, share or cooperate with other people on your work. Download Product And Customer Performance Tracking Dashboard Summary PDF and find out how to give a successful presentation. Present a perfect display to your team and make your presentation unforgettable.
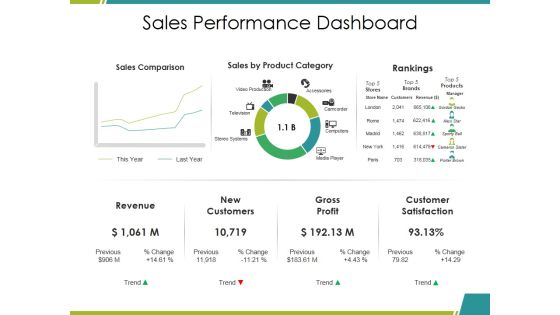
Sales Performance Dashboard Ppt PowerPoint Presentation Infographics Mockup
This is a sales performance dashboard ppt powerpoint presentation infographics mockup. This is a three stage process. The stages in this process are sales comparison, sales by product category, rankings, revenue, gross profit.

 Home
Home