AI PPT Maker
Templates
PPT Bundles
Design Services
Business PPTs
Business Plan
Management
Strategy
Introduction PPT
Roadmap
Self Introduction
Timelines
Process
Marketing
Agenda
Technology
Medical
Startup Business Plan
Cyber Security
Dashboards
SWOT
Proposals
Education
Pitch Deck
Digital Marketing
KPIs
Project Management
Product Management
Artificial Intelligence
Target Market
Communication
Supply Chain
Google Slides
Research Services
 One Pagers
All Categories
-
Home
- Customer Favorites
- Revenue Dashboard
Revenue Dashboard

Global Growth Data Analysis Bar Graph Ppt Powerpoint Presentation Infographic Template Outfit
This is a global growth data analysis bar graph ppt powerpoint presentation infographic template outfit. The topics discussed in this diagram are market growth, market opportunity, market profitability. This is a completely editable PowerPoint presentation, and is available for immediate download.

Transforming Big Data Analytics To Knowledge Where Does Big Data Come From Ppt Gallery Styles PDF
This is a transforming big data analytics to knowledge where does big data come from ppt gallery styles pdf template with various stages. Focus and dispense information on six stages using this creative set, that comes with editable features. It contains large content boxes to add your information on topics like transactions, social media, emails, audio, log data. You can also showcase facts, figures, and other relevant content using this PPT layout. Grab it now.

Business Income Growth Trends Vector Icon Ppt PowerPoint Presentation Infographics Background Images PDF
Presenting business income growth trends vector icon ppt powerpoint presentation infographics background images pdf to dispense important information. This template comprises three stages. It also presents valuable insights into the topics including business income growth trends vector icon. This is a completely customizable PowerPoint theme that can be put to use immediately. So, download it and address the topic impactfully.

Executing Advance Data Analytics At Workspace Current Potential Implications Demonstration PDF
This slide provides information regarding the potential implications concerns existing in firm in terms of increase in issues related to employees such as lack of expertise, ineffectiveness in handling issues, reported financial losses due to financial threats and data breaches with records exposed. Deliver an awe inspiring pitch with this creative executing advance data analytics at workspace current potential implications demonstration pdf bundle. Topics like current potential implications faced by firm can be discussed with this completely editable template. It is available for immediate download depending on the needs and requirements of the user.
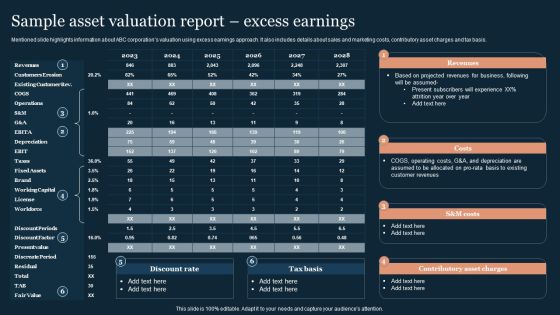
Guide To Develop And Estimate Brand Value Sample Asset Valuation Report Excess Earnings Professional PDF
Mentioned slide highlights information about ABC corporations valuation using excess earnings approach. It also includes details about sales and marketing costs, contributory asset charges and tax basis.Get a simple yet stunning designed Guide To Develop And Estimate Brand Value Sample Asset Valuation Report Excess Earnings Professional PDF. It is the best one to establish the tone in your meetings. It is an excellent way to make your presentations highly effective. So, download this PPT today from Slidegeeks and see the positive impacts. Our easy-to-edit Guide To Develop And Estimate Brand Value Sample Asset Valuation Report Excess Earnings Professional PDF can be your go-to option for all upcoming conferences and meetings. So, what are you waiting for Grab this template today.

Sample Asset Valuation Report Excess Earnings Sample Asset Valuation Summary Summary PDF
Mentioned slide highlights information about ABC corporations valuation using excess earnings approach. It also includes details about sales and marketing costs, contributory asset charges and tax basis.Do you have to make sure that everyone on your team knows about any specific topic I yes, then you should give Sample Asset Valuation Report Excess Earnings Sample Asset Valuation Summary Summary PDF a try. Our experts have put a lot of knowledge and effort into creating this impeccable Sample Asset Valuation Report Excess Earnings Sample Asset Valuation Summary Summary PDF. You can use this template for your upcoming presentations, as the slides are perfect to represent even the tiniest detail. You can download these templates from the Slidegeeks website and these are easy to edit. So grab these today.
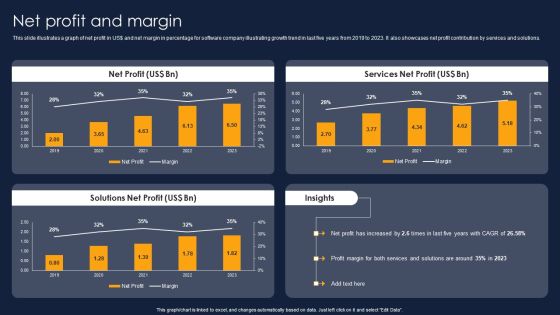
Net Profit And Margin Financial Performance Report Of Software Firm Demonstration PDF
This slide illustrates a graph of net profit in US doller and net margin in percentage for software company illustrating growth trend in last five years from 2019 to 2023. It also showcases net profit contribution by services and solutions. Present like a pro with Net Profit And Margin Financial Performance Report Of Software Firm Demonstration PDF Create beautiful presentations together with your team, using our easy-to-use presentation slides. Share your ideas in real-time and make changes on the fly by downloading our templates. So whether you are in the office, on the go, or in a remote location, you can stay in sync with your team and present your ideas with confidence. With Slidegeeks presentation got a whole lot easier. Grab these presentations today.
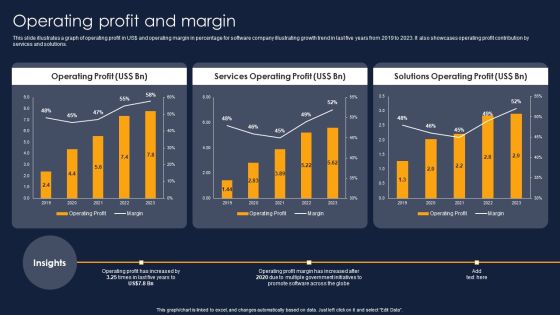
Operating Profit And Margin Financial Performance Report Of Software Firm Themes PDF
This slide illustrates a graph of operating profit in US doller and operating margin in percentage for software company illustrating growth trend in last five years from 2019 to 2023. It also showcases operating profit contribution by services and solutions. Slidegeeks is here to make your presentations a breeze with Operating Profit And Margin Financial Performance Report Of Software Firm Themes PDF With our easy-to-use and customizable templates, you can focus on delivering your ideas rather than worrying about formatting. With a variety of designs to choose from, you are sure to find one that suits your needs. And with animations and unique photos, illustrations, and fonts, you can make your presentation pop. So whether you are giving a sales pitch or presenting to the board, make sure to check out Slidegeeks first.

Comparative Analysis Of Data Migration Strategic Plan Diagrams PDF
The following slide represents the comparative assessment of various types of data migration strategies to select the best based on the requirements. It includes elements such as scalability, cost effectiveness, safety, accessibility etc. Presenting Comparative Analysis Of Data Migration Strategic Plan Diagrams PDF to dispense important information. This template comprises one stages. It also presents valuable insights into the topics including Cost Effective, Application, Cloud. This is a completely customizable PowerPoint theme that can be put to use immediately. So, download it and address the topic impactfully.
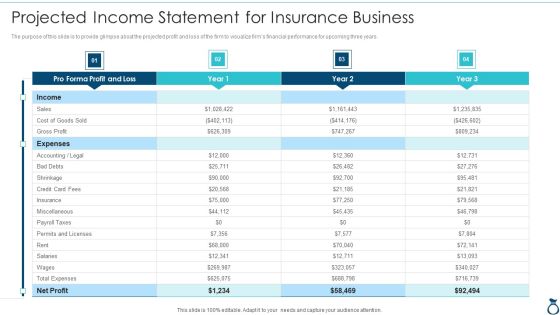
Financial Services Advisory Business Plan Projected Income Statement For Insurance Infographics PDF
The purpose of this slide is to provide glimpse about the projected profit and loss of the firm to visualize firms financial performance for upcoming three years. Deliver an awe inspiring pitch with this creative Financial Services Advisory Business Plan Projected Income Statement For Insurance Infographics PDF bundle. Topics like Profit And Loss, Insurance, Rent, Cost, Gross Profit can be discussed with this completely editable template. It is available for immediate download depending on the needs and requirements of the user.

Two Table Charts For Business Data Powerpoint Slides
This PowerPoint template contains two tables chart. You may download this PPT slide to display statistical analysis. You can easily customize this template to make it more unique as per your need.
Illustration Of 9 Stages Market Analysis Diagram Ppt Business Plan Companies PowerPoint Slides
We present our illustration of 9 stages market analysis diagram ppt business plan companies PowerPoint Slides.Present our Communication PowerPoint Templates because Our PowerPoint Templates and Slides will definately Enhance the stature of your presentation. Adorn the beauty of your thoughts with their colourful backgrounds. Present our Marketing PowerPoint Templates because Our PowerPoint Templates and Slides offer you the needful to organise your thoughts. Use them to list out your views in a logical sequence. Download and present our Business PowerPoint Templates because Our PowerPoint Templates and Slides are aesthetically designed to attract attention. We gaurantee that they will grab all the eyeballs you need. Present our Shapes PowerPoint Templates because It is Aesthetically crafted by artistic young minds. Our PowerPoint Templates and Slides are designed to display your dexterity. Download our Process and Flows PowerPoint Templates because Our PowerPoint Templates and Slides offer you the widest possible range of options.Use these PowerPoint slides for presentations relating to Market, sales, statistics, economy, target, achievement, corporate, business, success, presentation, diagram, finance, data, stock, analysis, flowchart, drawing, report, calculation, graph, illustration, economic, chart, money, pie-chart, planning, design, growth, pencil, company, competition, progress, investment, analyze, office, banking, financial, cash, exchange. The prominent colors used in the PowerPoint template are Yellow, Gray, Black.

Project Management Key Performance Indicators Balanced Scorecard Introduction PDF
This slide shows key performance indicators scorecard for the project management of the organization. It includes financial status, consumer satisfaction, business growth and internal objectives. Pitch your topic with ease and precision using this Project Management Key Performance Indicators Balanced Scorecard Introduction PDF. This layout presents information on Financial Status, Business Growth, Consumer Satisfaction. It is also available for immediate download and adjustment. So, changes can be made in the color, design, graphics or any other component to create a unique layout.
International Cloud Kitchen Industry Analysis Emerging Global Trends In Cloud Kitchen Market Icons PDF
The slide highlights emerging trends in global cloud kitchen market for sustainable growth and development. It highlights trends such as vertical consolidation, automation, recipe improvement and data driven. Make sure to capture your audiences attention in your business displays with our gratis customizable International Cloud Kitchen Industry Analysis Emerging Global Trends In Cloud Kitchen Market Icons PDF. These are great for business strategies, office conferences, capital raising or task suggestions. If you desire to acquire more customers for your tech business and ensure they stay satisfied, create your own sales presentation with these plain slides.

Big Data Analytics Vector Icon Ppt PowerPoint Presentation Layouts Show
Presenting this set of slides with name big data analytics vector icon ppt powerpoint presentation layouts show. This is a three stage process. The stages in this process are marketing, management, measuring results. This is a completely editable PowerPoint presentation and is available for immediate download. Download now and impress your audience.

Charts Representing Business Data Analysis Icon Introduction PDF
Presenting charts representing business data analysis icon introduction pdf. to dispense important information. This template comprises three stages. It also presents valuable insights into the topics including charts representing business data analysis icon. This is a completely customizable PowerPoint theme that can be put to use immediately. So, download it and address the topic impactfully.
Latest Trends And Opportunities In Manufacturing Data Analysis Designs PDF
Persuade your audience using this Latest Trends And Opportunities In Manufacturing Data Analysis Designs PDF. This PPT design covers four stages, thus making it a great tool to use. It also caters to a variety of topics including Manufacturing Data Analysis, Opportunities. Download this PPT design now to present a convincing pitch that not only emphasizes the topic but also showcases your presentation skills.

Fiscal And Operational Assessment 30 60 90 Days Plan Pictures PDF
Deliver an awe inspiring pitch with this creative fiscal and operational assessment 30 60 90 days plan pictures pdf bundle. Topics like data, applications, infrastructure, people can be discussed with this completely editable template. It is available for immediate download depending on the needs and requirements of the user.

Various Kpis Included In Performance Sales Report Graphics PDF
The slide covers the key performance indicators of a report to measure product sales. Various KPIs included are conversion rate, referrals and customer lifetime value. Persuade your audience using this Various Kpis Included In Performance Sales Report Graphics PDF. This PPT design covers three stages, thus making it a great tool to use. It also caters to a variety of topics including Conversion Rate, Referrals, Customer Lifetime Value. Download this PPT design now to present a convincing pitch that not only emphasizes the topic but also showcases your presentation skills.

Neuromarketing Strategy Icon For Business Financial Growth Ppt Pictures Microsoft PDF
Persuade your audience using this Neuromarketing Strategy Icon For Business Financial Growth Ppt Pictures Microsoft PDF. This PPT design covers three stages, thus making it a great tool to use. It also caters to a variety of topics including Neuromarketing Strategy Icon, Business Financial, Growth. Download this PPT design now to present a convincing pitch that not only emphasizes the topic but also showcases your presentation skills.
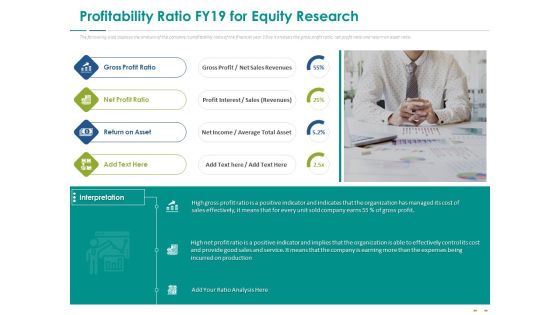
Stock Market Research Report Profitability Ratio FY19 For Equity Research Ideas PDF
The following slide displays the analysis of the companys profitability ratio of the financial year 19 as it analysis the gross profit ratio, net profit ratio and return on asset ratio. This is a stock market research report profitability ratio fy19 for equity research ideas pdf template with various stages. Focus and dispense information on four stages using this creative set, that comes with editable features. It contains large content boxes to add your information on topics like gross profit ratio, net profit ratio, return on asset, net income. You can also showcase facts, figures, and other relevant content using this PPT layout. Grab it now.

Cloud Based Vendor Service Features Analysis Report Template Ppt PowerPoint Presentation Slides Clipart Images PDF
Pitch your topic with ease and precision using this cloud based vendor service features analysis report template ppt powerpoint presentation slides clipart images pdf. This layout presents information on diverse supplier database, simplified data import, spend tracking, financial scorecard. It is also available for immediate download and adjustment. So, changes can be made in the color, design, graphics or any other component to create a unique layout.

Convertible Preferred Stock Funding Pitch Deck Competitive Analysis By Financial And Operational Data Brochure PDF
The slide provides the Competitive landscape of the company on the basis of financial data sales and profit and operational data employee count, locations, year of existence etc. Deliver an awe inspiring pitch with this creative convertible preferred stock funding pitch deck competitive analysis by financial and operational data brochure pdf bundle. Topics like sales, profit margin, service, quality, locations can be discussed with this completely editable template. It is available for immediate download depending on the needs and requirements of the user.

Convertible Debt Financing Pitch Deck Competitive Analysis By Financial And Operational Data Slides PDF
The slide provides the Competitive landscape of the company on the basis of financial data sales and profit and operational data employee count, locations, year of existence etc. Deliver an awe-inspiring pitch with this creative convertible debt financing pitch deck competitive analysis by financial and operational data slides pdf bundle. Topics like profit margin, employee count, sales, product, service can be discussed with this completely editable template. It is available for immediate download depending on the needs and requirements of the user.
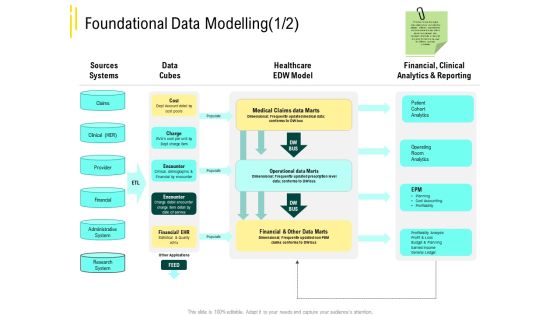
Expert Systems Foundational Data Modelling Medical Claims Information PDF
This is a expert systems foundational data modelling medical claims information pdf. template with various stages. Focus and dispense information on one stages using this creative set, that comes with editable features. It contains large content boxes to add your information on topics like sources systems, healthcare edw model, financial, clinical analytics and reporting, medical claims, analytics, operating. You can also showcase facts, figures, and other relevant content using this PPT layout. Grab it now.

Customer Credit Reporting Company Outline Capital Expenditure Capex Designs PDF
This slide highlights the Experian company capital expenditure breakdown which includes and total capital investment breakdown with development, infrastructure and data. There are so many reasons you need a Customer Credit Reporting Company Outline Capital Expenditure Capex Designs PDF. The first reason is you cannot spend time making everything from scratch, Thus, Slidegeeks has made presentation templates for you too. You can easily download these templates from our website easily.

Data Driven Organizational Culture Icon Depicting Statistical Analysis Sample PDF
Persuade your audience using this data driven organizational culture icon depicting statistical analysis sample pdf. This PPT design covers three stages, thus making it a great tool to use. It also caters to a variety of topics including data driven organizational culture icon depicting statistical analysis. Download this PPT design now to present a convincing pitch that not only emphasizes the topic but also showcases your presentation skills.

Annual Customer Service Performance Review Example Of Ppt
This is a annual customer service performance review example of ppt. This is a twelve stage process. The stages in this process are bar graph, growth, data, customer, success.
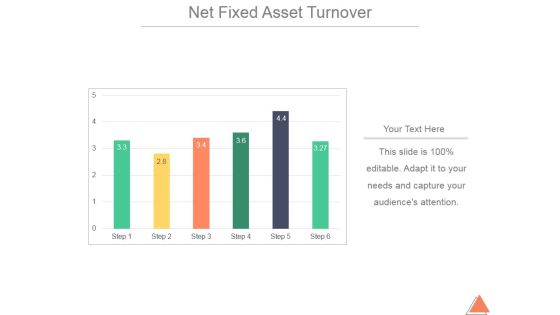
Net Fixed Asset Turnover Ppt PowerPoint Presentation Slide Download
This is a net fixed asset turnover ppt powerpoint presentation slide download. This is a one stage process. The stages in this process are business, marketing, finance, management, planning.

Acquisition Cost Per Customer Ppt PowerPoint Presentation Example 2015
This is a acquisition cost per customer ppt powerpoint presentation example 2015. This is a three stage process. The stages in this process are rising, steady, falling.
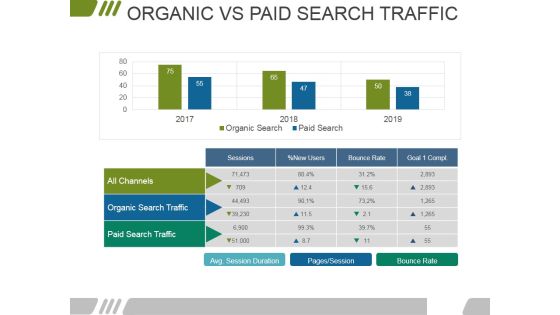
Organic Vs Paid Search Traffic Ppt PowerPoint Presentation Summary Visuals
This is a organic vs paid search traffic ppt powerpoint presentation summary visuals. This is a two stage process. The stages in this process are all channels, organic search traffic, paid search traffic, sessions, bounce rate.
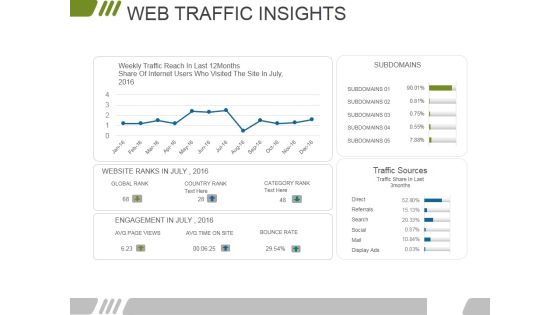
Web Traffic Insights Ppt PowerPoint Presentation Pictures Portrait
This is a web traffic insights ppt powerpoint presentation pictures portrait. This is a four stage process. The stages in this process are subdomains, traffic sources, category rank, country rank, global rank.
Website Performance Review Template 1 Ppt PowerPoint Presentation Slides Icons
This is a website performance review template 1 ppt powerpoint presentation slides icons. This is a three stage process. The stages in this process are online transaction, conversion rate, traffic source, site consumption time, organic branded.

Feature Development Data Associated Activities Guidelines PDF
This slide exhibits survey of data scientists to understand feature engineering activities that helps to improve performance of machine learning business models. It includes activities such as data cleaning, organizing, collection, mining, refining algorithms etc. Pitch your topic with ease and precision using this Feature Development Data Associated Activities Guidelines PDF. This layout presents information on Programming, Developing Training Sets, Gathering Data Sets. It is also available for immediate download and adjustment. So, changes can be made in the color, design, graphics or any other component to create a unique layout.

Data Insights Ppt PowerPoint Presentation Complete Deck With Slides
Improve your presentation delivery using this Data Insights Ppt PowerPoint Presentation Complete Deck With Slides. Support your business vision and objectives using this well structured PPT deck. This template offers a great starting point for delivering beautifully designed presentations on the topic of your choice. Comprising eleven this professionally designed template is all you need to host discussion and meetings with collaborators. Each slide is self explanatory and equipped with high quality graphics that can be adjusted to your needs. Therefore, you will face no difficulty in portraying your desired content using this PPT slideshow. This PowerPoint slideshow contains every important element that you need for a great pitch. It is not only editable but also available for immediate download and utilization. The color, font size, background, shapes everything can be modified to create your unique presentation layout. Therefore, download it now.
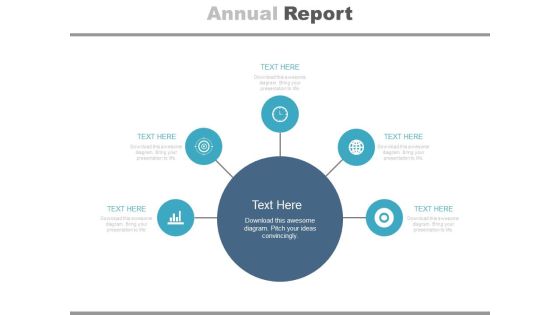
Diagram For Market Research Analysis Powerpoint Slides
This PowerPoint template has been designed with circular infographic diagram. It can be used to display steps for market research and also for financial data analysis. You can download finance PowerPoint template to prepare awesome presentations.

Key Metrics Presentation Powerpoint Example
This is a key metrics presentation powerpoint example. This is a two stage process. The stages in this process are residential customer churn, broadband availability.
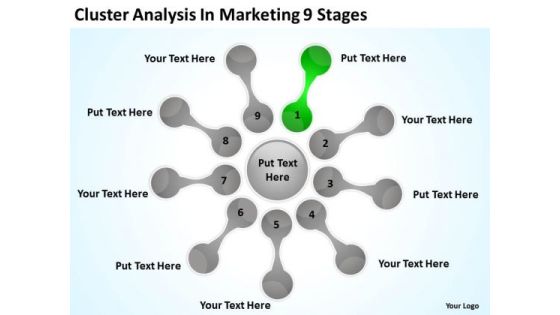
Cluster Analysis In Marketing 9 Stages Basic Business Plan Outline PowerPoint Templates
We present our cluster analysis in marketing 9 stages basic business plan outline PowerPoint templates.Present our Process and Flows PowerPoint Templates because It is Aesthetically crafted by artistic young minds. Our PowerPoint Templates and Slides are designed to display your dexterity. Download our Flow Charts PowerPoint Templates because Our PowerPoint Templates and Slides will give you great value for your money. Be assured of finding the best projection to highlight your words. Use our Marketing PowerPoint Templates because Our PowerPoint Templates and Slides will weave a web of your great ideas. They are gauranteed to attract even the most critical of your colleagues. Download our Shapes PowerPoint Templates because It will let you Set new benchmarks with our PowerPoint Templates and Slides. They will keep your prospects well above par. Use our Business PowerPoint Templates because They will Put your wonderful verbal artistry on display. Our PowerPoint Templates and Slides will provide you the necessary glam and glitter.Use these PowerPoint slides for presentations relating to Mapping, vector, chart, flow, flowchart, process, model, step, tool, blank, processdiagram, concept, topic, presentation, relate, circle, graphic, data, report, marketing, idea, circlepattern, team, management, graph, cycle, illustration, connection, processchart,direction, plans, color, text, phase, organization, control, connect, link, explanation, mapping, present. The prominent colors used in the PowerPoint template are Gray, Green, White.
Economic Trends Analysis Dollar Sign With Four Arrows Ppt PowerPoint Presentation Layouts Icons
This is a economic trends analysis dollar sign with four arrows ppt powerpoint presentation layouts icons. This is a four stage process. The stages in this process are stock market, financial markets, bull market.

Guidebook For Executing Business Market Intelligence Data Evaluation With Maxdiff Analysis Method Designs PDF
Make sure to capture your audiences attention in your business displays with our gratis customizable Guidebook For Executing Business Market Intelligence Data Evaluation With Maxdiff Analysis Method Designs PDF. These are great for business strategies, office conferences, capital raising or task suggestions. If you desire to acquire more customers for your tech business and ensure they stay satisfied, create your own sales presentation with these plain slides.

Cybersecurity Statistical Data Insights Sample PDF
The given below slide presents the number of organizations being victim of cyber attacks in the previous year. It also includes category wise attack data in the form of donut chart. Pitch your topic with ease and precision using this Cybersecurity Statistical Data Insights Sample PDF. This layout presents information on Social Media Attacks, Malware Attacks, Phishing Attacks. It is also available for immediate download and adjustment. So, changes can be made in the color, design, graphics or any other component to create a unique layout.

Business Framework Economic Value Add 2 PowerPoint Presentation
This image slide displays business framework for economic value added diagram. This image slide may be used in your presentations to depict firms economic profits and business financial reports. You may change color, size and orientation of any icon to your liking. Create professional presentations using this image slide.

Content Delivery And Promotion Metrics To Track For Different Earned Media Topics PDF
This slide showcases metrics that can help organization to evaluate the effectiveness of content on different earned media channels. Its key elements are channel, key stats and metrics to track. Presenting this PowerPoint presentation, titled Content Delivery And Promotion Metrics To Track For Different Earned Media Topics PDF, with topics curated by our researchers after extensive research. This editable presentation is available for immediate download and provides attractive features when used. Download now and captivate your audience. Presenting this Content Delivery And Promotion Metrics To Track For Different Earned Media Topics PDF. Our researchers have carefully researched and created these slides with all aspects taken into consideration. This is a completely customizable Content Delivery And Promotion Metrics To Track For Different Earned Media Topics PDF that is available for immediate downloading. Download now and make an impact on your audience. Highlight the attractive features available with our PPTs.

Profit Growth Graph With Gears Powerpoint Template
This business slide contains profit growth graph with gears. This PowerPoint template helps to display outline of business plan. Use this diagram to impart more clarity to data and to create more sound impact on viewers.

Price Analysis Diagram For Analysis In Financial Data Ppt Infographics Summary PDF
Showcasing this set of slides titled price analysis diagram for analysis in financial data ppt infographics summary pdf. The topics addressed in these templates are price analysis diagram for analysis in financial data. All the content presented in this PPT design is completely editable. Download it and make adjustments in color, background, font etc. as per your unique business setting.

Company Economic Influences Layout Powerpoint Images
This is a company economic influences layout powerpoint images. This is a seven stage process. The stages in this process are economic trend, organic growth, companynear term prospect, company performance, market driven response, strategic acquisitions, industry dynamics.
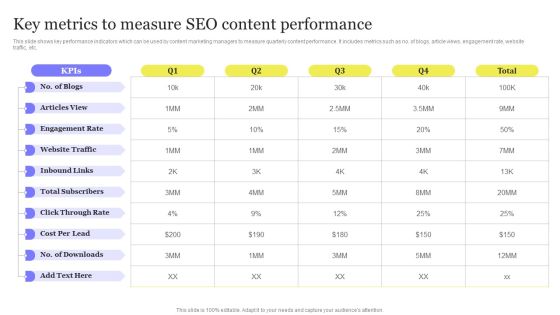
Enhancing Digital Visibility Using SEO Content Strategy Key Metrics To Measure SEO Content Performance Guidelines PDF
This slide shows key performance indicators which can be used by content marketing managers to measure quarterly content performance. It includes metrics such as no. of blogs, article views, engagement rate, website traffic, etc. Make sure to capture your audiences attention in your business displays with our gratis customizable Enhancing Digital Visibility Using SEO Content Strategy Key Metrics To Measure SEO Content Performance Guidelines PDF. These are great for business strategies, office conferences, capital raising or task suggestions. If you desire to acquire more customers for your tech business and ensure they stay satisfied, create your own sales presentation with these plain slides.
Monthly Budget Report With Calculator Vector Icon Ppt PowerPoint Presentation Model Information PDF
Presenting this set of slides with name monthly budget report with calculator vector icon ppt powerpoint presentation model information pdf. This is a three stage process. The stages in this process are monthly budget report with calculator vector icon. This is a completely editable PowerPoint presentation and is available for immediate download. Download now and impress your audience.

Data And Customer Analysis Company Outline Financial Performance Estimation FY22 Pictures PDF
This slide highlights the Nielsen financial performance guidance which includes the EBITDA, free cash flow, organic CC growth, interest expense, tax rate, depreciation and amortization, and average diluted shares. Formulating a presentation can take up a lot of effort and time, so the content and message should always be the primary focus. The visuals of the PowerPoint can enhance the presenters message, so our Data And Customer Analysis Company Outline Financial Performance Estimation FY22 Pictures PDF was created to help save time. Instead of worrying about the design, the presenter can concentrate on the message while our designers work on creating the ideal templates for whatever situation is needed. Slidegeeks has experts for everything from amazing designs to valuable content, we have put everything into Data And Customer Analysis Company Outline Financial Performance Estimation FY22 Pictures PDF
Financial Graph Economic Growth Vector Icon Ppt PowerPoint Presentation Infographics Graphic Images Cpb
This is a financial graph economic growth vector icon ppt powerpoint presentation infographics graphic images cpb. This is a three stage process. The stages in this process are bar chart icon, bar graph icon, data chart icon.

Financial Projections And Key Metrics Ppt PowerPoint Presentation Styles Skills
This is a financial projections and key metrics ppt powerpoint presentation styles skills. This is a five stage process. The stages in this process are expenses, profits, sales, employees, years.

Data Warehousing IT Data Warehouse Bus Architecture Ppt Deck PDF
This slide describes the data warehouse bus architecture and how it decides the flow of the data in the data warehouse, such as inflow, outflow, upflow, downflow, and meta flow. Deliver an awe inspiring pitch with this creative data warehousing it data warehouse bus architecture ppt deck pdf bundle. Topics like performance, location, profitability, calendar data can be discussed with this completely editable template. It is available for immediate download depending on the needs and requirements of the user.

Agency Performance Template 2 Ppt PowerPoint Presentation Background Images
This is a agency performance template 2 ppt powerpoint presentation background images. This is a four stage process. The stages in this process are brand safety, viewability, industry snapshot.

Search Engine Rankings Ppt PowerPoint Presentation Gallery Summary
This is a search engine rankings ppt powerpoint presentation gallery summary. This is a three stage process. The stages in this process are summary top 3 results, search engine ranking, keyword, benchmark.
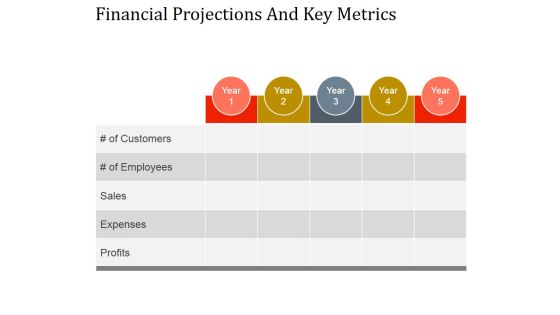
Financial Projections And Key Metrics Ppt PowerPoint Presentation Designs
This is a financial projections and key metrics ppt powerpoint presentation designs. This is a five stage process. The stages in this process are profits, expenses, sales, of employees, of customers.
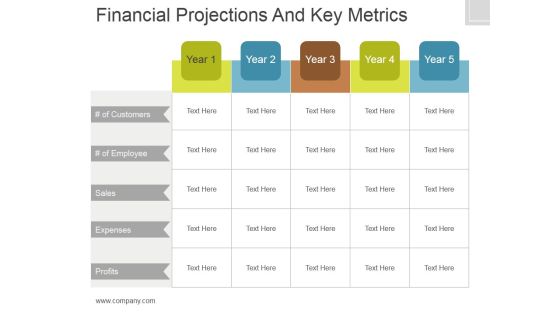
Financial Projections And Key Metrics Ppt PowerPoint Presentation Show
This is a financial projections and key metrics ppt powerpoint presentation show. This is a five stage process. The stages in this process are of customers, sales, expenses, profits.

Transformation Toolkit Competitive Intelligence Information Analysis Key Considerations In Implementing Data Designs PDF
This slide represents the key challenges of identifying and implementing data analytics for the purpose of decision making. It contains considerations like lack of data analysis tools, resource availability etc. Make sure to capture your audiences attention in your business displays with our gratis customizable Transformation Toolkit Competitive Intelligence Information Analysis Key Considerations In Implementing Data Designs PDF. These are great for business strategies, office conferences, capital raising or task suggestions. If you desire to acquire more customers for your tech business and ensure they stay satisfied, create your own sales presentation with these plain slides.

Financial Projections And Key Metrics Ppt PowerPoint Presentation Professional
This is a financial projections and key metrics ppt powerpoint presentation professional. This is a five stage process. The stages in this process are customers, employees, sales, expenses, profits.

Sequence Of Market Analysis 5 Stages Successful Business Plan Examples PowerPoint Slides
We present our sequence of market analysis 5 stages successful business plan examples PowerPoint Slides.Download and present our Process and Flows PowerPoint Templates because You can Channelise the thoughts of your team with our PowerPoint Templates and Slides. Urge them to focus on the goals you have set. Use our Flow Charts PowerPoint Templates because You are working at that stage with an air of royalty. Let our PowerPoint Templates and Slides be the jewels in your crown. Present our Marketing PowerPoint Templates because They will Put your wonderful verbal artistry on display. Our PowerPoint Templates and Slides will provide you the necessary glam and glitter. Use our Shapes PowerPoint Templates because You canTake a leap off the starting blocks with our PowerPoint Templates and Slides. They will put you ahead of the competition in quick time. Download and present our Future PowerPoint Templates because Our PowerPoint Templates and Slides help you meet the demand of the Market. Just browse and pick the slides that appeal to your intuitive senses.Use these PowerPoint slides for presentations relating to Vector, sign, icon, market, isolated, green, white, corporate, business, concept, success, symbol, diagram, graphic, finance, data, element, drawing, report, shape, abstract, illustration, strategy, money, design, growth, colorful, progress, part, information, background, investment, financial, communication . The prominent colors used in the PowerPoint template are Red, Pink, Blue.
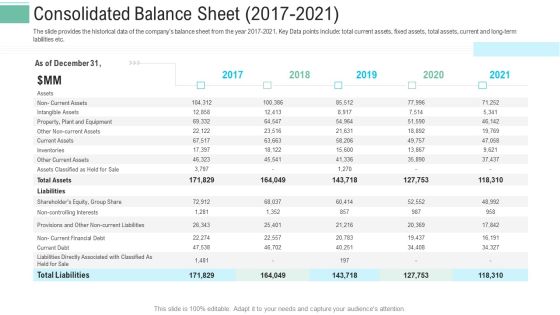
Pitch Presentation Raise Money Spot Market Consolidated Balance Sheet 2017 To 2021 Brochure PDF
The slide provides the historical data of the companys balance sheet from the year 2017-2021. Key Data points include total current assets, fixed assets, total assets, current and long-term labilities etc. Deliver and pitch your topic in the best possible manner with this pitch presentation raise money spot market consolidated balance sheet 2017 to 2021 brochure pdf. Use them to share invaluable insights on inventories, intangible assets, financial debt, shareholders equity and impress your audience. This template can be altered and modified as per your expectations. So, grab it now.
