Revenue Dashboard
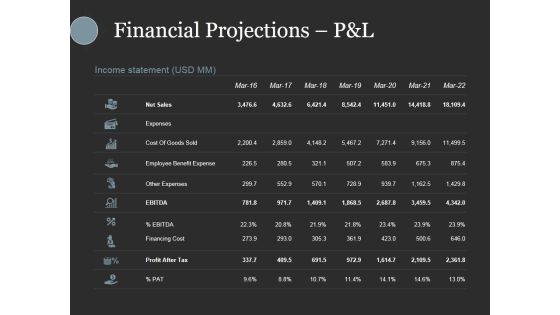
Financial Projections Pandl Ppt PowerPoint Presentation Slides Show
This is a financial projections pandl ppt powerpoint presentation slides show. This is a seven stage process. The stages in this process are net sales, expenses, cost of goods sold, employee benefit expense, other expenses.
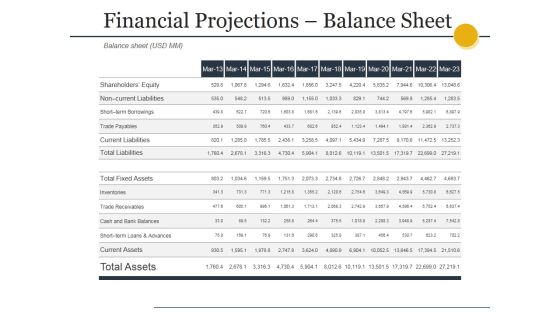
Financial Projections Balance Sheet Ppt PowerPoint Presentation Model Template
This is a financial projections balance sheet ppt powerpoint presentation model template. This is a eleven stage process. The stages in this process are current assets, cash and bank balances, trade receivables, inventories, total fixed assets.
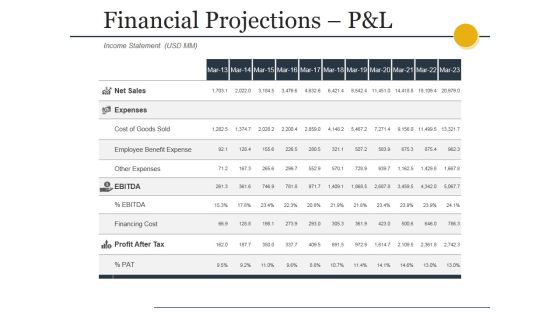
Financial Projections Pandl Ppt PowerPoint Presentation Styles Gallery
This is a financial projections pandl ppt powerpoint presentation styles gallery. This is a eleven stage process. The stages in this process are net sales, expenses, cost of goods sold, employee benefit expense, other expenses.
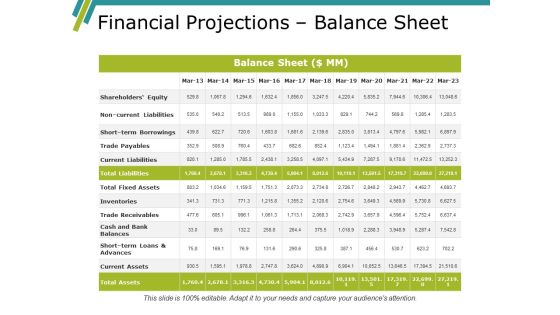
Financial Projections Balance Sheet Ppt PowerPoint Presentation Ideas Slide Portrait
This is a financial projections balance sheet ppt powerpoint presentation ideas slide portrait. This is a three stage process. The stages in this process are balance sheet, total assets, cost, planning, management.
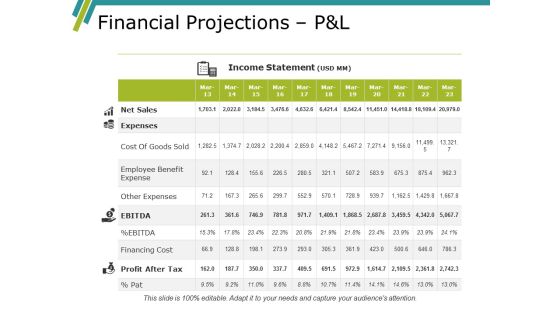
Financial Projections Pandl Ppt PowerPoint Presentation Outline Objects
This is a financial projections pandl ppt powerpoint presentation outline objects. This is a eleven stage process. The stages in this process are balance sheet, total assets, cost, planning, management.
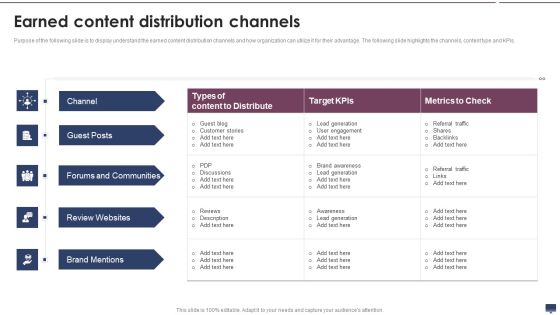
Earned Content Distribution Channels Summary PDF
Purpose of the following slide is to display understand the earned content distribution channels and how organization can utilize it for their advantage. The following slide highlights the channels, content type and KPIs. This is a Earned Content Distribution Channels Summary PDF template with various stages. Focus and dispense information on five stages using this creative set, that comes with editable features. It contains large content boxes to add your information on topics like Forums And Communities, Review Websites, Brand Mentions. You can also showcase facts, figures, and other relevant content using this PPT layout. Grab it now.

Financial Investment Process Diagram Ppt Design
This is a financial investment process diagram ppt design. This is a eight stage process. The stages in this process are identify investment goal, determine risk tolerance and time horizon, written investment policy statement, accounts established, investments allocated, quarterly investment reports, monitor portfolio and provide tax planning data, annual portfolio review and re optimize portfolio.
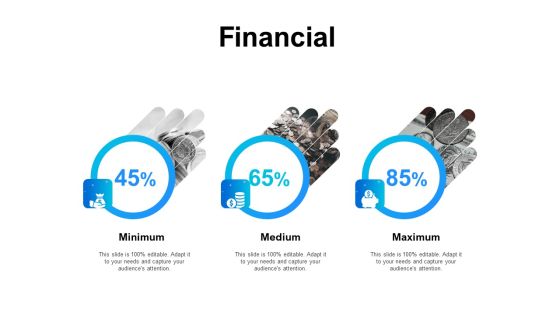
Gap Analysis Budgeting And Reporting Financial Ppt PowerPoint Presentation Portfolio Example File PDF
Presenting this set of slides with name gap analysis budgeting and reporting financial ppt powerpoint presentation portfolio example file pdf. This is a three stage process. The stages in this process are minimum, medium, maximum. This is a completely editable PowerPoint presentation and is available for immediate download. Download now and impress your audience.
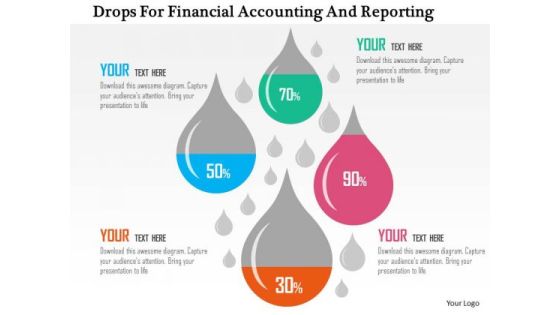
Business Diagram Drops For Financial Accounting And Reporting Presentation Template
This business diagram has been designed with drops displaying financial ratios. Download this diagram to depict financial and accounting ratios. Use this slide to build quality presentations for your viewers.
Financial Planning And Assessment Vector Icon Ppt Powerpoint Presentation Gallery Styles
This is a financial planning and assessment vector icon ppt powerpoint presentation gallery styles. This is a one stage process. The stages in this process are feedback loop icon, evaluation icon, assessment icon.
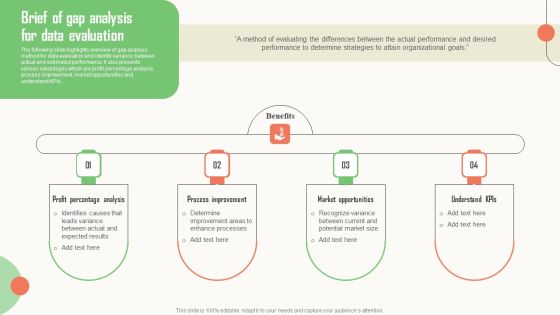
Strategic Market Insight Implementation Guide Brief Of Gap Analysis For Data Evaluation Sample PDF
The following slide highlights overview of gap analysis method for data evaluation and identify variance between actual and estimated performance. It also presents various advantages which are profit percentage analysis, process improvement, market opportunities and understand KPIs. Want to ace your presentation in front of a live audience Our Strategic Market Insight Implementation Guide Brief Of Gap Analysis For Data Evaluation Sample PDF can help you do that by engaging all the users towards you. Slidegeeks experts have put their efforts and expertise into creating these impeccable powerpoint presentations so that you can communicate your ideas clearly. Moreover, all the templates are customizable, and easy to edit and downloadable. Use these for both personal and commercial use.
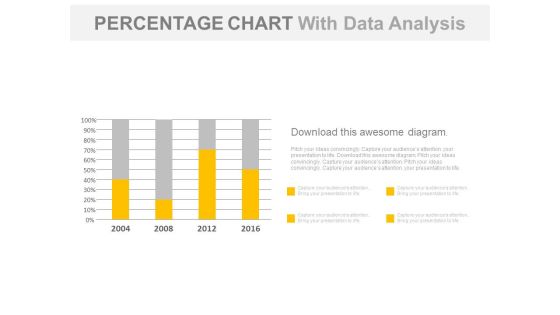
Year Based Chart With Percentage Data Analysis Powerpoint Slides
Our above business slide contains year based statistical chart. This PowerPoint template can be used to display percentage data analysis. Capture the attention of your audience with this slide.

Bar Graph For Data Distribution And Analysis Powerpoint Slides
This PowerPoint template has been designed with bar graph. This PowerPoint diagram is useful for data distribution and analysis This diagram slide can be used to make impressive presentations.

Financial Management Kpi Metrics Operating Profit Margin Ppt Powerpoint Presentation Infographic Template Images
This is a financial management kpi metrics operating profit margin ppt powerpoint presentation infographic template images. This is a three stage process. The stages in this process are finance, marketing, management, investment, analysis.

Bar Graph For Financial Statements Ppt PowerPoint Presentation Example
This is a bar graph for financial statements ppt powerpoint presentation example. This is a four stage process. The stages in this process are product version, finance, year.
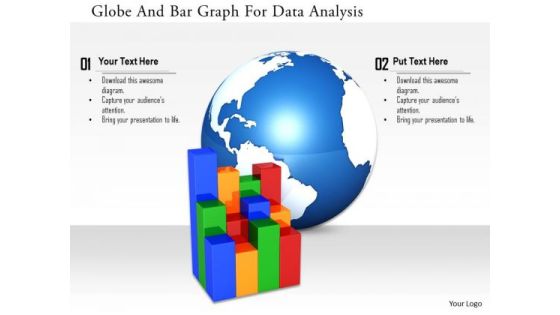
Stock Photo Globe And Bar Graph For Data Analysis Image Graphics For PowerPoint Slide
This image slide has been designed with business graph with globe in background. This image slide represents topics like global business, economic growth. This image will enhance the quality of your presentations.
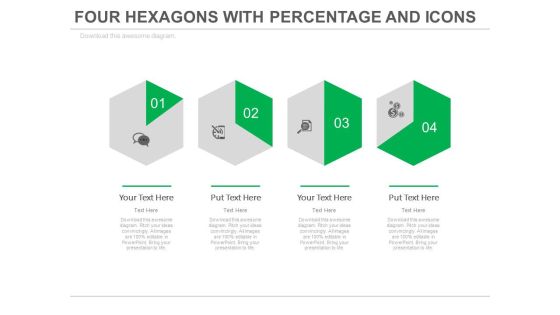
Four Steps Of Financial Growth Analysis Powerpoint Slides
This PowerPoint template with multiple Hexagons can be creatively used to present a timeline in a visual manner. This slide can also help the audience understand a 6 step process in an easier manner. The icons are totally customizable and can be edited to represent the particular process happening at that stage. It can also be used to represent different times or different activities to be carried out at different times in in a day in an office or an organization (e.g. - Medicine schedule) since the hexagon represents a clock and change of shade moves in a clockwise manner. The diagram can be used to represent a comparison or a report or an analysis of the data.

Benefits Of Big Data Ppt PowerPoint Presentation Inspiration
This is a benefits of big data ppt powerpoint presentation inspiration. This is a four stage process. The stages in this process are increased efficiency, better business decision making, improved customer experience and engagement, achieved financial savings.
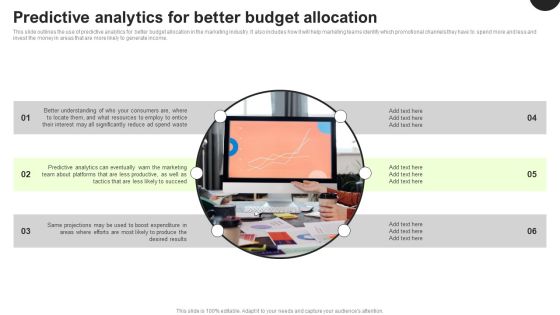
Predictive Analytics In The Age Of Big Data Predictive Analytics For Better Budget Allocation Inspiration PDF
This slide outlines the use of predictive analytics for better budget allocation in the marketing industry. It also includes how it will help marketing teams identify which promotional channels they have to spend more and less and invest the money in areas that are more likely to generate income. Make sure to capture your audiences attention in your business displays with our gratis customizable Predictive Analytics In The Age Of Big Data Predictive Analytics For Better Budget Allocation Inspiration PDF. These are great for business strategies, office conferences, capital raising or task suggestions. If you desire to acquire more customers for your tech business and ensure they stay satisfied, create your own sales presentation with these plain slides.

Business Economic Report For Financial Analysis Icon Ppt PowerPoint Presentation Gallery Slide Portrait PDF
Presenting business economic report for financial analysis icon ppt powerpoint presentation gallery slide portrait pdf to dispense important information. This template comprises three stages. It also presents valuable insights into the topics including business economic report for financial analysis icon. This is a completely customizable PowerPoint theme that can be put to use immediately. So, download it and address the topic impactfully.
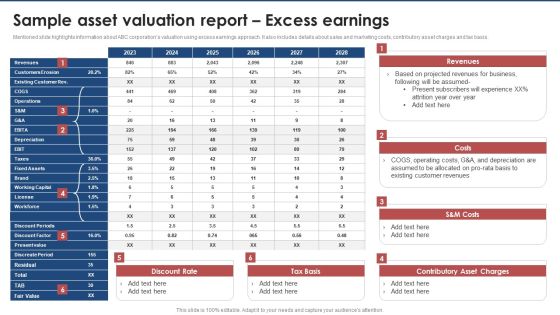
Sample Asset Valuation Report Excess Earnings Brand Value Estimation Guide Designs PDF
Mentioned slide highlights information about ABC corporations valuation using excess earnings approach. It also includes details about sales and marketing costs, contributory asset charges and tax basis.Boost your pitch with our creative Sample Asset Valuation Report Excess Earnings Brand Value Estimation Guide Designs PDF. Deliver an awe-inspiring pitch that will mesmerize everyone. Using these presentation templates you will surely catch everyones attention. You can browse the ppts collection on our website. We have researchers who are experts at creating the right content for the templates. So you do not have to invest time in any additional work. Just grab the template now and use them.

Comprehensive Guide To Strengthen Brand Equity Sample Asset Valuation Report Excess Earnings Formats PDF
Mentioned slide highlights information about ABC corporations valuation using excess earnings approach. It also includes details about sales and marketing costs, contributory asset charges and tax basis. If your project calls for a presentation, then Slidegeeks is your go to partner because we have professionally designed, easy to edit templates that are perfect for any presentation. After downloading, you can easily edit Comprehensive Guide To Strengthen Brand Equity Sample Asset Valuation Report Excess Earnings Formats PDF and make the changes accordingly. You can rearrange slides or fill them with different images. Check out all the handy templates
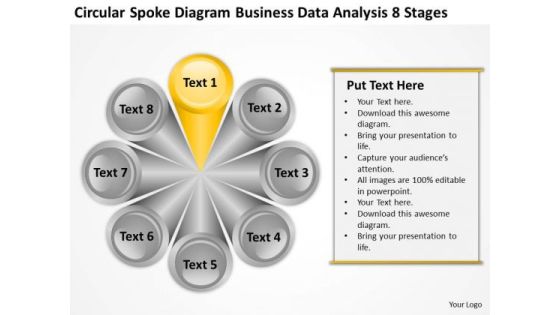
Diagram Business Data Analysis 8 Stages Ppt For Plan PowerPoint Templates
We present our diagram business data analysis 8 stages ppt for plan PowerPoint templates.Download our Process and Flows PowerPoint Templates because Our PowerPoint Templates and Slides will give you great value for your money. Be assured of finding the best projection to highlight your words. Present our Circle Charts PowerPoint Templates because Our PowerPoint Templates and Slides will let you Leave a lasting impression to your audiences. They possess an inherent longstanding recall factor. Use our Business PowerPoint Templates because Our PowerPoint Templates and Slides are like the strings of a tennis racquet. Well strung to help you serve aces. Present our Marketing PowerPoint Templates because You should Press the right buttons with our PowerPoint Templates and Slides. They will take your ideas down the perfect channel. Download our Shapes PowerPoint Templates because Our PowerPoint Templates and Slides help you pinpoint your timelines. Highlight the reasons for your deadlines with their use.Use these PowerPoint slides for presentations relating to Provider, plan, vector, diagram, circle, insurance, graphic, service, graph, wheel, illustration, chart, round, primary, specialist, clipart, care, choosing, clip, blue, text, physician, maintenance, , organization, art, preferred, point, deductible, business. The prominent colors used in the PowerPoint template are Orange, Gray, Black.
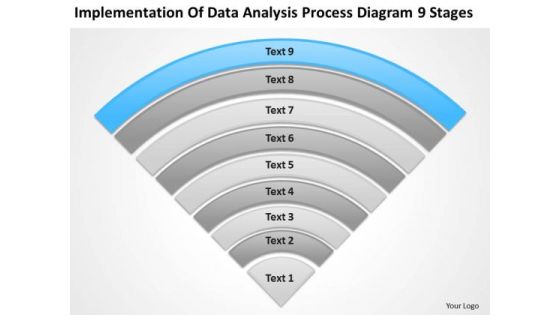
Implementation Of Data Analysis Process Diagram 9 Stages Ppt Business Plan PowerPoint Templates
We present our implementation of data analysis process diagram 9 stages ppt business plan PowerPoint templates.Download and present our Process and Flows PowerPoint Templates because You are an avid believer in ethical practices. Highlight the benefits that accrue with our PowerPoint Templates and Slides. Present our Triangles PowerPoint Templates because Our PowerPoint Templates and Slides will Activate the energies of your audience. Get their creative juices flowing with your words. Present our Business PowerPoint Templates because It will Raise the bar of your Thoughts. They are programmed to take you to the next level. Present our Shapes PowerPoint Templates because Our PowerPoint Templates and Slides will give you great value for your money. Be assured of finding the best projection to highlight your words. Present our Marketing PowerPoint Templates because You can Be the star of the show with our PowerPoint Templates and Slides. Rock the stage with your ideas.Use these PowerPoint slides for presentations relating to Color, print, plate, paint, diagram, chart, process, gamma, press, isolated, semicircle, white, sample, spectrum, pantone, template, circle, sampler, guide, graphic, printout, technology, , computer, management, palette, illustration, spectral, object, system, round, design, selection, choice, rainbow, chooser. The prominent colors used in the PowerPoint template are Blue, Gray, Black.

Data Structure IT Financial Clipart PDF
If your project calls for a presentation, then Slidegeeks is your go-to partner because we have professionally designed, easy-to-edit templates that are perfect for any presentation. After downloading, you can easily edit Data Structure IT Financial Clipart PDF and make the changes accordingly. You can rearrange slides or fill them with different images. Check out all the handy templates

Enterprise Tactical Planning Business Management Kpis Metrics Profit Pictures PDF
This is a enterprise tactical planning business management kpis metrics profit pictures pdf template with various stages. Focus and dispense information on six stages using this creative set, that comes with editable features. It contains large content boxes to add your information on topics like budgeted income, budgeted expenses, paid expenses, accounts payable, accounts receivable. You can also showcase facts, figures, and other relevant content using this PPT layout. Grab it now.
Statistical Data For Identity Fraud Reports Icons PDF
This slide showcases identity thefts and frauds complaints in various years. This template focuses on providing layers of protection to customers digital identities and reduce risk of financial loss. It includes information related to consumer complainants, etc. Showcasing this set of slides titled Statistical Data For Identity Fraud Reports Icons PDF. The topics addressed in these templates are Poor Management Information, Lack Of Transparency, Protected Accounts. All the content presented in this PPT design is completely editable. Download it and make adjustments in color, background, font etc. as per your unique business setting.

Data Collection Histograms Ppt PowerPoint Presentation Icon Slides
This is a data collection histograms ppt powerpoint presentation icon slides. This is a two stage process. The stages in this process are bar chart, finance, marketing, business, analysis.

Data Collection Form Requirements With Financial Details Ppt PowerPoint Presentation Pictures
This is a data collection form requirements with financial details ppt powerpoint presentation pictures. This is a stage seven process. The stages in this process are form, financial form, data collection, financial details, data analysis.

Things For Market Analysis 2 Stages How To Do Business Plan PowerPoint Templates
We present our things for market analysis 2 stages how to do business plan PowerPoint templates.Download and present our Process and Flows PowerPoint Templates because You have the co-ordinates for your destination of success. Let our PowerPoint Templates and Slides map out your journey. Download our Business PowerPoint Templates because Timeline crunches are a fact of life. Meet all deadlines using our PowerPoint Templates and Slides. Present our Marketing PowerPoint Templates because Our PowerPoint Templates and Slides are like the strings of a tennis racquet. Well strung to help you serve aces. Present our Flow Charts PowerPoint Templates because Our PowerPoint Templates and Slides will Embellish your thoughts. They will help you illustrate the brilliance of your ideas. Download and present our Future PowerPoint Templates because Our PowerPoint Templates and Slides ensures Effective communication. They help you put across your views with precision and clarity.Use these PowerPoint slides for presentations relating to Vector, sign, icon, market, isolated, green, white, corporate, business, concept, success, symbol, diagram, graphic, finance, data, element, drawing, report, shape, abstract, illustration, strategy, money, design, growth, colorful, progress, part, information, background, investment, financial, communication . The prominent colors used in the PowerPoint template are Green lime, Gray, Orange.
Income Statement Kpis Ppt PowerPoint Presentation Icon Background Images
This is a income statement kpis ppt powerpoint presentation icon background images. This is a four stage process. The stages in this process are net sales, other income, expenses, other expenses, total material consumed.

P And L Kpis Ppt PowerPoint Presentation Portfolio Slide
This is a p and l kpis ppt powerpoint presentation portfolio slide. This is a four stage process. The stages in this process are ebitda, profit before tax, profit after tax, expenses, net sales.

Pandl Kpis Tabular Form Ppt PowerPoint Presentation Outline Background
This is a pandl kpis tabular form ppt powerpoint presentation outline background. This is a four stage process. The stages in this process are net sales, expenses, ebitda, profit before tax, profit after tax.
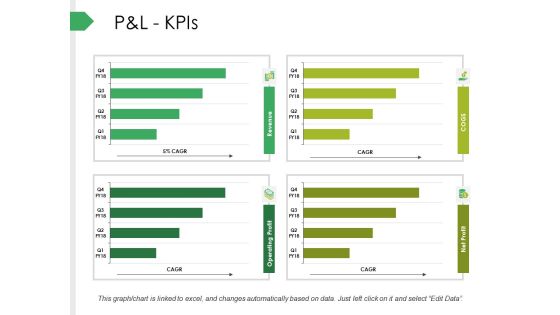
P And L Kpis Ppt PowerPoint Presentation Infographics Background
This is a p and l kpis ppt powerpoint presentation infographics background. This is a four stage process. The stages in this process are net sales, expenses, ebitda, profit before tax, profit after tax.

Benefits Of Big Data Ppt PowerPoint Presentation Example 2015
This is a benefits of big data ppt powerpoint presentation example 2015. This is a four stage process. The stages in this process are business, marketing, success, finance, analysis.
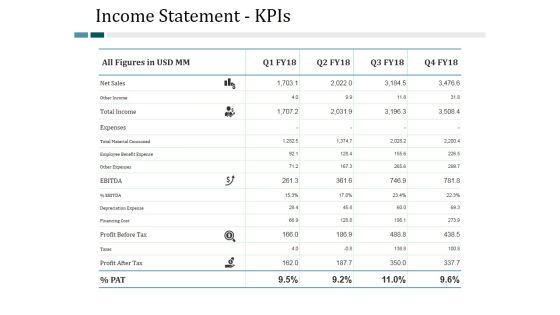
Income Statement Kpis Ppt PowerPoint Presentation Slides Show
This is a income statement kpis ppt powerpoint presentation slides show. This is a four stage process. The stages in this process are business, management, analysis, finance, strategy.
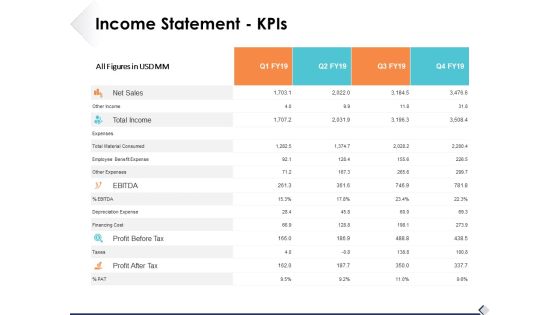
Income Statement Kpis Ppt PowerPoint Presentation Professional Template
This is a income statement kpis ppt powerpoint presentation professional template. This is a four stage process. The stages in this process are business, management, strategy, analysis, icons.
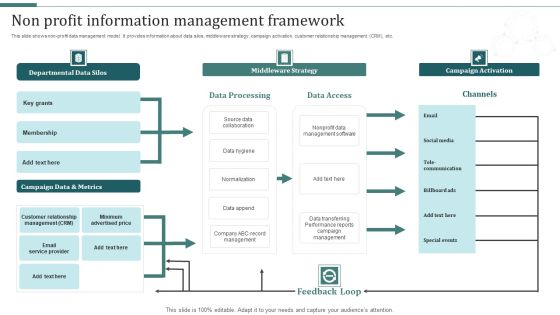
Non Profit Information Management Framework Download PDF
This slide shows non profit data management model. It provides information about data silos, middleware strategy, campaign activation, customer relationship management CRM, etc. Pitch your topic with ease and precision using this Non Profit Information Management Framework Download PDF. This layout presents information on Data Hygiene, Data Append, Data Access. It is also available for immediate download and adjustment. So, changes can be made in the color, design, graphics or any other component to create a unique layout.

Economic Growth Report Ppt PowerPoint Presentation Gallery Deck Cpb
This is a economic growth report ppt powerpoint presentation gallery deck cpb. This is a six stage process. The stages in this process are economic growth report.

Performance Measures Ppt PowerPoint Presentation Inspiration Skills
This is a performance measures ppt powerpoint presentation inspiration skills. This is a two stage process. The stages in this process are non financial measures, financial measures, growth, business, marketing.
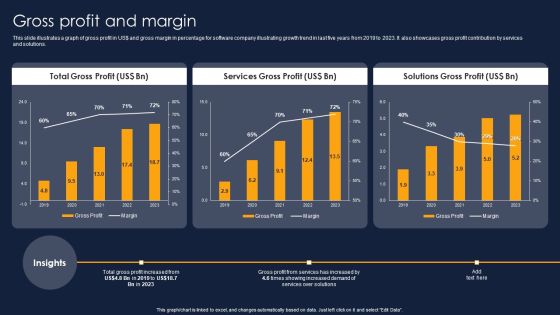
Gross Profit And Margin Financial Performance Report Of Software Firm Background PDF
This slide illustrates a graph of gross profit in US doller and gross margin in percentage for software company illustrating growth trend in last five years from 2019 to 2023. It also showcases gross profit contribution by services and solutions. From laying roadmaps to briefing everything in detail, our templates are perfect for you. You can set the stage with your presentation slides. All you have to do is download these easy-to-edit and customizable templates. Gross Profit And Margin Financial Performance Report Of Software Firm Background PDF will help you deliver an outstanding performance that everyone would remember and praise you for. Do download this presentation today.

Market Trends Ppt PowerPoint Presentation Sample
This is a market trends ppt powerpoint presentation sample. This is a two stage process. The stages in this process are sales in taxes, sales in thousand, brand, fy.
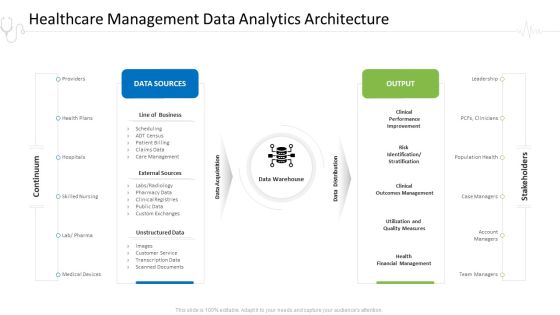
Hospital Administration Healthcare Management Data Analytics Architecture Ppt Infographics Information PDF
This is a hospital administration healthcare management data analytics architecture ppt infographics information pdf template with various stages. Focus and dispense information on two stages using this creative set, that comes with editable features. It contains large content boxes to add your information on topics like line of business, external sources, management, performance improvement, financial management. You can also showcase facts, figures, and other relevant content using this PPT layout. Grab it now.

Business Management Kpis Metrics Income Ppt Example File PDF
This is a business management kpis metrics income ppt example file pdf. template with various stages. Focus and dispense information on six stages using this creative set, that comes with editable features. It contains large content boxes to add your information on topics like budgeted income, received income, accounts receivable. You can also showcase facts, figures, and other relevant content using this PPT layout. Grab it now.
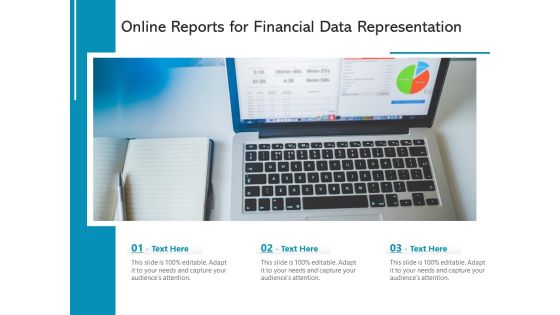
Online Reports For Financial Data Representation Ppt PowerPoint Presentation Professional Picture PDF
Presenting online reports for financial data representation ppt powerpoint presentation professional picture pdf to dispense important information. This template comprises three stages. It also presents valuable insights into the topics including online reports for financial data representation. This is a completely customizable PowerPoint theme that can be put to use immediately. So, download it and address the topic impactfully.

The Solution Venture Capital Investor Pitch Deck Pictures PDF
Purpose of this slide is to provide information about the solution offered by the company. It shows that company is offering a software that will include such as Automation tools, analytics and reporting. Presenting The Solution Venture Capital Investor Pitch Deck Pictures PDF to provide visual cues and insights. Share and navigate important information on three stages that need your due attention. This template can be used to pitch topics like Analytics And Reporting, Data Automation Customer. In addtion, this PPT design contains high resolution images, graphics, etc, that are easily editable and available for immediate download.

Monetary Planning And Evaluation Guide Possible Financial Risks Identified And Strategies To Mitigate Them Ppt Ideas Display PDF
The following slide outlines different strategies which can be deployed to overcome financial risks. It covers information about credit, digital transformation and legal risk. The Monetary Planning And Evaluation Guide Possible Financial Risks Identified And Strategies To Mitigate Them Ppt Ideas Display PDF is a compilation of the most recent design trends as a series of slides. It is suitable for any subject or industry presentation, containing attractive visuals and photo spots for businesses to clearly express their messages. This template contains a variety of slides for the user to input data, such as structures to contrast two elements, bullet points, and slides for written information. Slidegeeks is prepared to create an impression.
Sales Order Processing Performance Tracking Indicators Graphics PDF
The following slide showcases key performance indicators for sales order fulfilment to meet customer expectations, specifications, deliver goods on time, compare order fulfilment against past orders. It includes elements such as category, key performance indicators, expected rate and actual rate. Showcasing this set of slides titled Sales Order Processing Performance Tracking Indicators Graphics PDF. The topics addressed in these templates are Customer Metrics, Inbound Metrics, Financial Metrics. All the content presented in this PPT design is completely editable. Download it and make adjustments in color, background, font etc. as per your unique business setting.

Ppt Direct Description Of Banking Process Using 3 Stages PowerPoint Templates
PPT direct description of banking process using 3 stages PowerPoint Templates-This PowerPoint Diagram shows three circular boxes on the arrow pointing towards east direction signifying he completion of the process and leading towards success.-PPT direct description of banking process using 3 stages PowerPoint Templates-Arrow, Bank, Benefit, Business, Calculate, Calculation, Capitalist, Communication, Company, Concern, Connection, Data, Diagram, Digital, Drawing, Earnings, Economic, Finance, Financial, Flow, Forecast, Gain, Goal, Graph, Growth, Illustration, Increase, Information, Interest, Investing, Management, Market, Money, Move, Network, Objective, Plan, Process, Profit, Progress, Report, Rise, Risk, Shares, Statistics, Stock, System, Technology

Pie Chart With Coins Finance PowerPoint Templates And PowerPoint Backgrounds 0811
Microsoft PowerPoint Template and Background with pie chart with coins and statistic data
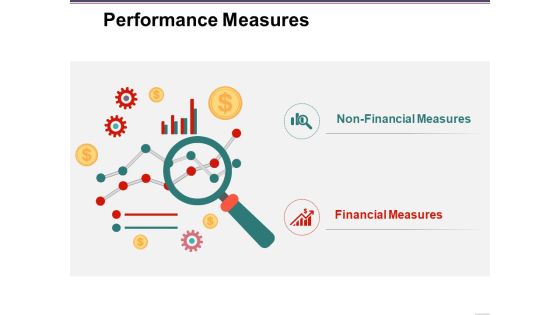
Performance Measures Ppt PowerPoint Presentation Layouts Clipart Images
This is a performance measures ppt powerpoint presentation layouts clipart images. This is a two stage process. The stages in this process are non financial measures, financial measures, business, icons, marketing.
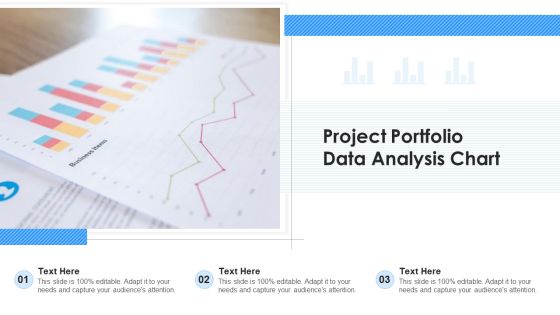
Project Portfolio Data Analysis Chart Ppt Ideas Gallery PDF
Presenting project portfolio data analysis chart ppt ideas gallery pdf to dispense important information. This template comprises three stages. It also presents valuable insights into the topics including project portfolio data analysis chart. This is a completely customizable PowerPoint theme that can be put to use immediately. So, download it and address the topic impactfully.

Business Data IT Security Analysis Icon With Shield Download PDF
Presenting Business Data IT Security Analysis Icon With Shield Download PDF to dispense important information. This template comprises three stages. It also presents valuable insights into the topics including Business Data IT Security, Analysis Icon With Shield. This is a completely customizable PowerPoint theme that can be put to use immediately. So, download it and address the topic impactfully.

Business Financial Summary Report And Marketing Highlights Ppt File Icon PDF
This slide represents business snapshot for financial and marketing highlights. It includes business objectives, opportunities and challenges, financial highlights, marketing strategy, future steps and priorities. Showcasing this set of slides titled Business Financial Summary Report And Marketing Highlights Ppt File Icon PDF. The topics addressed in these templates are Location, Marketing Strategy, Financials, Objectives. All the content presented in this PPT design is completely editable. Download it and make adjustments in color, background, font etc. as per your unique business setting.

Data Collection Scatter Diagram Ppt PowerPoint Presentation Summary Deck
This is a data collection scatter diagram ppt powerpoint presentation summary deck. This is a three stage process. The stages in this process are business, marketing, strategy, finance, analysis.

Financial Background PowerPoint Templates And PowerPoint Backgrounds 0511
Microsoft PowerPoint Template and Background with abstract background with barcode binary data leaks and money sphere financial and e-commerce concept

Percentage Data Growth Chart Powerpoint Slides
This PowerPoint template has been designed with percentage data growth chart. Download this PPT chart to depict financial ratio analysis. This PowerPoint slide is of great help in the business sector to make realistic presentations and provides effective way of presenting your newer thoughts.
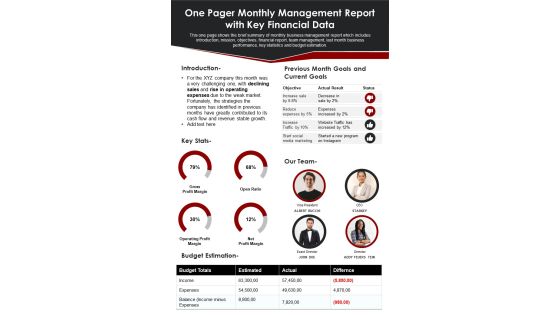
One Pager Monthly Management Report With Key Financial Data PDF Document PPT Template
Looking for a predesigned One Pager Monthly Management Report With Key Financial Data PDF Document PPT Template Heres the perfect piece for you It has everything that a well-structured one-pager template should have. Besides, it is 100 percent editable, which offers you the cushion to make adjustments according to your preferences. Grab this One Pager Monthly Management Report With Key Financial Data PDF Document PPT Template Download now.

Income Statement Kpis Company Profile Ppt File Graphics Pictures PDF
Deliver and pitch your topic in the best possible manner with this income statement kpis company profile ppt file graphics pictures pdf. Use them to share invaluable insights on financing cost, expenses, depreciation expense, sales and impress your audience. This template can be altered and modified as per your expectations. So, grab it now.
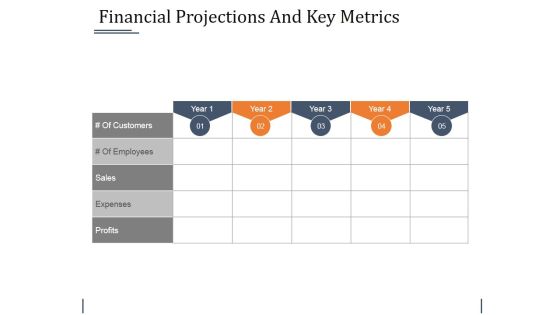
Financial Projections And Key Metrics Ppt PowerPoint Presentation Layouts Objects
This is a financial projections and key metrics ppt powerpoint presentation layouts objects. This is a five stage process. The stages in this process are sales, expenses, profits.

 Home
Home