AI PPT Maker
Templates
PPT Bundles
Design Services
Business PPTs
Business Plan
Management
Strategy
Introduction PPT
Roadmap
Self Introduction
Timelines
Process
Marketing
Agenda
Technology
Medical
Startup Business Plan
Cyber Security
Dashboards
SWOT
Proposals
Education
Pitch Deck
Digital Marketing
KPIs
Project Management
Product Management
Artificial Intelligence
Target Market
Communication
Supply Chain
Google Slides
Research Services
 One Pagers
All Categories
-
Home
- Customer Favorites
- Revenue Dashboard
Revenue Dashboard
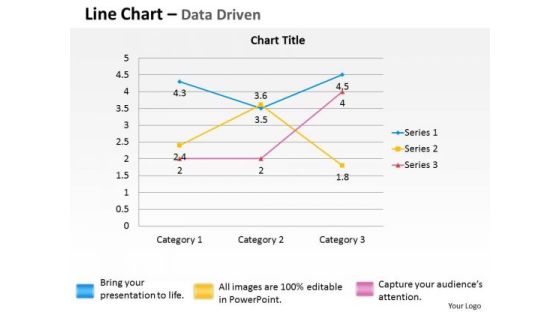
Quantitative Data Analysis Driven Economic Line Chart PowerPoint Slides Templates
Break The Deadlock With Our quantitative data analysis driven economic line chart powerpoint slides Templates . Let The Words Start To Flow.

Marketers Guide To Data Analysis Optimization Case Study Improving Teams Performance Using Marketing Professional PDF
This slide covers a case study of a company that improved various business teams performance by utilizing marketing analytics. The issues solved are developing proprietary insights engines, reporting weekly advertising spends, timely reporting, and stopping marketing APIs. Make sure to capture your audiences attention in your business displays with our gratis customizable Marketers Guide To Data Analysis Optimization Case Study Improving Teams Performance Using Marketing Professional PDF. These are great for business strategies, office conferences, capital raising or task suggestions. If you desire to acquire more customers for your tech business and ensure they stay satisfied, create your own sales presentation with these plain slides.

Data Analytics Ppt PowerPoint Presentation Guide
This is a data analytics ppt powerpoint presentation guide. This is a five stage process. The stages in this process are data analysis, business, marketing, success, graph.

Quantitative Data Analysis Bar Chart For Financial Markets PowerPoint Templates
Draft It Out On Our quantitative data analysis bar chart for financial markets Powerpoint Templates . Give The Final Touches With Your Ideas.
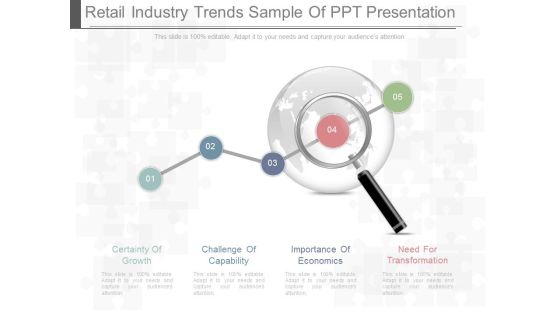
Retail Industry Trends Sample Of Ppt Presentation
This is a retail industry trends sample of ppt presentation. This is a five stage process. The stages in this process are certainty of growth, challenge of capability, importance of economics, need for transformation.
Magnifying Glass Ppt PowerPoint Presentation Designs Download
This is a magnifying glass ppt powerpoint presentation designs download. This is a two stage process. The stages in this process are magnifying glass, business, marketing, finance, management.

Magnifier Glass Ppt PowerPoint Presentation Inspiration Example
This is a magnifier glass ppt powerpoint presentation inspiration example. This is a four stage process. The stages in this process are magnifying glass, business, marketing, management, planning.

Data Analysis In Excel Column Chart For Business Analytics PowerPoint Templates
Our data analysis in excel column chart for business analytics Powerpoint Templates Heighten Concentration. Your Audience Will Be On The Edge.
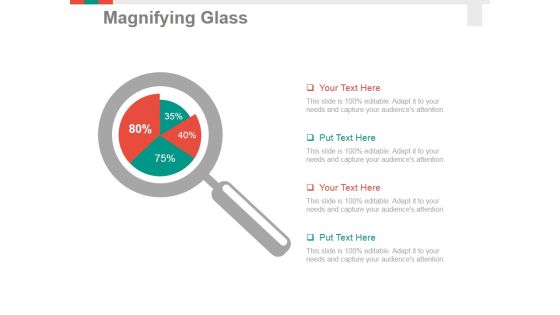
Magnifying Glass Ppt PowerPoint Presentation Pictures Graphics Design
This is a magnifying glass ppt powerpoint presentation pictures graphics design. This is a four stage process. The stages in this process are magnifier, search, marketing, analysis, business.

Fiscal Planning Template Powerpoint Slides Templates
This is a fiscal planning template powerpoint slides templates. This is a six stage process. The stages in this process are evaluation, implementation, develop a plan, receive regular data report, responsibility accounting, steps in fiscal planning.
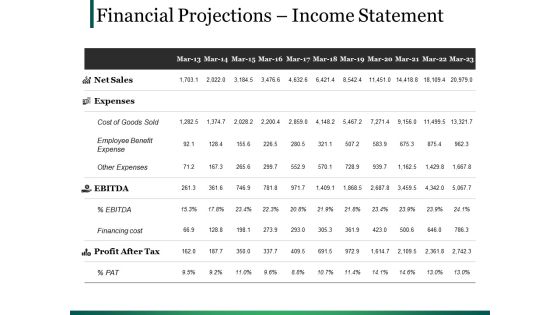
Financial Projections Income Statement Ppt PowerPoint Presentation Model Format
This is a financial projections income statement ppt powerpoint presentation model format. This is a two stage process. The stages in this process are tables, marketing, planning, strategy, finance.
Upward Profit Growth Arrow Graph Vector Icon Ppt PowerPoint Presentation Styles Templates
Presenting this set of slides with name upward profit growth arrow graph vector icon ppt powerpoint presentation styles templates. This is a one stage process. The stages in this process are data visualization icon, research analysis, business focus. This is a completely editable PowerPoint presentation and is available for immediate download. Download now and impress your audience.

Arrow Infographics For Financial Data Analysis Powerpoint Template
This PowerPoint slide contains diagram of arrows infographic. This professional slide helps to exhibit financial data analysis for business growth. Use this PowerPoint template to make impressive presentations.
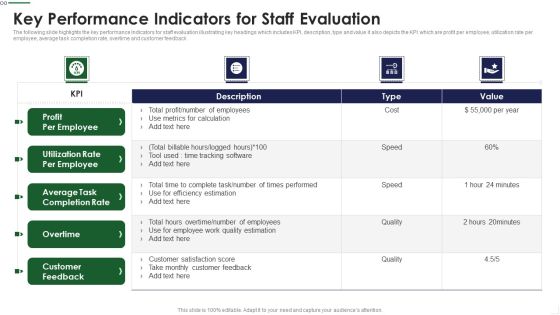
Key Performance Indicators For Staff Evaluation Infographics PDF
The following slide highlights the key performance Indicators for staff evaluation illustrating key headings which includes KPI, description, type and value it also depicts the KPI which are profit per employee, utilization rate per employee, average task completion rate, overtime and customer feedback Showcasing this set of slides titled Key Performance Indicators For Staff Evaluation Infographics PDF The topics addressed in these templates are Metrics Calculation, Times Performed, Customer Satisfaction All the content presented in this PPT design is completely editable. Download it and make adjustments in color, background, font etc. as per your unique business setting.

Big Data Analytics Procedure For Management Accounting Formats PDF
This slide illustrate big data analysis process for management accounting to generate financial reports for decision making. It includes elements such as cost accounting balance scorecards, performance measurement etc. Showcasing this set of slides titled Big Data Analytics Procedure For Management Accounting Formats PDF. The topics addressed in these templates are Accounting, Internal Data, Social Media. All the content presented in this PPT design is completely editable. Download it and make adjustments in color, background, font etc. as per your unique business setting.

Pandl Kpis Ppt PowerPoint Presentation Gallery Display
This is a pandl kpis ppt powerpoint presentation gallery display. This is a four stage process. The stages in this process are net sales, total income, expenses, ebitda, profit after tax.

10 Designs To An Amazing Pitch Example Of Ppt
This is a 10 designs to an amazing pitch example of ppt. This is a ten stage process. The stages in this process are business model, money, market size, the solution, team, marketing plan, competition, elevator pitch, proprietary tech, the problem.

Business Tactical And Strategic Analysis For Profitability Growth Icon Pictures PDF
Presenting Business Tactical And Strategic Analysis For Profitability Growth Icon Pictures PDF to dispense important information. This template comprises three stages. It also presents valuable insights into the topics including Business Tactical, Analysis, Profitability Growth, Icon. This is a completely customizable PowerPoint theme that can be put to use immediately. So, download it and address the topic impactfully.

Vendor Selection And Evaluation Techniques Magnifying Glass Ppt Summary Example Topics PDF
Make sure to capture your audiences attention in your business displays with our gratis customizable Vendor Selection And Evaluation Techniques Magnifying Glass Ppt Summary Example Topics PDF. These are great for business strategies, office conferences, capital raising or task suggestions. If you desire to acquire more customers for your tech business and ensure they stay satisfied, create your own sales presentation with these plain slides.

Conducting Monetary Inclusion With Mobile Financial Services Why We Need Rules PDF
Presenting Conducting Monetary Inclusion With Mobile Financial Services Why We Need Rules PDF to provide visual cues and insights. Share and navigate important information on one stage that need your due attention. This template can be used to pitch topics like Highly Adaptable, Increase Retention, Reduce Churn. In addtion, this PPT design contains high resolution images, graphics, etc, that are easily editable and available for immediate download.

Comprehensive Analysis Of Different Data Lineage Classification Typical Use Cases Of Data Lineage Themes PDF
This slide outlines the typical use cases of data lineage that include performing root cause analysis, generating reports, deprecating columns, and setting data retention policies. Data lineage enables a broad range of information use applications for IT departments and various stakeholder groups. Make sure to capture your audiences attention in your business displays with our gratis customizable Comprehensive Analysis Of Different Data Lineage Classification Typical Use Cases Of Data Lineage Themes PDF. These are great for business strategies, office conferences, capital raising or task suggestions. If you desire to acquire more customers for your tech business and ensure they stay satisfied, create your own sales presentation with these plain slides.

Financial Tactical And Strategic Analysis Planning Icon Ideas PDF
Persuade your audience using this Financial Tactical And Strategic Analysis Planning Icon Ideas PDF. This PPT design covers three stages, thus making it a great tool to use. It also caters to a variety of topics including Financial Analysis, Tactical Planning, Icon. Download this PPT design now to present a convincing pitch that not only emphasizes the topic but also showcases your presentation skills.
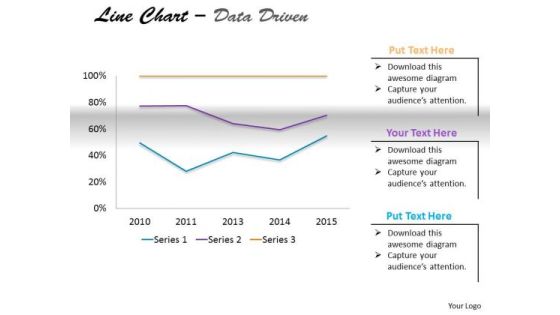
Multivariate Data Analysis Driven Market Line Chart PowerPoint Slides Templates
Delight Them With Our multivariate data analysis driven market line chart powerpoint slides Templates .

Traditional Financial Budgeting And Assessment Kpis For Businesses Infographics PDF
This slide represents the key performance indicators set by the financial planning and analysis team for their business. The indicators includes working capital, operating cash flow, return on equity, current ratio, accounts receivable and payable turnover. Presenting Traditional Financial Budgeting And Assessment Kpis For Businesses Infographics PDF to dispense important information. This template comprises six stages. It also presents valuable insights into the topics including Working Capital, Operating Cash Flow, Current Ratio. This is a completely customizable PowerPoint theme that can be put to use immediately. So, download it and address the topic impactfully.
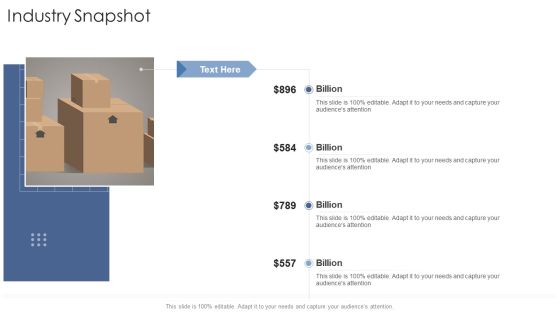
Industry Snapshot Billion Startup Business Strategy Ppt Pictures Images PDF
Presenting industry snapshot billion startup business strategy ppt pictures images pdf to provide visual cues and insights. Share and navigate important information on four stages that need your due attention. This template can be used to pitch topics like industry snapshot. In addtion, this PPT design contains high resolution images, graphics, etc, that are easily editable and available for immediate download.
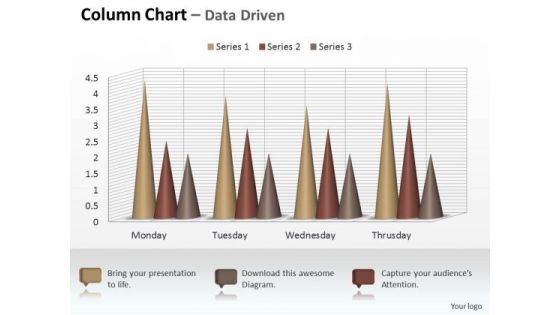
Marketing Data Analysis 3d Sets Of Column Chart PowerPoint Templates
Your Listeners Will Never Doodle. Our marketing data analysis 3d sets of column chart Powerpoint Templates Will Hold Their Concentration.
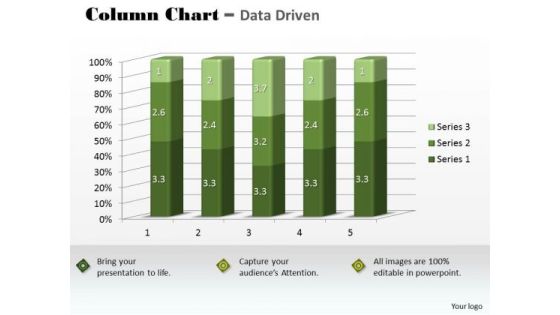
Marketing Data Analysis 3d Statistical Quality Control Chart PowerPoint Templates
Our marketing data analysis 3d statistical quality control chart Powerpoint Templates Abhor Doodling. They Never Let The Interest Flag.

Real Estate Market Snapshot Ppt PowerPoint Presentation Outline Visuals
This is a real estate market snapshot ppt powerpoint presentation outline visuals. This is a two stage process. The stages in this process are homes sold, average home price, january.

Data Analysis Template Forex Market Bar Chart PowerPoint Templates
Attract A Crowd With Our data analysis template forex market bar chart Powerpoint Templates . They Will Drop It All And Come To Hear You.

Examples Of Data Analysis Market 3d Categories Sets PowerPoint Templates
Our examples of data analysis market 3d categories sets Powerpoint Templates Give Your Thoughts Their Due. They Project Them With Full Intensity.
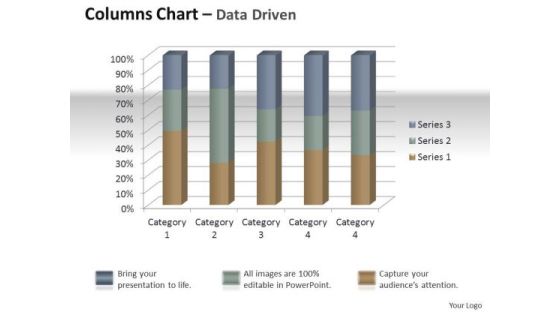
Marketing Data Analysis 3d Quality Control Of Units PowerPoint Templates
Establish Your Dominion With Our marketing data analysis 3d quality control of units Powerpoint Templates . Rule The Stage With Your Thoughts.
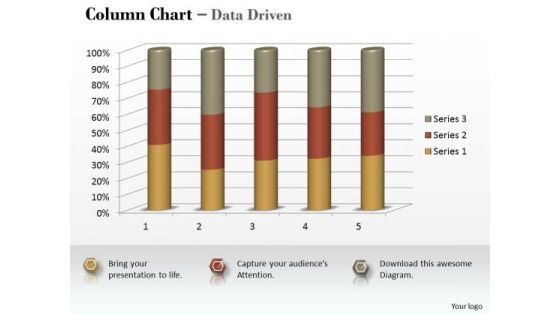
Marketing Data Analysis 3d Statistical Process Column Chart PowerPoint Templates
Be A Donor Of Great Ideas. Display Your Charity On Our marketing data analysis 3d statistical process column chart Powerpoint Templates .

Marketing Data Analysis 3d Statistical Process Control Chart PowerPoint Templates
Open Up Doors That Lead To Success. Our marketing data analysis 3d statistical process control chart Powerpoint Templates Provide The Handles.
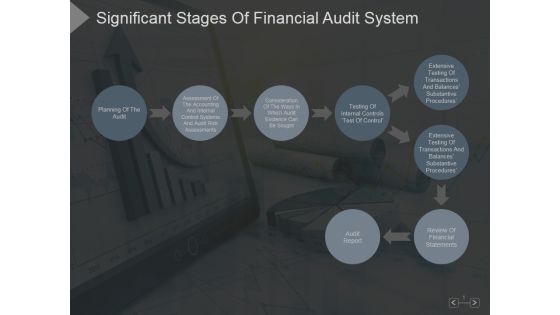
Significant Stages Of Financial Audit System Ppt PowerPoint Presentation Backgrounds
This is a significant stages of financial audit system ppt powerpoint presentation backgrounds. This is a eight stage process. The stages in this process are planning of the audit, audit report, review of financial statements, testing of internal controls.
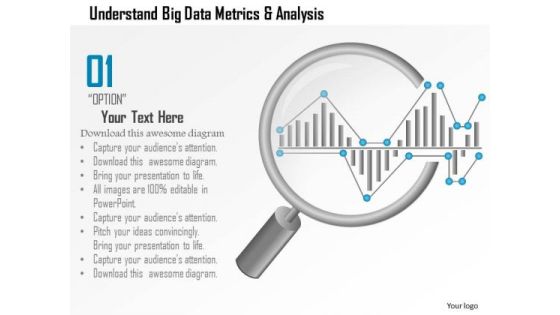
Business Diagram Understand Big Data Metrics And Analysis Showing By Magnifying Glass Ppt Slide
This PPT slide has been designed with big data metrics and magnifying glass. This diagram helps to portray concept of data analysis and data search. Download this diagram to make professional presentations.
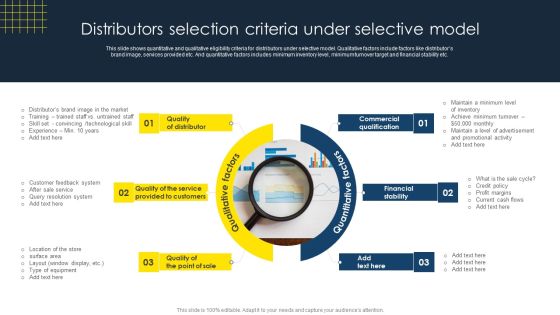
Optimize Business Sales Distributors Selection Criteria Under Selective Model Structure PDF
This slide shows quantitative and qualitative eligibility criteria for distributors under selective model. Qualitative factors include factors like distributors brand image, services provided etc. And quantitative factors includes minimum inventory level, minimum turnover target and financial stability etc. This Optimize Business Sales Distributors Selection Criteria Under Selective Model Structure PDF from Slidegeeks makes it easy to present information on your topic with precision. It provides customization options, so you can make changes to the colors, design, graphics, or any other component to create a unique layout. It is also available for immediate download, so you can begin using it right away. Slidegeeks has done good research to ensure that you have everything you need to make your presentation stand out. Make a name out there for a brilliant performance.

Monthly Financial Planning And Budgeting Process Ppt PowerPoint Presentation Visuals
This is a monthly financial planning and budgeting process ppt powerpoint presentation visuals. This is a six stage process. The stages in this process are growth, finance, development, financial development, economic growth, data analysis.

Banking Solutions Company Overview Snapshot Of Subsidiary Companies Portrait PDF
The slide highlights the snapshot of subsidiaries companies showcasing company name, incorporation year, company shareholding, market capitalization, total assets and CSR spending. Deliver and pitch your topic in the best possible manner with this Banking Solutions Company Overview Snapshot Of Subsidiary Companies Portrait PDF. Use them to share invaluable insights on Abc Financial Securities, Abc International Banking, Abc Life Insurance and impress your audience. This template can be altered and modified as per your expectations. So, grab it now.
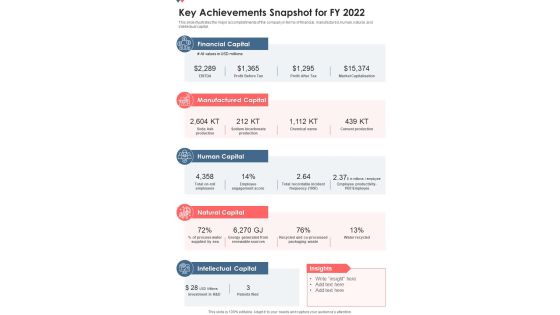
Key Achievements Snapshot For FY 2022 One Pager Documents
This slide illustrates the major accomplishments of the company in terms of financial, manufactured, human, natural, and intellectual capital. Presenting you a fantastic Key Achievements Snapshot For FY 2022 One Pager Documents. This piece is crafted on hours of research and professional design efforts to ensure you have the best resource. It is completely editable and its design allow you to rehash its elements to suit your needs. Get this Key Achievements Snapshot For FY 2022 One Pager Documents A4 One-pager now.
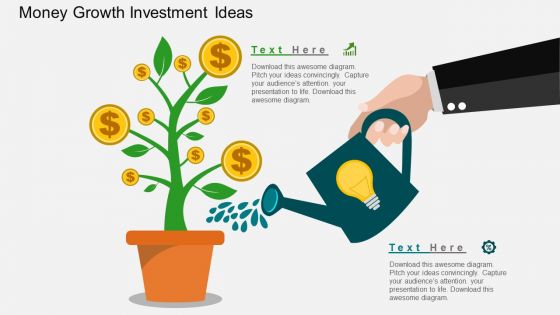
Money Growth Investment Ideas PowerPoint Template
Above is the creatively designed PPT slide which you can use to explain that how the idea of investment can lead to the money growth. This template also help you explain to your colleagues that how different ideas if put together can lead to the betterment of the company or the growth of the company. There are icons present in the template as well which are easily editable. You can choose the color, text and icon of your choice as per your requirement. Use this slide in your presentation and leave great impression on your audience.

Illustration Of Save Money Concept Powerpoint Templates
This business slide has been designed with infographic square. These text boxes can be used for data representation. Use this diagram for your business presentations. Build a quality presentation for your viewers with this unique diagram.

Key Steps In Financial Planning Process Ppt Slide Show
This is a key steps in financial planning process ppt slide show. This is a six stage process. The stages in this process are review and report, implement the plan, create and present solution in a plan, define the relationship, gather data and agree goals, analysis and evaluation, the financial planning process.

Financial Data Analysis Driven Compare Market Share Of Brand PowerPoint Templates
Doll Up Your Thoughts With Our financial data analysis driven compare market share of brand Powerpoint Templates . They Will Make A Pretty Picture.

Financial Data Analysis For Risk Management Ppt PowerPoint Presentation Slides Picture
Presenting this set of slides with name financial data analysis for risk management ppt powerpoint presentation slides picture. This is a one stage process. The stages in this process are risk framework, risk management, planning process. This is a completely editable PowerPoint presentation and is available for immediate download. Download now and impress your audience.
Key Financial Ratios Template 2 Ppt PowerPoint Presentation Icon Professional
This is a key financial ratios template 2 ppt powerpoint presentation icon professional. This is a four stage process. The stages in this process are business, marketing, analysis, finance, search.

Quantitative Data Analysis Driven Economic Status Line Chart PowerPoint Slides Templates
Be The Dramatist With Our quantitative data analysis driven economic status line chart powerpoint slides Templates . Script Out The Play Of Words.

Quantitative Data Analysis Driven Economic With Column Chart PowerPoint Slides Templates
Add Some Dramatization To Your Thoughts. Our quantitative data analysis driven economic with column chart powerpoint slides Templates Make Useful Props.

Income Statement Kpis Ppt PowerPoint Presentation Styles Clipart Images
This is a income statement kpis ppt powerpoint presentation styles clipart images. This is a four stage process. The stages in this process are net sales, other income, total income, expenses, total material consumed.
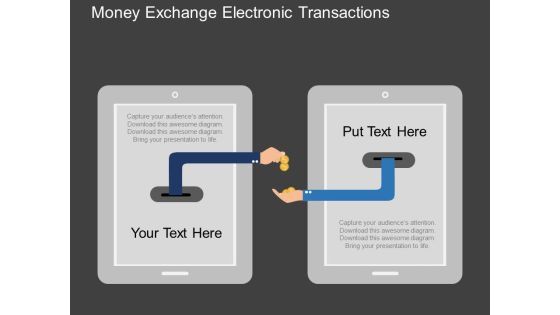
Money Exchange Electronic Transactions Powerpoint Templates
Our above slide contains illustration of money exchange. It helps to display electronic transactions. Use this diagram to impart more clarity to data and to create more sound impact on viewers.

Budgetary Trends Of Social Media Mobile And Analytics Infographics PDF
This slide shows companys share of marketing budget allocated. The areas covered in this are social media, mobile and analytics.Showcasing this set of slides titled Budgetary Trends Of Social Media Mobile And Analytics Infographics PDF. The topics addressed in these templates are Growth Budget, Changes Can, Analytics Budget. All the content presented in this PPT design is completely editable. Download it and make adjustments in color, background, font etc. as per your unique business setting.
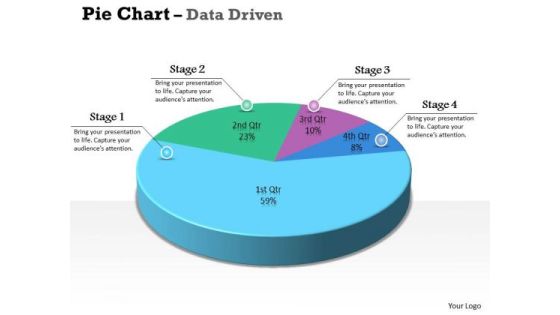
Data Analysis Excel 3d Pie Chart For Marketing Process PowerPoint Templates
Our data analysis excel 3d pie chart for marketing process Powerpoint Templates Team Are A Dogged Lot. They Keep At It Till They Get It Right.
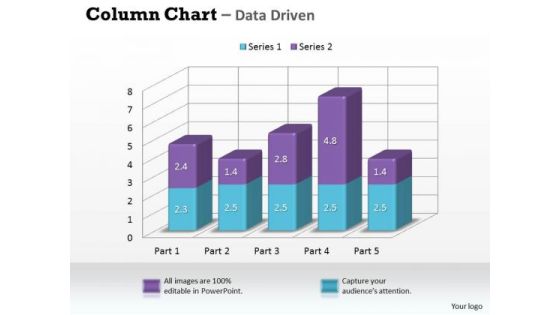
Data Analysis In Excel 3d Column Chart For Market Surveys PowerPoint Templates
Our data analysis in excel 3d column chart for market surveys Powerpoint Templates Leave No One In Doubt. Provide A Certainty To Your Views.

Data Analysis Programs 3d Bar Chart For Market Surveys PowerPoint Templates
Draw On The Experience Of Our data analysis programs 3d bar chart for market surveys Powerpoint Templates . They Imbibe From Past Masters.
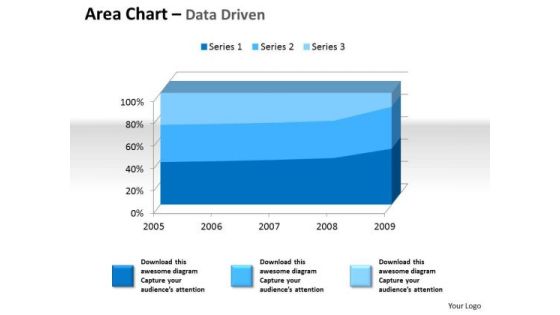
Examples Of Data Analysis Market 3d Area Chart For Quantiative PowerPoint Templates
Drum It Up With Our examples of data analysis market 3d area chart for quantiative Powerpoint Templates . Your Thoughts Will Raise The Tempo.
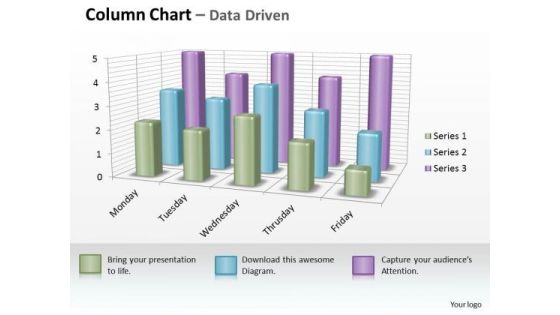
Examples Of Data Analysis Market 3d Business Inspection Procedure Chart PowerPoint Templates
However Dry Your Topic Maybe. Make It Catchy With Our examples of data analysis market 3d business inspection procedure chart Powerpoint Templates .

Examples Of Data Analysis Market 3d Business Intelligence And PowerPoint Templates
Our examples of data analysis market 3d business intelligence and Powerpoint Templates Are Dual Purpose. They Help Instruct And Inform At The Same Time.
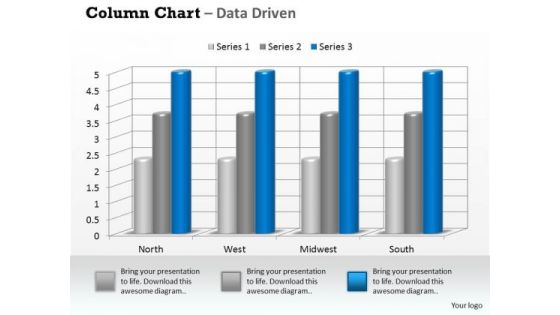
Examples Of Data Analysis Market 3d Business On Regular Intervals PowerPoint Templates
Drum It Out Loud And Clear On Our examples of data analysis market 3d business on regular intervals Powerpoint Templates . Your Words Will Ring In Their Ears.

Examples Of Data Analysis Market Driven Plotting The Business Values PowerPoint Slides Templates
Ring The Duck With Our examples of data analysis market driven plotting the business values powerpoint slides Templates . Acquire The Points With Your Ideas.

Examples Of Data Analysis Market Driven Radar Chart To Compare PowerPoint Slides Templates
Rely On Our examples of data analysis market driven radar chart to compare powerpoint slides Templates In Any Duel. They Will Drive Home Your Point.
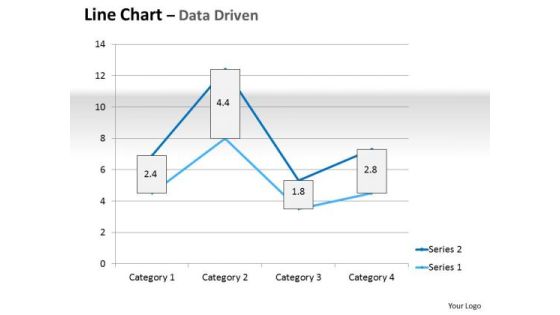
Multivariate Data Analysis Driven Line Chart Market Graph PowerPoint Slides Templates
Plan For All Contingencies With Our multivariate data analysis driven line chart market graph powerpoint slides Templates . Douse The Fire Before It Catches.

How Much Money We Need Ppt PowerPoint Presentation Outline
This is a how much money we need ppt powerpoint presentation outline. This is a three stage process. The stages in this process are business, marketing, management, production, sales.

Data Analysis On Excel Driven Stock Chart For Market History PowerPoint Slides Templates
Draw Out The Best In You With Our data analysis on excel driven stock chart for market history powerpoint slides Templates . Let Your Inner Brilliance Come To The Surface.
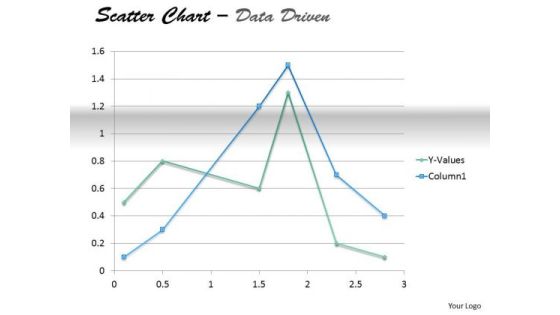
Examples Of Data Analysis Market Driven Present In Scatter Chart PowerPoint Slides Templates
Your Thoughts Will Take To Our examples of data analysis market driven present in scatter chart powerpoint slides Templates Like A Duck To Water. They Develop A Binding Affinity.

Report On Budgetary Allocation For Market Expansion Rules PDF
This slide consists of an annual expenditure report formulated for companies wanting to expand their market overseas and prepare a budget for the same. The major cost allocations are in research and development, regulatory expenses, travel and relocation etc. Showcasing this set of slides titled Report On Budgetary Allocation For Market Expansion Rules PDF. The topics addressed in these templates are Regulatory Expenses, Development, Market Testing. All the content presented in this PPT design is completely editable. Download it and make adjustments in color, background, font etc. as per your unique business setting.

Digital Transformation Purpose And Key Performance Indicators Formats PDF
The slide shows a pie chart presenting objectives of conducting digital advancement in organization with KPIs. It includes KPIs like user satisfaction, economic, productive, trader control metrics, risk metrics, saving goals and advancements. Pitch your topic with ease and precision using this Digital Transformation Purpose And Key Performance Indicators Formats PDF. This layout presents information on Key Performance Indicators, Digital Transformation, Minimize Costs. It is also available for immediate download and adjustment. So, changes can be made in the color, design, graphics or any other component to create a unique layout.

Investment Summary Snapshot With Funds Strategy And Actions Mockup PDF
This slide showcases portfolio of investor that provide information on holdings and performance of portfolio. It includes fund name, initial allocation, investment amount, weighted average, latest price , market value and profit or loss. Pitch your topic with ease and precision using this Investment Summary Snapshot With Funds Strategy And Actions Mockup PDF. This layout presents information on Portfolio Funds, Risk Debt Fund, Growth Fund. It is also available for immediate download and adjustment. So, changes can be made in the color, design, graphics or any other component to create a unique layout.

Magnifying Glass For Sales Performance Review Ppt PowerPoint Presentation Model
This is a magnifying glass for sales performance review ppt powerpoint presentation model. This is a four stage process. The stage in this process are magnifier glass, pie, finance, percentage, research.

Financial Analysis Model Powerpoint Slide Show
This is a financial analysis model powerpoint slide show. This is a four stage process. The stages in this process are dollar, symbol, business, marketing, finance.

Business Diagram 3d Thumb Chart And Tablet For Data Representation PowerPoint Slide
This business diagram displays graphic of 3d thumb up chart with icons on computer screen. This business slide contains the concept of business data representation. Use this diagram to build professional presentations for your viewers.
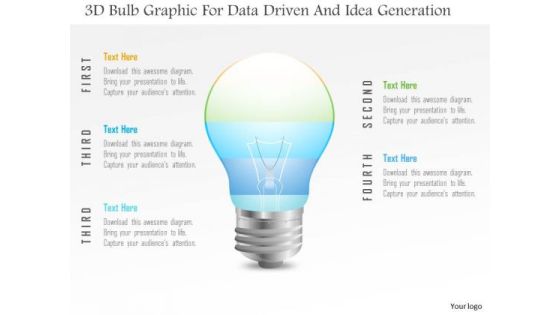
Business Diagram 3d Bulb Graphic For Data Driven And Idea Generation PowerPoint Slide
This Power Point template has been designed with 3d bulb graphic. Use this slide to represent technology idea and strategy concepts. Download this diagram for your business presentations and get exclusive comments on your efforts.
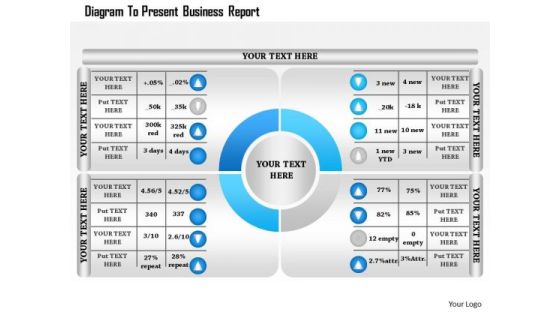
Business Diagram To Present Business Report Presentation Template
Four staged percentage personalized chart has been used to craft this power point template. This PPT contains the concept of data analysis and financial result analysis. This PPT can be used for your data and finance related topics in any business and marketing presentation.

Business Profit Statistical Analysis Presentation Background Images
This is a business profit statistical analysis presentation background images. This is a five stage process. The stages in this process are collection of data, organization of data, interpretation of data, calculate results, analyze results.

Commercial Bank Financial Services Company Profile Snapshot Of Subsidiary Companies Portrait PDF
The slide highlights the snapshot of subsidiaries companies showcasing company name, incorporation year, company shareholding, market capitalization, total assets and CSR spending. Deliver and pitch your topic in the best possible manner with this Commercial Bank Financial Services Company Profile Snapshot Of Subsidiary Companies Portrait PDF. Use them to share invaluable insights on Asset Management, Financial Securities, Home Finances, Business Finances and impress your audience. This template can be altered and modified as per your expectations. So, grab it now.

Competitive Environment Analysis Ppt Images
This is a competitive environment analysis ppt images. This is a four stage process. The stages in this process are engagement, brand, monthly, weekly, x, y.
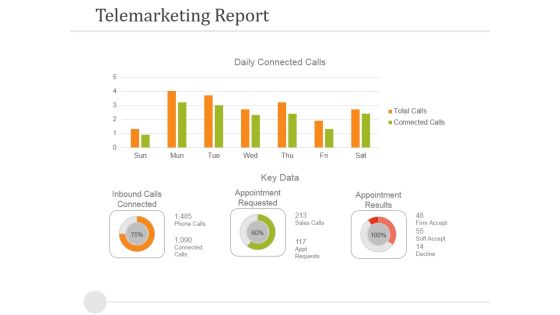
Telemarketing Report Template 1 Ppt PowerPoint Presentation Model Model
This is a telemarketing report template 1 ppt powerpoint presentation model model. This is a two stage process. The stages in this process are inbound calls connected, appointment requested, appointment results, key data.
Manufacturing Economics Vector Icon Ppt PowerPoint Presentation Show Sample PDF
Presenting this set of slides with name manufacturing economics vector icon ppt powerpoint presentation show sample pdf. This is a three stage process. The stages in this process are manufacturing economics vector icon. This is a completely editable PowerPoint presentation and is available for immediate download. Download now and impress your audience.

Business Intelligence Financial Reporting Ppt PowerPoint Presentation Layouts Model
This is a business intelligence financial reporting ppt powerpoint presentation layouts model. This is a four stage process. The stages in this process are business analytics, ba, organizations data.

Tips To Improve Data Reporting Procedure Structure PDF
This slide mentions the steps involved in improving financial reporting systems in organizations. It includes normalizing data, organizing information, single sourcing data, collaboration and reviewing. Persuade your audience using this Tips To Improve Data Reporting Procedure Structure PDF. This PPT design covers five stages, thus making it a great tool to use. It also caters to a variety of topics including Organize Information, Single Source Data, Collaboration. Download this PPT design now to present a convincing pitch that not only emphasizes the topic but also showcases your presentation skills.
Financial Data Representation Ppt PowerPoint Presentation Rules
This is a financial data representation ppt powerpoint presentation rules. This is a five stage process. The stages in this process are financial, data, representation, marketing, management, business.
Business Man Draws Financial Data For Analysis PowerPoint Templates
This PowerPoint slide has a theme for financial data analysis. This image has been designed to display concept of financial planning and analysis. Deliver amazing presentations to mesmerize your audience using this image

Data Analysis 8 Stages Ppt Business Plans For Non Profit Organizations PowerPoint Templates
We present our data analysis 8 stages ppt business plans for non profit organizations PowerPoint templates.Present our Process and Flows PowerPoint Templates because Our PowerPoint Templates and Slides will definately Enhance the stature of your presentation. Adorn the beauty of your thoughts with their colourful backgrounds. Present our Circle Charts PowerPoint Templates because you can Set pulses racing with our PowerPoint Templates and Slides. They will raise the expectations of your team. Download our Business PowerPoint Templates because Our PowerPoint Templates and Slides will let you Leave a lasting impression to your audiences. They possess an inherent longstanding recall factor. Use our Spheres PowerPoint Templates because our PowerPoint Templates and Slides are the string of your bow. Fire of your ideas and conquer the podium. Use our Shapes PowerPoint Templates because Our PowerPoint Templates and Slides are effectively colour coded to prioritise your plans They automatically highlight the sequence of events you desire.Use these PowerPoint slides for presentations relating to Design, isolated, statistics, model, statement, interface, business, vector, presentation, glossy, internet, diagram, circle,brochure, description, report, marketing, level, abstract, steps, illustration, pie, chart, sphere, registry, catalog, section, futuristic, web, text,information,eight space, demonstration, navigation, pattern, structure, multiple. The prominent colors used in the PowerPoint template are Green, Gray, Black.
Business Diagram Hour Glass With 3d Man And Icons PowerPoint Slide
This diagram displays 3d man with hour glass and icons. This diagram contains concept of communication and technology. Use this diagram to display business process workflows in any presentations.

Engineering Services Company Valuation Ratios Engineering Company Financial Analysis Report Brochure PDF
The following slide highlights the valuation ratio of the engineering company to assess the organizations worth on the basis of share price, sales, and market capitalization, Key ratios included are enterprise value, EV per net sales, price to book value, market cap per sales, retention ratio and earnings yield. The Engineering Services Company Valuation Ratios Engineering Company Financial Analysis Report Brochure PDF is a compilation of the most recent design trends as a series of slides. It is suitable for any subject or industry presentation, containing attractive visuals and photo spots for businesses to clearly express their messages. This template contains a variety of slides for the user to input data, such as structures to contrast two elements, bullet points, and slides for written information. Slidegeeks is prepared to create an impression.

Formulating Money Laundering Tms And Data Analytics Process Flow Sample PDF
This slide represents transaction monitoring system process flow. It provides information about data analytics, risk framework, alerting, ad hoc analysis, case management, external source entrance, stop list, politically exposed persons PEP, watch list, etc. Do you have to make sure that everyone on your team knows about any specific topic I yes, then you should give Formulating Money Laundering Tms And Data Analytics Process Flow Sample PDF a try. Our experts have put a lot of knowledge and effort into creating this impeccable Formulating Money Laundering Tms And Data Analytics Process Flow Sample PDF. You can use this template for your upcoming presentations, as the slides are perfect to represent even the tiniest detail. You can download these templates from the Slidegeeks website and these are easy to edit. So grab these today.
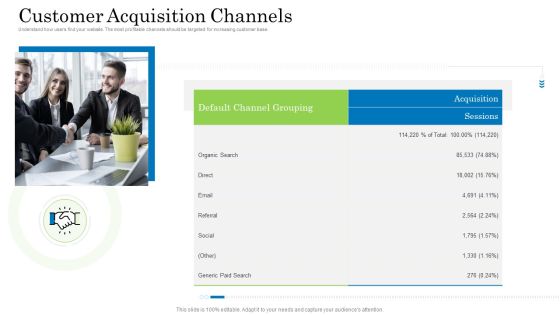
Customer Behavioral Data And Analytics Customer Acquisition Channels Formats PDF
Understand how users find your website. The most profitable channels should be targeted for increasing customer base. Presenting customer behavioral data and analytics customer acquisition channels formats pdf to provide visual cues and insights. Share and navigate important information on one stages that need your due attention. This template can be used to pitch topics like direct, organic search, email, referral, social. In addtion, this PPT design contains high resolution images, graphics, etc, that are easily editable and available for immediate download.

Multivariate Data Analysis Numeric Values Surface Chart PowerPoint Templates
Your Grasp Of Economics Is Well Known. Help Your Audience Comprehend Issues With Our multivariate data analysis numeric values surface chart Powerpoint Templates .

Company Financial Accounting Key Performance Indicators Ppt Slides PDF
This slide shows the key metrics of finance used in every organization. It includes profitability, liquidity, leverage, efficiency and valuation ratios. Presenting Company Financial Accounting Key Performance Indicators Ppt Slides PDF to dispense important information. This template comprises five stages. It also presents valuable insights into the topics including Profitability, Liquidity, Leverage. This is a completely customizable PowerPoint theme that can be put to use immediately. So, download it and address the topic impactfully.
Ways Manufacturing Data Analysis Increases Productivity And Profitability Template PDF
Persuade your audience using this Ways Manufacturing Data Analysis Increases Productivity And Profitability Template PDF. This PPT design covers four stages, thus making it a great tool to use. It also caters to a variety of topics including Increases Productivity, Manufacturing Data, Profitability. Download this PPT design now to present a convincing pitch that not only emphasizes the topic but also showcases your presentation skills.
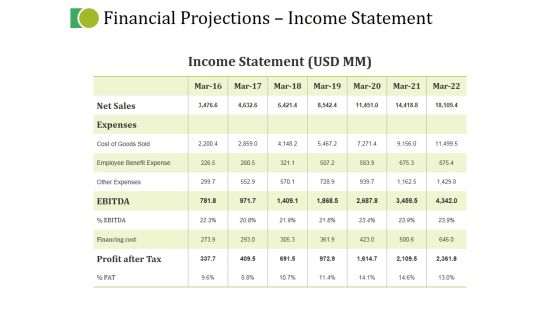
Financial Projections Income Statement Ppt PowerPoint Presentation Portfolio Infographic Template
This is a financial projections income statement ppt powerpoint presentation portfolio infographic template. This is a seven stage process. The stages in this process are trade payables, current liabilities, total liabilities, total fixed assets, inventories.

Business And Financial Analysis Ppt PowerPoint Presentation Portfolio Templates
This is a business and financial analysis ppt powerpoint presentation portfolio templates. This is a four stage process. The stages in this process are investment, tables, data analysis, marketing, equipment.

Data Analysis Ppt Diagram Powerpoint Templates Download
This is a data analysis ppt diagram powerpoint templates download. This is a five stage process. The stages in this process are management support, supervisor support, monetary support, present, analyze.
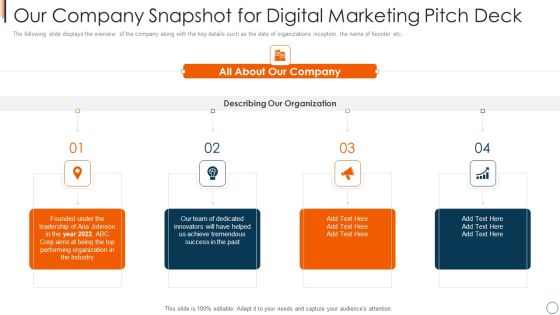
Online Advertising Service Investor Capital Raising Our Company Snapshot For Digital Marketing Pitch Deck Guidelines PDF
The following slide displays the overview of the company along with the key details such as the date of organizations inception, the name of founder etc. This is a online advertising service investor capital raising our company snapshot for digital marketing pitch deck guidelines pdf template with various stages. Focus and dispense information on four stages using this creative set, that comes with editable features. It contains large content boxes to add your information on topics like organization, industry, innovators. You can also showcase facts, figures, and other relevant content using this PPT layout. Grab it now.
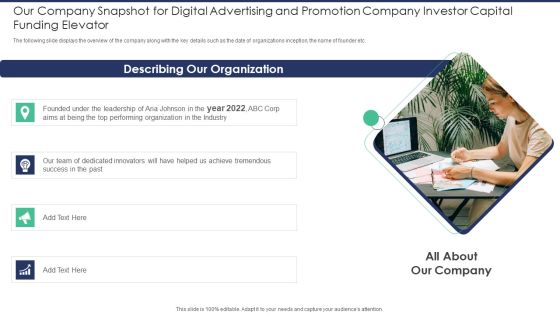
Our Company Snapshot For Digital Advertising And Promotion Company Investor Capital Portrait PDF
The following slide displays the overview of the company along with the key details such as the date of organizations inception, the name of founder etc. This is a our company snapshot for digital advertising and promotion company investor capital portrait pdf template with various stages. Focus and dispense information on four stages using this creative set, that comes with editable features. It contains large content boxes to add your information on topics like our team, dedicated innovators, performing organization, leadership. You can also showcase facts, figures, and other relevant content using this PPT layout. Grab it now.

Comparative Analysis Of Data Driven Marketing Tools Ppt Summary Slide Download PDF
This slide represents the comparison between varied data driven marketing tools based on their key attributes to help marketers choose the best tool for optimizing their marketing strategy. It includes comparison based on features such as marketing attribution, real-time reporting etc. Make sure to capture your audiences attention in your business displays with our gratis customizable Comparative Analysis Of Data Driven Marketing Tools Ppt Summary Slide Download PDF. These are great for business strategies, office conferences, capital raising or task suggestions. If you desire to acquire more customers for your tech business and ensure they stay satisfied, create your own sales presentation with these plain slides.

Comparative Analysis Of Data Driven Marketing Tools Ppt Gallery Guidelines PDF
This slide represents the comparison between varied data driven marketing tools based on their key attributes to help marketers choose the best tool for optimizing their marketing strategy. It includes comparison based on features such as marketing attribution, real-time reporting etc. Make sure to capture your audiences attention in your business displays with our gratis customizable Comparative Analysis Of Data Driven Marketing Tools Ppt Gallery Guidelines PDF. These are great for business strategies, office conferences, capital raising or task suggestions. If you desire to acquire more customers for your tech business and ensure they stay satisfied, create your own sales presentation with these plain slides.
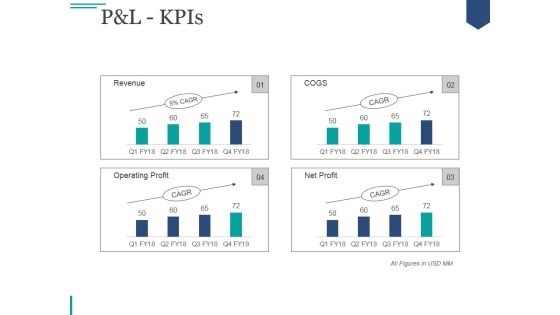
Pandl Kpis Ppt PowerPoint Presentation Deck
This is a pandl kpis ppt powerpoint presentation deck. This is a four stage process. The stages in this process are net sales, other income, total income, expenses, total material consumed.

Pandl Kpis Ppt PowerPoint Presentation Gallery Slides
This is a pandl kpis ppt powerpoint presentation gallery slides. This is a four stage process. The stages in this process are net sales, other income, total income, expenses, total material consumed.

Pandl Kpis Ppt PowerPoint Presentation Professional Show
This is a pandl kpis ppt powerpoint presentation professional show. This is a four stage process. The stages in this process are other income, total income, expenses, total material consumed, employee benefit expense.
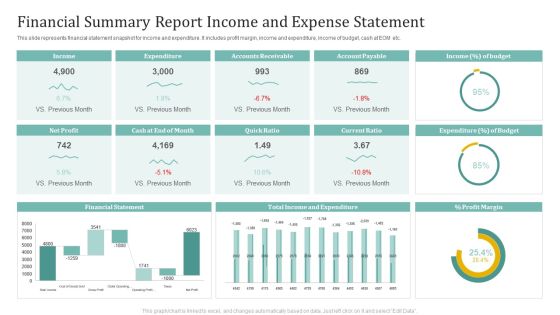
Financial Summary Report Income And Expense Statement Ppt File Background Designs PDF
This slide represents financial statement snapshot for income and expenditure. It includes profit margin, income and expenditure, income of budget, cash at EOM etc. Showcasing this set of slides titled Financial Summary Report Income And Expense Statement Ppt File Background Designs PDF. The topics addressed in these templates are Income, Expenditure, Accounts Receivable, Account Payable. All the content presented in this PPT design is completely editable. Download it and make adjustments in color, background, font etc. as per your unique business setting.

Business And Financial Analysis Ppt PowerPoint Presentation Layouts Portrait
This is a business and financial analysis ppt powerpoint presentation layouts portrait. This is a three stage process. The stages in this process are equipment, land cost, interior cost, employee cost, marketing cost.

Business Financial Data Assessment Report Ppt PowerPoint Presentation File Format Ideas PDF
Pitch your topic with ease and precision using this business financial data assessment report ppt powerpoint presentation file format ideas pdf. This layout presents information on business financial data assessment report. It is also available for immediate download and adjustment. So, changes can be made in the color, design, graphics or any other component to create a unique layout.
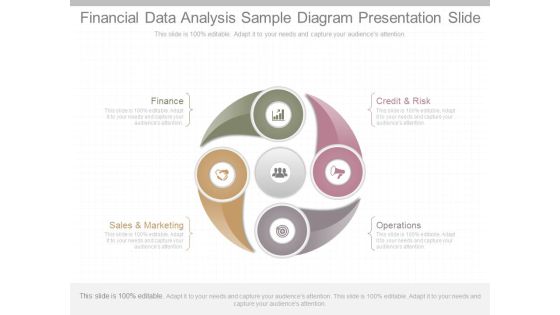
Financial Data Analysis Sample Diagram Presentation Slide
This is a financial data analysis sample diagram presentation slide. This is a four stage process. The stages in this process are finance, sales and marketing, operations, credit and risk.
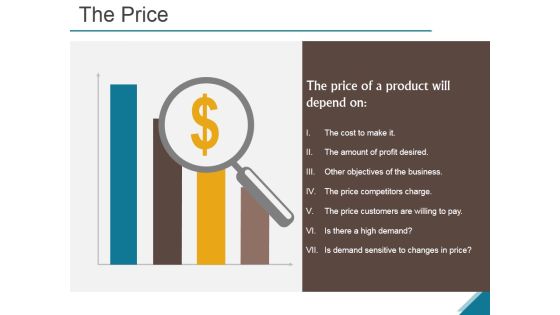
The Price Ppt PowerPoint Presentation Summary
This is a the price ppt powerpoint presentation summary. This is a four stage process. The stages in this process are the cost to make it, the amount of profit desired, other objectives of the business, the price competitors charge, the price customers are willing to pay, is there a high demand.

Data Analysis In Excel Area Chart For Business Process PowerPoint Templates
Your Grasp Of Economics Is Well Known. Help Your Audience Comprehend Issues With Our data analysis in excel area chart for business process Powerpoint Templates .

Addressable Market In Sector 1 Ppt PowerPoint Presentation Outline Shapes
This is a addressable market in sector 1 ppt powerpoint presentation outline shapes. This is a two stage process. The stages in this process are fossil fuels, nuclear, bioenergy, biofuels.
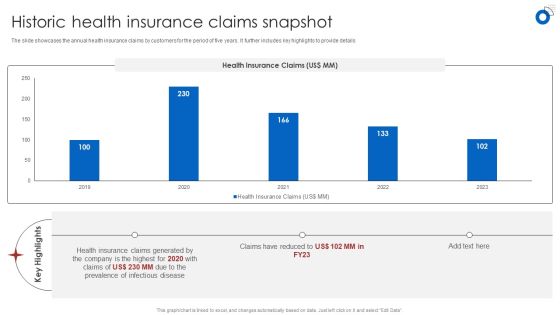
Insurance Business Financial Analysis Historic Health Insurance Claims Snapshot Diagrams PDF
The slide showcases the annual health insurance claims by customers for the period of five years. It further includes key highlights to provide details Boost your pitch with our creative Insurance Business Financial Analysis Historic Health Insurance Claims Snapshot Diagrams PDF. Deliver an awe-inspiring pitch that will mesmerize everyone. Using these presentation templates you will surely catch everyones attention. You can browse the ppts collection on our website. We have researchers who are experts at creating the right content for the templates. So you dont have to invest time in any additional work. Just grab the template now and use them.

Financial Growth Ppt PowerPoint Presentation Layout
This is a financial growth ppt powerpoint presentation layout. This is a three stage process. The stages in this process are business, marketing, finance, percentage, growth.
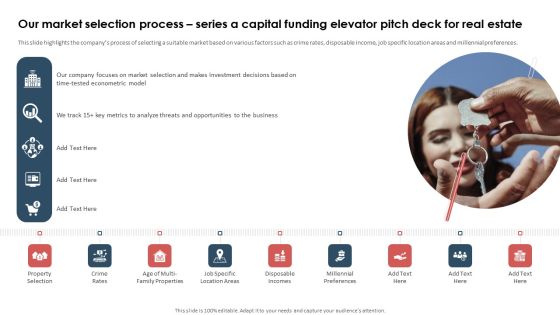
Our Market Selection Process Series A Capital Funding Elevator Pitch Deck For Real Estate Professional PDF
This slide highlights the companys process of selecting a suitable market based on various factors such as crime rates, disposable income, job specific location areas and millennial preferences. Here you can discover an assortment of the finest PowerPoint and Google Slides templates. With these templates, you can create presentations for a variety of purposes while simultaneously providing your audience with an eye-catching visual experience. Download Our Market Selection Process Series A Capital Funding Elevator Pitch Deck For Real Estate Professional PDF to deliver an impeccable presentation. These templates will make your job of preparing presentations much quicker, yet still, maintain a high level of quality. Slidegeeks has experienced researchers who prepare these templates and write high-quality content for you. Later on, you can personalize the content by editing the Our Market Selection Process Series A Capital Funding Elevator Pitch Deck For Real Estate Professional PDF.
Real Estate Development Real Estate Market Snapshot Price Ppt PowerPoint Presentation Show Icon PDF
Presenting this set of slides with name real estate development real estate market snapshot price ppt powerpoint presentation show icon pdf. This is a four stage process. The stages in this process are average asking price, average sold price, average days market, homes sale, size available. This is a completely editable PowerPoint presentation and is available for immediate download. Download now and impress your audience.
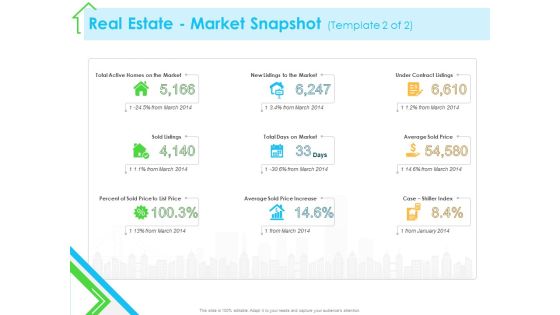
Real Estate Development Real Estate Market Snapshot Sale Ppt PowerPoint Presentation Infographics Deck PDF
Presenting this set of slides with name real estate development real estate market snapshot sale ppt powerpoint presentation infographics deck pdf. This is a nine stage process. The stages in this process are total active homes market, new listings market, under contract listings, sold listings, total days market, average sold price, percent sold price to list price, average sold price increase, case shiller index. This is a completely editable PowerPoint presentation and is available for immediate download. Download now and impress your audience.
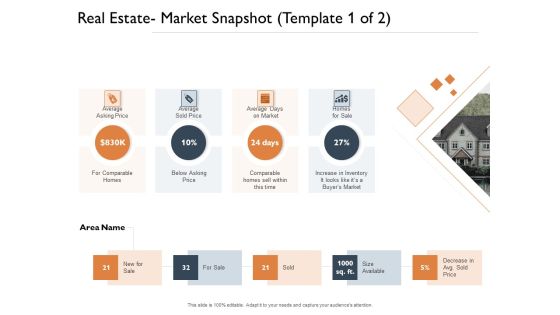
Freehold Property Business Plan Real Estate Market Snapshot Ppt PowerPoint Presentation Show Design Templates PDF
Presenting this set of slides with name freehold property business plan real estate market snapshot ppt powerpoint presentation show design templates pdf. This is a four stage process. The stages in this process are average asking price, average sold price, average days market, homes sale, size available. This is a completely editable PowerPoint presentation and is available for immediate download. Download now and impress your audience.
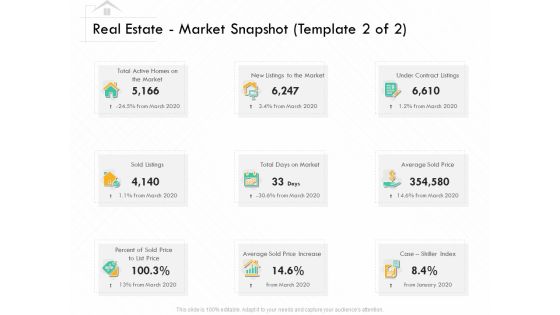
Selling Home Property Real Estate Market Snapshot Price Ppt Pictures Aids PDF
Presenting selling home property real estate market snapshot price ppt pictures aids pdf to provide visual cues and insights. Share and navigate important information on nine stages that need your due attention. This template can be used to pitch topics like market, price, case, increase. In addtion, this PPT design contains high resolution images, graphics, etc, that are easily editable and available for immediate download.
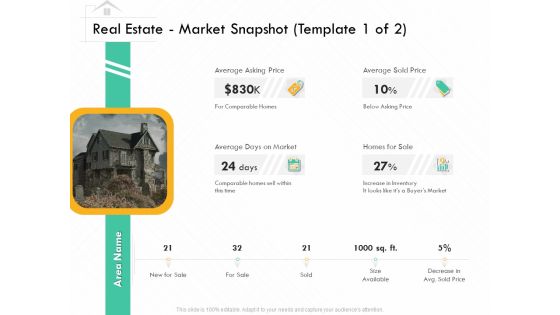
Selling Home Property Real Estate Market Snapshot Average Ppt Portfolio Good PDF
This is a selling home property real estate market snapshot average ppt portfolio good pdf template with various stages. Focus and dispense information on four stages using this creative set, that comes with editable features. It contains large content boxes to add your information on topics like price, market, sale. You can also showcase facts, figures, and other relevant content using this PPT layout. Grab it now.
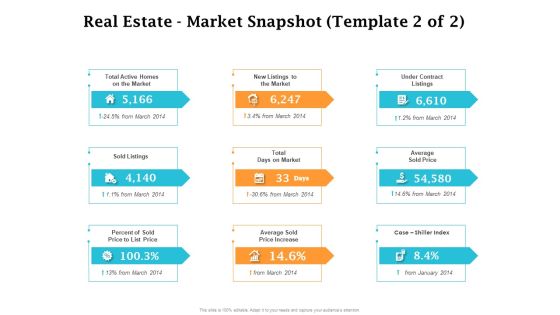
Real Estate Asset Management Real Estate Market Snapshot Price Ppt Infographic Template Templates PDF
This is a real estate asset management real estate market snapshot price ppt infographic template templates pdf template with various stages. Focus and dispense information on nine stages using this creative set, that comes with editable features. It contains large content boxes to add your information on topics like price, market, sold listings, average sold price increase. You can also showcase facts, figures, and other relevant content using this PPT layout. Grab it now.

Real Property Strategic Plan Real Estate Market Snapshot Price Ppt Pictures Design Inspiration PDF
This is a real property strategic plan real estate market snapshot price ppt pictures design inspiration pdf template with various stages. Focus and dispense information on nine stages using this creative set, that comes with editable features. It contains large content boxes to add your information on topics like price, market, sold listings, average sold price increase. You can also showcase facts, figures, and other relevant content using this PPT layout. Grab it now.

Market Research Analysis Of Housing Sector Real Estate Market Snapshot Price Formats PDF
This is a market research analysis of housing sector real estate market snapshot price formats pdf template with various stages. Focus and dispense information on nine stages using this creative set, that comes with editable features. It contains large content boxes to add your information on topics like price, market, sold listings, average sold price increase. You can also showcase facts, figures, and other relevant content using this PPT layout. Grab it now.
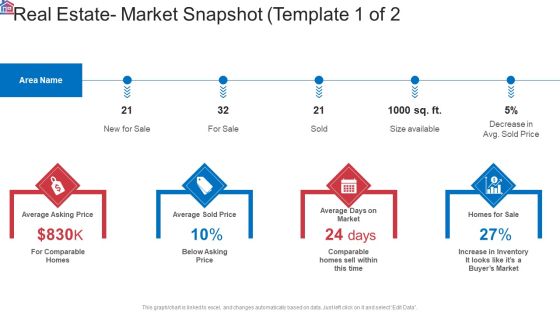
Market Research Analysis Of Housing Sector Real Estate Market Snapshot Average Ppt Outline Example File PDF
Presenting market research analysis of housing sector real estate market snapshot average ppt outline example file pdf to provide visual cues and insights. Share and navigate important information on four stages that need your due attention. This template can be used to pitch topics like sale, market, inventory, price. In addtion, this PPT design contains high resolution images, graphics, etc, that are easily editable and available for immediate download.
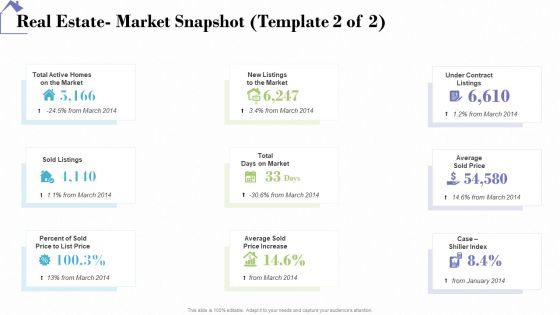
Industry Analysis Of Real Estate And Construction Sector Real Estate Market Snapshot Price Designs PDF
This is a industry analysis of real estate and construction sector real estate market snapshot price designs pdf template with various stages. Focus and dispense information on nine stages using this creative set, that comes with editable features. It contains large content boxes to add your information on topics like price, market, sold listings, average sold price increase. You can also showcase facts, figures, and other relevant content using this PPT layout. Grab it now.


