Revenue Dashboard
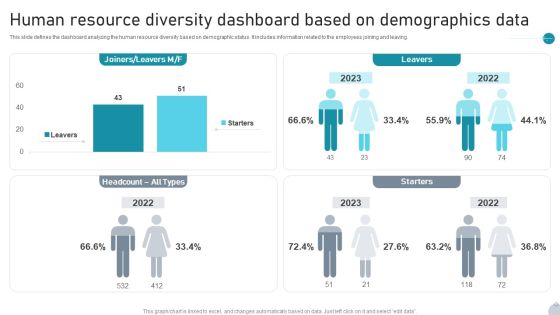
Human Resource Diversity Dashboard Based On Demographics Data Rules PDF
This slide defines the dashboard analyzing the human resource diversity based on demographic status. It includes information related to the employees joining and leaving. Pitch your topic with ease and precision using this Human Resource Diversity Dashboard Based On Demographics Data Rules PDF. This layout presents information on Starters, Leavers, Demographics Data It is also available for immediate download and adjustment. So, changes can be made in the color, design, graphics or any other component to create a unique layout.

Employee Demographics Data And Gender Distribution Dashboard Topics PDF
The purpose of this template is to explain the employee demographics and gender distribution dashboard. The slide provides information about distribution, hire and turnover based gender. Showcasing this set of slides titled Employee Demographics Data And Gender Distribution Dashboard Topics PDF. The topics addressed in these templates are Gender Distribution, Turnover By Gender, Hires By Gender All the content presented in this PPT design is completely editable. Download it and make adjustments in color, background, font etc. as per your unique business setting.
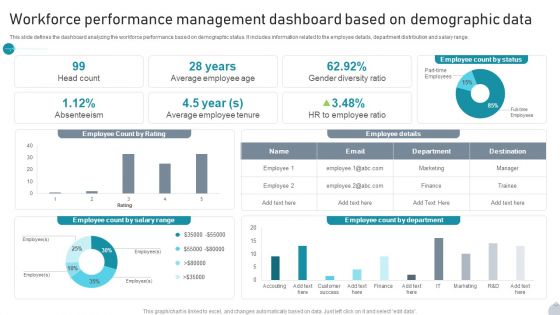
Workforce Performance Management Dashboard Based On Demographic Data Information PDF
This slide defines the dashboard analyzing the workforce performance based on demographic status. It includes information related to the employee details, department distribution and salary range. Showcasing this set of slides titled Workforce Performance Management Dashboard Based On Demographic Data Information PDF. The topics addressed in these templates are Employee Details, Department, Gender Diversity Ratio All the content presented in this PPT design is completely editable. Download it and make adjustments in color, background, font etc. as per your unique business setting.

Texting Platforms Dashboard Indicating SMS Marketing Metrics Designs PDF
This slide showcase messaging platforms dashboard indicating sms marketing metrics which can be referred by businesses to check the activity of their current texting campaign. It contains information about consumers, plan, send, campaigns, growth, reports, outgoing and incoming.Pitch your topic with ease and precision using this texting platforms dashboard indicating sms marketing metrics designs pdf This layout presents information on texting platforms dashboard indicating sms marketing metrics It is also available for immediate download and adjustment. So, changes can be made in the color, design, graphics or any other component to create a unique layout.

Capital Investment Options Project Team Performance Kpi Dashboard Topics PDF
This slide shows a KPI dashboard to monitor project team performance. KPIs covered are task, billable hours, billable cost, days lapsed, milestones achieved. Deliver and pitch your topic in the best possible manner with this Capital Investment Options Project Team Performance Kpi Dashboard Topics PDF. Use them to share invaluable insights on Team Members, Project Manager, Employee and impress your audience. This template can be altered and modified as per your expectations. So, grab it now.

Capital Investment Options Vendor Compliance Kpi Dashboard Designs PDF
Mentioned slide displays vendor compliance KPI dashboard. KPIs covered are top supplier by partner status, average procurement cycle time and average procurement cycle. Deliver an awe inspiring pitch with this creative Capital Investment Options Vendor Compliance Kpi Dashboard Designs PDF bundle. Topics like Average Procurement, Cycle Time, Confirmation, Order Placement can be discussed with this completely editable template. It is available for immediate download depending on the needs and requirements of the user.

Retail Outlet Dashboard With Sales Kpis Clipart PDF
This slide covers a metrics dashboard for tracking retail store sales. It includes KPIs such as sales square foot per location, net profit, revues, shrinkage, customer retention rate, etc. Pitch your topic with ease and precision using this retail outlet dashboard with sales kpis clipart pdf This layout presents information on Retail outlet dashboard with sales kpis It is also available for immediate download and adjustment. So, changes can be made in the color, design, graphics or any other component to create a unique layout.
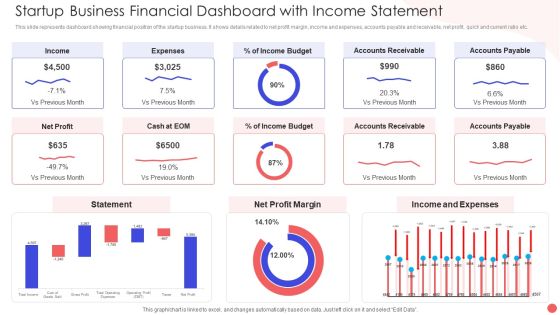
Startup Business Financial Dashboard With Income Statement Portrait PDF
This slide represents dashboard showing financial position of the startup business. It shows details related to net profit margin, income and expenses, accounts payable and receivable, net profit, quick and current ratio etc. Showcasing this set of slides titled Startup Business Financial Dashboard With Income Statement Portrait PDF. The topics addressed in these templates are Accounts Receivable Income, Income And Expenses, Net Profit Margin. All the content presented in this PPT design is completely editable. Download it and make adjustments in color, background, font etc. as per your unique business setting.
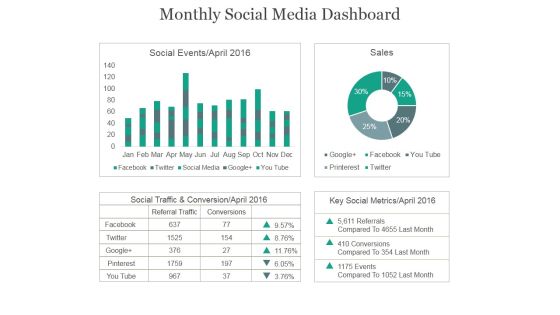
Monthly Social Media Dashboard Ppt PowerPoint Presentation Example 2015
This is a monthly social media dashboard ppt powerpoint presentation example 2015. This is a four stage process. The stages in this process are social events, sales, social traffic, conservation, key social metrics.
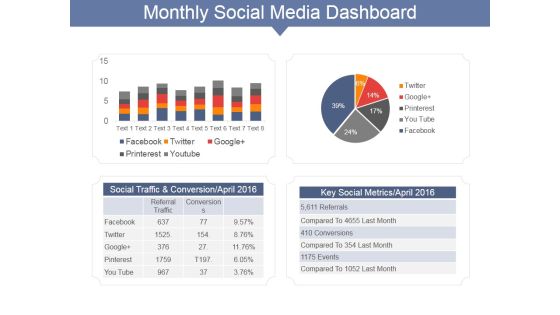
Monthly Social Media Dashboard Ppt PowerPoint Presentation Gallery Show
This is a monthly social media dashboard ppt powerpoint presentation gallery show. This is a two stage process. The stages in this process are social traffic and conversion april, key social metrics april, facebook, twitter.
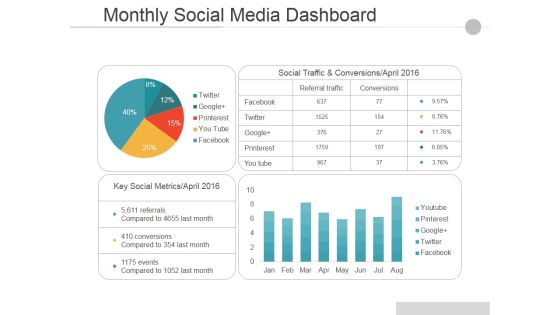
Monthly Social Media Dashboard Ppt PowerPoint Presentation Pictures Guide
This is a monthly social media dashboard ppt powerpoint presentation pictures guide. This is a two stage process. The stages in this process are social traffic and conversions april, key social metrics april, facebook, twitter, google.
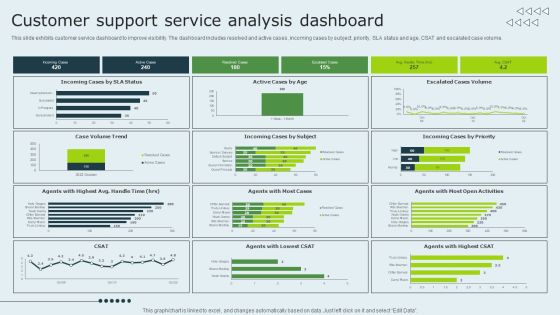
Enhancing Client Experience Customer Support Service Analysis Dashboard Download PDF
This slide exhibits customer service dashboard to improve visibility. The dashboard includes resolved and active cases, incoming cases by subject, priority, SLA status and age, CSAT and escalated case volume. Slidegeeks is one of the best resources for PowerPoint templates. You can download easily and regulate Enhancing Client Experience Customer Support Service Analysis Dashboard Download PDF for your personal presentations from our wonderful collection. A few clicks is all it takes to discover and get the most relevant and appropriate templates. Use our Templates to add a unique zing and appeal to your presentation and meetings. All the slides are easy to edit and you can use them even for advertisement purposes.
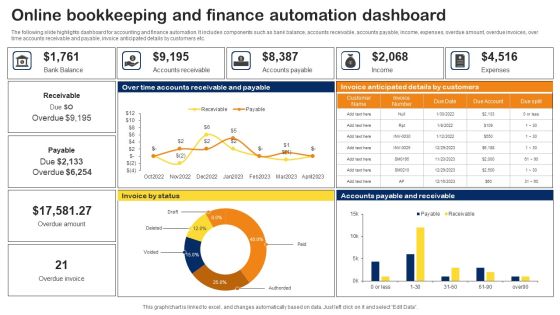
Online Bookkeeping And Finance Automation Dashboard Topics PDF
The following slide highlights dashboard for accounting and finance automation. It includes components such as bank balance, accounts receivable, accounts payable, income, expenses, overdue amount, overdue invoices, over time accounts receivable and payable, invoice anticipated details by customers etc. Pitch your topic with ease and precision using this Online Bookkeeping And Finance Automation Dashboard Topics PDF. This layout presents information on Online Bookkeeping, Finance Automation Dashboard. It is also available for immediate download and adjustment. So, changes can be made in the color, design, graphics or any other component to create a unique layout.
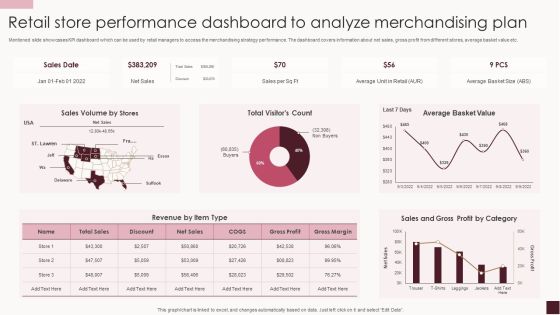
Retail Store Performance Dashboard To Analyze Merchandising Plan Structure PDF
Mentioned slide showcases KPI dashboard which can be used by retail managers to access the merchandising strategy performance. The dashboard covers information about net sales, gross profit from different stores, average basket value etc.Showcasing this set of slides titled Retail Store Performance Dashboard To Analyze Merchandising Plan Structure PDF. The topics addressed in these templates are Sales Volume, Average Basket, Gross Profit. All the content presented in this PPT design is completely editable. Download it and make adjustments in color, background, font etc. as per your unique business setting.

Cash Flow Dashboard Company Performance Evaluation Using KPI Formats PDF
Following slide covers cash flow dashboard covering details like beginning cash on hand, cash going in, cash going out, profit loss and ending cash on hand. It also includes detail of accounts receivable and payable. Deliver an awe inspiring pitch with this creative Cash Flow Dashboard Company Performance Evaluation Using KPI Formats PDF bundle. Topics like Beginning Cash, Profit, Cash Flow Dashboard can be discussed with this completely editable template. It is available for immediate download depending on the needs and requirements of the user.

Dashboard Indicating Online Store Accounts Overview Introduction PDF
The following slide showcases ecommerce accounts management dashboard. It provides information about income, expenses, cash collected, cash spent, tax collected, tax claim, stock sold, invoice, etc. Presenting this PowerPoint presentation, titled Dashboard Indicating Online Store Accounts Overview Introduction PDF, with topics curated by our researchers after extensive research. This editable presentation is available for immediate download and provides attractive features when used. Download now and captivate your audience. Presenting this Dashboard Indicating Online Store Accounts Overview Introduction PDF. Our researchers have carefully researched and created these slides with all aspects taken into consideration. This is a completely customizable Dashboard Indicating Online Store Accounts Overview Introduction PDF that is available for immediate downloading. Download now and make an impact on your audience. Highlight the attractive features available with our PPTs.
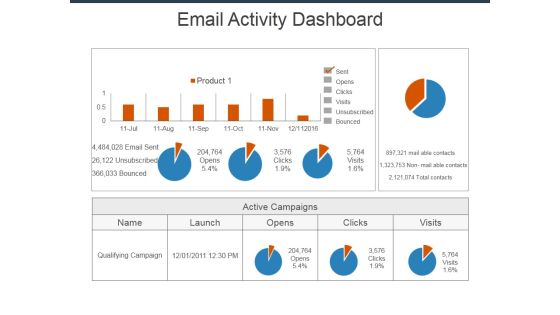
Email Activity Dashboard Ppt Powerpoint Presentation Styles Summary
This is a email activity dashboard ppt powerpoint presentation styles summary. This is a three stage process. The stages in this process are sent, opens, clicks, visits, unsubscribed, bounced, qualifying campaign.

Financial Balance Sheet Dashboard Ppt PowerPoint Presentation Background Image
This is a financial balance sheet dashboard ppt powerpoint presentation background image. This is a two stage process. The stages in this process are current assets, cash, inventory, prepaid expenses, total assets.
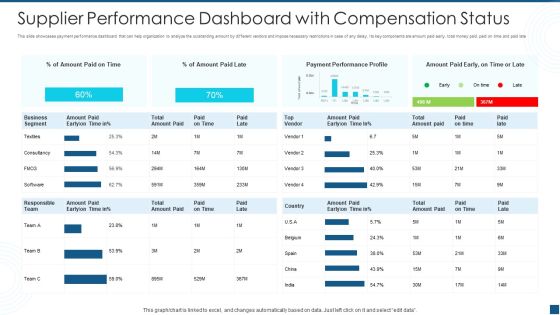
Supplier Performance Dashboard With Compensation Status Themes PDF
This slide showcases payment performance dashboard that can help organization to analyze the outstanding amount by different vendors and impose necessary restrictions in case of any delay. Its key components are amount paid early, total money paid, paid on time and paid late. Pitch your topic with ease and precision using this supplier performance dashboard with compensation status themes pdf. This layout presents information on supplier performance dashboard with compensation status. It is also available for immediate download and adjustment. So, changes can be made in the color, design, graphics or any other component to create a unique layout.
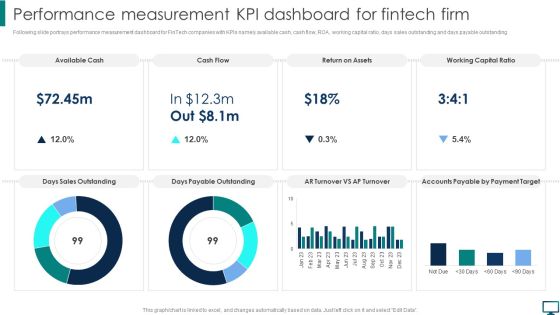
Performance Measurement KPI Dashboard For Fintech Firm Topics PDF
Following slide portrays performance measurement dashboard for FinTech companies with KPIs namely available cash, cash flow, ROA, working capital ratio, days sales outstanding and days payable outstanding. Create an editable Performance Measurement KPI Dashboard For Fintech Firm Topics PDF that communicates your idea and engages your audience. Whether you are presenting a business or an educational presentation, pre designed presentation templates help save time. Performance Measurement KPI Dashboard For Fintech Firm Topics PDF is highly customizable and very easy to edit, covering many different styles from creative to business presentations. Slidegeeks has creative team members who have crafted amazing templates. So, go and get them without any delay.
Portfolio Tracking Dashboard For Management Procedure Structure PDF
This slide covers portfolio performance tracking KPI dashboard for increasing effectiveness in investment management process. It involves details such as investment, total earning, net profit and monthly portfolio performance.Pitch your topic with ease and precision using this Portfolio Tracking Dashboard For Management Procedure Structure PDF This layout presents information on Investment, Total Earning, Portfolio Performance It is also available for immediate download and adjustment. So, changes can be made in the color, design, graphics or any other component to create a unique layout.
Key Business Metrics Dashboard Ppt Powerpoint Presentation Icon Graphics Design
This is a key business metrics dashboard ppt powerpoint presentation icon graphics design. This is a five stage process. The stages in this process are finance, marketing, management, investment, analysis.

Pharmaceutical Sales Project Periodically Performance Dashboard Brochure PDF
The following slide highlights the pharmaceutical sales project quarterly performance dashboard illustrating sales by area, prescribed drugs sale , non prescribed drugs sale, prescribed drugs performance, quarterly sales by condition, quarterly sales and profit by channel Showcasing this set of slides titled pharmaceutical sales project periodically performance dashboard brochure pdf. The topics addressed in these templates are pharmaceutical sales project periodically performance dashboard. All the content presented in this PPT design is completely editable. Download it and make adjustments in color, background, font etc. as per your unique business setting.

Power Plant Energy Consumption And Monitoring Dashboard Diagrams PDF
The slide showcases dashboard it helps energy suppliers to cover fast-changing market demands, analyse and optimize production costs as well as to increase the overall profitability in the long-run. It covers energy consumption by sector, production costs, energy sources, contribution to renewable energy, sales, number of power cuts and average duration. Pitch your topic with ease and precision using this Power Plant Energy Consumption And Monitoring Dashboard Diagrams PDF. This layout presents information on Power Plant Energy Consumption, Monitoring Dashboard. It is also available for immediate download and adjustment. So, changes can be made in the color, design, graphics or any other component to create a unique layout.
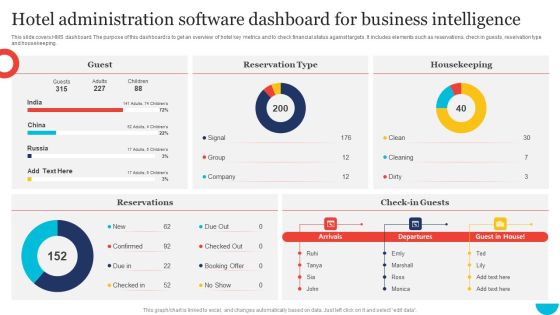
Hotel Administration Software Dashboard For Business Intelligence Infographics PDF
This slide covers HMS dashboard. The purpose of this dashboard is to get an overview of hotel key metrics and to check financial status against targets. It includes elements such as reservations, check in guests, reservation type and housekeeping. Pitch your topic with ease and precision using this Hotel Administration Software Dashboard For Business Intelligence Infographics PDF. This layout presents information on Guest, Housekeeping, Reservation Type. It is also available for immediate download and adjustment. So, changes can be made in the color, design, graphics or any other component to create a unique layout.
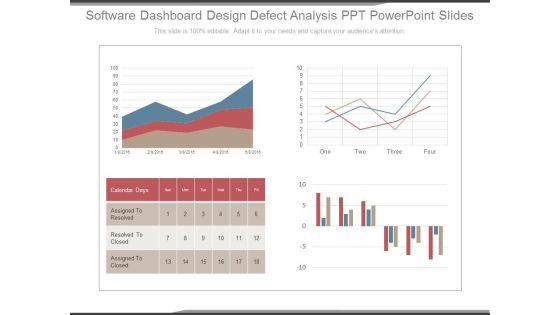
Software Dashboard Design Defect Analysis Ppt Powerpoint Slides
This is a software dashboard design defect analysis ppt powerpoint slides. This is a four stage process. The stages in this process are calendar days, assigned to resolved, resolved to closed, assigned to closed.
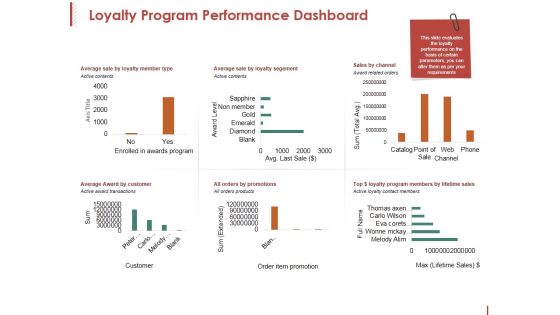
Loyalty Program Performance Dashboard Ppt PowerPoint Presentation Pictures Clipart
This is a loyalty program performance dashboard ppt powerpoint presentation pictures clipart. This is a six stage process. The stages in this process are axis title, award level, sum, active contents, channel.
Software Implementation Project Progress Tracking Dashboard Summary PDF
This slide represents the dashboard to track the progress of software implementation project. It includes details related to health, tasks, project, time, cost and workload of software implementation project. If you are looking for a format to display your unique thoughts, then the professionally designed Software Implementation Project Progress Tracking Dashboard Summary PDF is the one for you. You can use it as a Google Slides template or a PowerPoint template. Incorporate impressive visuals, symbols, images, and other charts. Modify or reorganize the text boxes as you desire. Experiment with shade schemes and font pairings. Alter, share or cooperate with other people on your work. Download Software Implementation Project Progress Tracking Dashboard Summary PDFSoftware Implementation Project Progress Tracking Dashboard Summary PDF and find out how to give a successful presentation. Present a perfect display to your team and make your presentation unforgettable.

Crm Dashboard Opportunity By Rating Ppt PowerPoint Presentation Backgrounds
This is a crm dashboard opportunity by rating ppt powerpoint presentation backgrounds. This is a three stage process. The stages in this process are open opportunity, count all opportunity, rating.

Crm Dashboard Top Customers Ppt PowerPoint Presentation Graphics
This is a crm dashboard top customers ppt powerpoint presentation graphics. This is a ten stage process. The stages in this process are top customers, business, marketing, process, management.
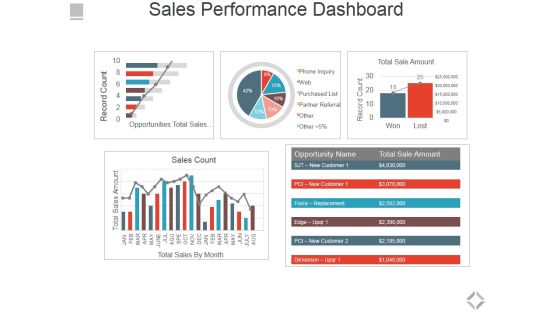
Sales Performance Dashboard Ppt PowerPoint Presentation File Graphics Pictures
This is a sales performance dashboard ppt powerpoint presentation file graphics pictures. This is a five stage process. The stages in this process are total sales by month, sales count, opportunities total sales by probability, total sale amount.

Monthly Social Media Dashboard Ppt PowerPoint Presentation Gallery Templates
This is a monthly social media dashboard ppt powerpoint presentation gallery templates. This is a four stage process. The stages in this process are facebook, twitter, google, pinterest, you tube.

Company Sales And Performance Dashboard Ppt PowerPoint Presentation Slides Grid
This is a company sales and performance dashboard ppt powerpoint presentation slides grid. This is a four stage process. The stages in this process are business, strategy, marketing, finance, analysis.

Crm Dashboard Template Ppt PowerPoint Presentation Gallery Shapes
This is a crm dashboard template ppt powerpoint presentation gallery shapes. This is a four stage process. The stages in this process are open tickets, closed tickets, new orders, new clients.
Determine IT Project Portfolio Management Tracking Dashboard Clipart PDF
This slide provides information regarding IT project portfolio management tracking dashboard including details about allocated budget across portfolios, used budget percentage, estimated vs. actual cost, etc. Deliver an awe inspiring pitch with this creative Determine IT Project Portfolio Management Tracking Dashboard Clipart PDF bundle. Topics like Financials, Estimated Cost Across Portfolios, Actual Cost Across Portfolios can be discussed with this completely editable template. It is available for immediate download depending on the needs and requirements of the user.
Modifying Banking Functionalities Dashboard Tracking Customer Retention Rate Information PDF
This slide contains dashboard that will allow bank to track the retention rate of customer within span of 6 months. Number of accounts that are successfully retained by the bank. It will also bank in tracking accounts that are cancelled. Deliver and pitch your topic in the best possible manner with this enhancing financial institution operations dashboard tracking customer retention rate ideas pdf. Use them to share invaluable insights on dashboard tracking customer retention rate and impress your audience. This template can be altered and modified as per your expectations. So, grab it now.
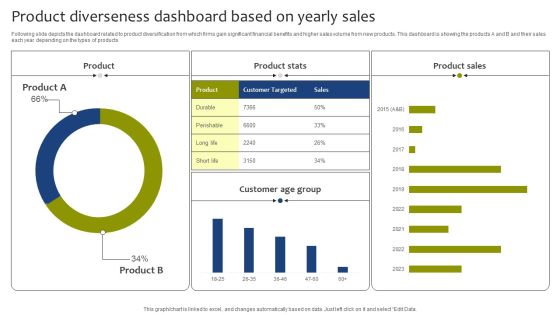
Product Diverseness Dashboard Based On Yearly Sales Graphics PDF
Following slide depicts the dashboard related to product diversification from which firms gain significant financial benefits and higher sales volume from new products. This dashboard is showing the products A and B and their sales each year depending on the types of products. Showcasing this set of slides titled Product Diverseness Dashboard Based On Yearly Sales Graphics PDF. The topics addressed in these templates areProduct Stats, Product Sales, Customer Age Group . All the content presented in this PPT design is completely editable. Download it and make adjustments in color, background, font etc. as per your unique business setting.

Financial Analysis Dashboard Of Corporate Bank Mockup PDF
Following slide outlines the dashboard for financial examination of corporate financial institution which shows how banks managing their cash flow annually Pitch your topic with ease and precision using this Financial Analysis Dashboard Of Corporate Bank Mockup PDF. This layout presents information on Month, Current Ratio, Inventory. It is also available for immediate download and adjustment. So, changes can be made in the color, design, graphics or any other component to create a unique layout.
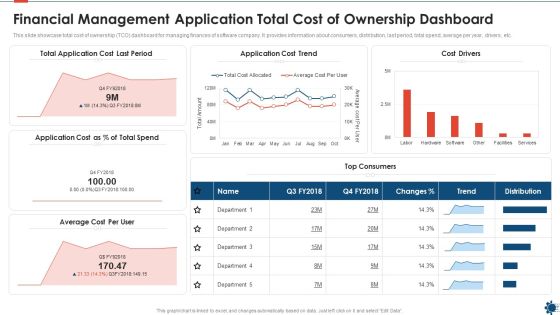
Financial Management Application Total Cost Of Ownership Dashboard Infographics PDF
This slide showcase total cost of ownership TCO dashboard for managing finances of software company. It provides information about consumers, distribution, last period, total spend, average per year, drivers, etc. Showcasing this set of slides titled financial management application total cost of ownership dashboard infographics pdf. The topics addressed in these templates are cost, application. All the content presented in this PPT design is completely editable. Download it and make adjustments in color, background, font etc. as per your unique business setting.
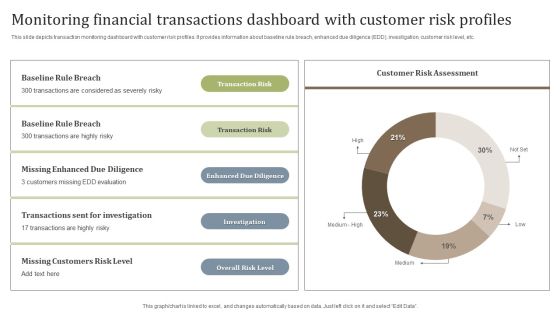
Monitoring Financial Transactions Dashboard With Customer Risk Profiles Diagrams PDF
This slide depicts transaction monitoring dashboard with customer risk profiles. It provides information about baseline rule breach, enhanced due diligence EDD, investigation, customer risk level, etc. Showcasing this set of slides titled Monitoring Financial Transactions Dashboard With Customer Risk Profiles Diagrams PDF. The topics addressed in these templates are Overall Risk Level, Investigation, Enhanced Due Diligence. All the content presented in this PPT design is completely editable. Download it and make adjustments in color, background, font etc. as per your unique business setting.
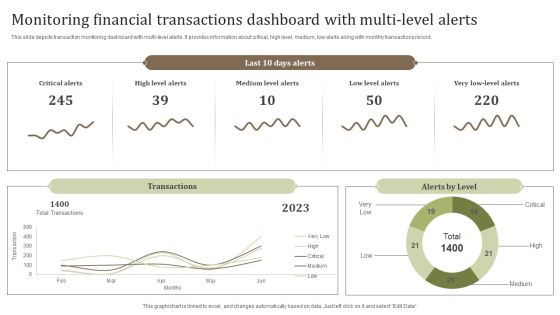
Monitoring Financial Transactions Dashboard With Multi Level Alerts Background PDF
This slide depicts transaction monitoring dashboard with multi-level alerts. It provides information about critical, high level, medium, low alerts along with monthly transactions record. Pitch your topic with ease and precision using this Monitoring Financial Transactions Dashboard With Multi Level Alerts Background PDF. This layout presents information on Critical Alerts, Medium Level Alerts, Total Transactions. It is also available for immediate download and adjustment. So, changes can be made in the color, design, graphics or any other component to create a unique layout.

Web Monitoring Financial Transactions Dashboard With User Events Graphics PDF
This slide depicts web transaction monitoring dashboard with user events. It provides information about availability, page load time, transaction time, downtimes, events, etc.Showcasing this set of slides titled Web Monitoring Financial Transactions Dashboard With User Events Graphics PDF. The topics addressed in these templates are Transaction Time, Events Timeline, Level Agreement. All the content presented in this PPT design is completely editable. Download it and make adjustments in color, background, font etc. as per your unique business setting.
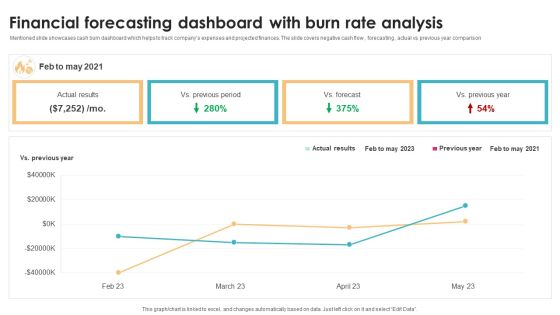
Financial Forecasting Dashboard With Burn Rate Analysis Brochure PDF
Mentioned slide showcases cash burn dashboard which helps to track companys expenses and projected finances. The slide covers negative cash flow , forecasting , actual vs previous year comparison Showcasing this set of slides titled Financial Forecasting Dashboard With Burn Rate Analysis Brochure PDF. The topics addressed in these templates are Previous Year, Analysis, Forecast. All the content presented in this PPT design is completely editable. Download it and make adjustments in color, background, font etc. as per your unique business setting.

Monthly Social Media Dashboard Ppt PowerPoint Presentation Model Slide
This is a monthly social media dashboard ppt powerpoint presentation model slide. This is a four stage process. The stages in this process are sales, social events, business, finance, key social metrics.
Monthly Social Media Dashboard Ppt PowerPoint Presentation Icon Gallery
This is a monthly social media dashboard ppt powerpoint presentation icon gallery. This is a two stage process. The stages in this process are facebook, social traffic and conversion, referral traffic, conversions, key social metrics, pinterest, you tube.
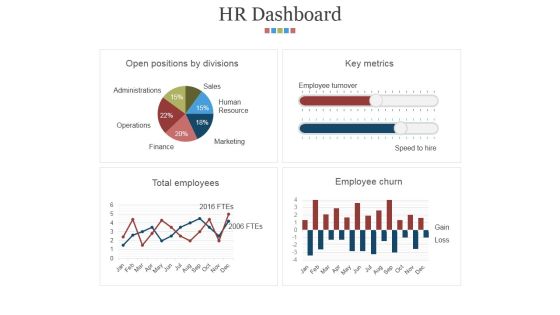
Hr Dashboard Template 2 Ppt PowerPoint Presentation Microsoft
This is a hr dashboard template 2 ppt powerpoint presentation microsoft. This is a four stage process. The stages in this process are open positions by divisions, key metrics, total employees, employee churn.
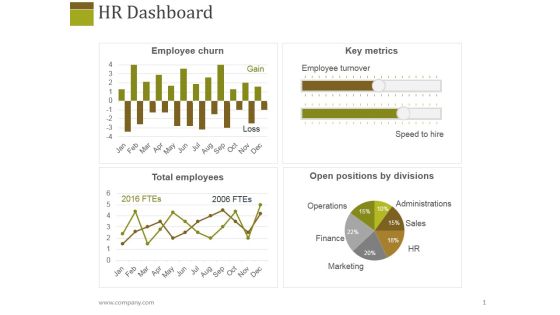
Hr Dashboard Template 1 Ppt PowerPoint Presentation Layouts Slideshow
This is a hr dashboard template 1 ppt powerpoint presentation layouts slideshow. This is a four stage process. The stages in this process are employee churn, key metrics, total employees, open positions by divisions.

Hr Dashboard Template 1 Ppt PowerPoint Presentation Outline Background Images
This is a hr dashboard template 1 ppt powerpoint presentation outline background images. This is a four stage process. The stages in this process are turnover rate, headcount flow, headcount, staffing trends.

Hr Dashboard Template 2 Ppt PowerPoint Presentation Layouts Graphics
This is a hr dashboard template 2 ppt powerpoint presentation layouts graphics. This is a four stage process. The stages in this process are turnover rate, headcount flow, headcount, staffing trends.

Crm Sales Rep Dashboard Ppt PowerPoint Presentation Influencers
This is a crm sales rep dashboard ppt powerpoint presentation influencers. This is a three stage process. The stages in this process are opp duration by pipeline, actual vs goal, opportunities est close next 25 days.

Crm Dashboard Top Customers Ppt PowerPoint Presentation Infographics Format
This is a crm dashboard top customers ppt powerpoint presentation infographics format. This is a ten stage process. The stages in this process are top customers, people, management, business, marketing.
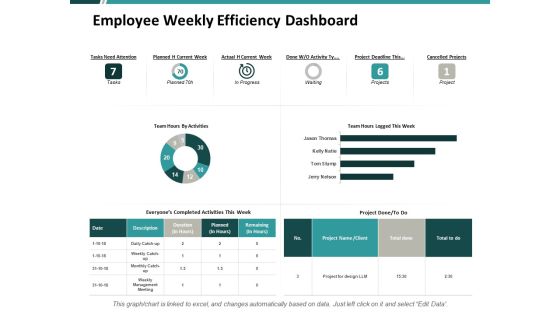
Employee Weekly Efficiency Dashboard Ppt PowerPoint Presentation Portfolio Show
This is a employee weekly efficiency dashboard ppt powerpoint presentation portfolio show. This is a three stage process. The stages in this process are financial, minimum, maximum, marketing, strategy.

Dashboard For Innovative Product Concept Performance In Market Formats PDF
This slide represents dashboard for innovative product performance in market. It includes usage intention, willingness to pay, purchase intention etc. Pitch your topic with ease and precision using this Dashboard For Innovative Product Concept Performance In Market Formats PDF This layout presents information on Usage Intention, Willingess To Pay, Purchase Intention . It is also available for immediate download and adjustment. So, changes can be made in the color, design, graphics or any other component to create a unique layout.

Performance Analysis Dashboard Icon For Email Communication Kpis Introduction PDF
Persuade your audience using this Performance Analysis Dashboard Icon For Email Communication Kpis Introduction PDF. This PPT design covers four stages, thus making it a great tool to use. It also caters to a variety of topics including Performance Analysis, Dashboard Icon, Email Communication, Kpis. Download this PPT design now to present a convincing pitch that not only emphasizes the topic but also showcases your presentation skills.
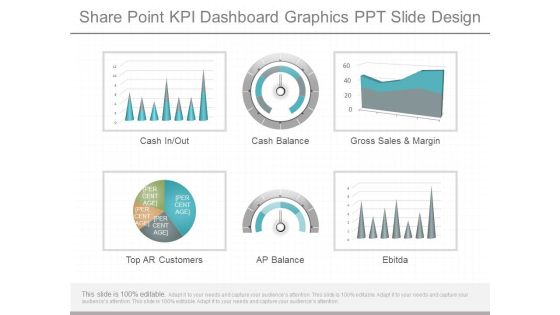
Share Point Kpi Dashboard Graphics Ppt Slide Design
This is a share point kpi dashboard graphics ppt slide design. This is a six stage process. The stages in this process are cash in out, cash balance, gross sales and margin, top ar customers, ap balance, ebitda.

Cpi Spi Dashboard Sample Diagram Powerpoint Slide Designs
This is a cpi spi dashboard sample diagram powerpoint slide designs. This is a four stage process. The stages in this process are cpi spi, performance summary, cost schedule variance, task matrix.

Lead Scoring Lead Nurturing Ideas Dashboard Ppt Sample Download
This is a lead scoring lead nurturing ideas dashboard ppt sample download. This is a four stage process. The stages in this process are adoption of lead scoring solutions chosen, number of dimensions, projects completed, number of scoring rules.

Crm Dashboard Current Lead Status Ppt PowerPoint Presentation Influencers
This is a crm dashboard current lead status ppt powerpoint presentation influencers. This is a five stage process. The stages in this process are new, assigned, process, converted, recycle.
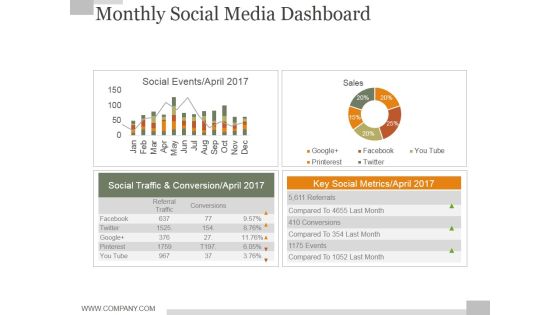
Monthly Social Media Dashboard Ppt PowerPoint Presentation Background Designs
This is a monthly social media dashboard ppt powerpoint presentation background designs. This is a four stage process. The stages in this process are business, finance, marketing, strategy, analysis, success.

Brand Performance Dashboard Template 2 Ppt PowerPoint Presentation Template
This is a brand performance dashboard template 2 ppt powerpoint presentation template. This is a five stage process. The stages in this process are marketing, business, social, icons, management.

 Home
Home