AI PPT Maker
Templates
PPT Bundles
Design Services
Business PPTs
Business Plan
Management
Strategy
Introduction PPT
Roadmap
Self Introduction
Timelines
Process
Marketing
Agenda
Technology
Medical
Startup Business Plan
Cyber Security
Dashboards
SWOT
Proposals
Education
Pitch Deck
Digital Marketing
KPIs
Project Management
Product Management
Artificial Intelligence
Target Market
Communication
Supply Chain
Google Slides
Research Services
 One Pagers
All Categories
-
Home
- Customer Favorites
- Resource Plan
Resource Plan

Kanban Structure To Manage Weekly Work Activities Ppt Professional Aids PDF
This graph or chart is linked to excel, and changes automatically based on data. Just left click on it and select Edit Data. Pitch your topic with ease and precision using this Kanban Structure To Manage Weekly Work Activities Ppt Professional Aids PDF. This layout presents information on Legend, Ready To Start, In Progress. It is also available for immediate download and adjustment. So, changes can be made in the color, design, graphics or any other component to create a unique layout.

Kanban Structure With Process Lead Time Ppt Gallery Template PDF
This graph or chart is linked to excel, and changes automatically based on data. Just left click on it and select Edit Data. Showcasing this set of slides titled Kanban Structure With Process Lead Time Ppt Gallery Template PDF. The topics addressed in these templates are Lead Time, In Realization, Requirements. All the content presented in this PPT design is completely editable. Download it and make adjustments in color, background, font etc. as per your unique business setting.
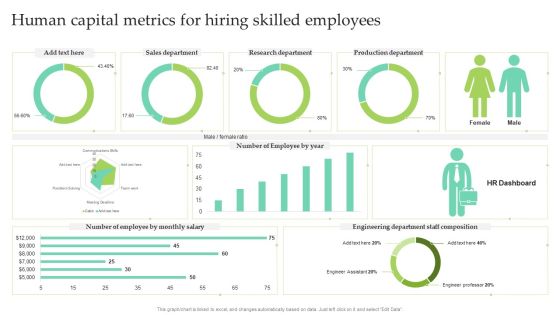
Human Capital Metrics For Hiring Skilled Employees Ppt Slides Themes PDF
This graph or chart is linked to excel, and changes automatically based on data. Just left click on it and select Edit Data. Showcasing this set of slides titled Human Capital Metrics For Hiring Skilled Employees Ppt Slides Themes PDF. The topics addressed in these templates are Sales Department, Research Department, Production Department. All the content presented in this PPT design is completely editable. Download it and make adjustments in color, background, font etc. as per your unique business setting.

Human Capital Metrics For New Hire Ppt Pictures Brochure PDF
This graph or chart is linked to excel, and changes automatically based on data. Just left click on it and select Edit Data. Pitch your topic with ease and precision using this Human Capital Metrics For New Hire Ppt Pictures Brochure PDF. This layout presents information on Active Employee Count, New Hire Count, New Hire. It is also available for immediate download and adjustment. So, changes can be made in the color, design, graphics or any other component to create a unique layout.

Human Capital Metrics For Proper Management Ppt Show Inspiration PDF
This graph or chart is linked to excel, and changes automatically based on data. Just left click on it and select Edit Data. Showcasing this set of slides titled Human Capital Metrics For Proper Management Ppt Show Inspiration PDF. The topics addressed in these templates are Candidates Per Position, Hired Per Source, Location. All the content presented in this PPT design is completely editable. Download it and make adjustments in color, background, font etc. as per your unique business setting.

Human Capital Metrics With Absenteeism Rate Ppt Infographic Template Ideas PDF
This graph or chart is linked to excel, and changes automatically based on data. Just left click on it and select Edit Data. Pitch your topic with ease and precision using this Human Capital Metrics With Absenteeism Rate Ppt Infographic Template Ideas PDF. This layout presents information on Overall Labor Effectiveness, OLE Department, Absenteeism. It is also available for immediate download and adjustment. So, changes can be made in the color, design, graphics or any other component to create a unique layout.
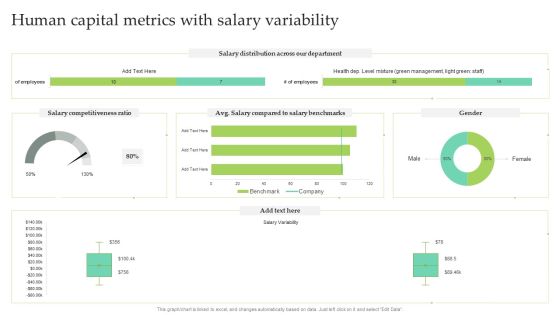
Human Capital Metrics With Salary Variability Ppt Infographic Template Designs PDF
This graph or chart is linked to excel, and changes automatically based on data. Just left click on it and select Edit Data. Pitch your topic with ease and precision using this Human Capital Metrics With Salary Variability Ppt Infographic Template Designs PDF. This layout presents information on Salary Distribution, Salary Competitiveness Ratio, Male. It is also available for immediate download and adjustment. So, changes can be made in the color, design, graphics or any other component to create a unique layout.
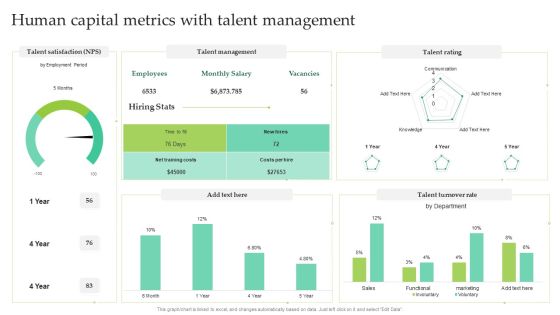
Human Capital Metrics With Talent Management Ppt Layouts Mockup PDF
This graph or chart is linked to excel, and changes automatically based on data. Just left click on it and select Edit Data. Showcasing this set of slides titled Human Capital Metrics With Talent Management Ppt Layouts Mockup PDF. The topics addressed in these templates are Talent Management, Talent Rating, Talent Turnover Rate. All the content presented in this PPT design is completely editable. Download it and make adjustments in color, background, font etc. as per your unique business setting.

Sales Funnel And Leads Performance Monitoring Sheet Ppt Professional Tips PDF
This slide illustrates leads tracking and sales funnel sheet. It provides details such as company, name, status, next action, price, taxes, discounts, total, etc. Showcasing this set of slides titled Sales Funnel And Leads Performance Monitoring Sheet Ppt Professional Tips PDF. The topics addressed in these templates are Sales Funnel Chart, Salesperson, Next Action. All the content presented in this PPT design is completely editable. Download it and make adjustments in color, background, font etc. as per your unique business setting.

Dashboard Depicting Security Problem Management Metrics Ppt Gallery Designs PDF
This graph or chart is linked to excel, and changes automatically based on data. Just left click on it and select Edit Data. Showcasing this set of slides titled Dashboard Depicting Security Problem Management Metrics Ppt Gallery Designs PDF. The topics addressed in these templates are Percentage, New Critical, Security Incidents. All the content presented in this PPT design is completely editable. Download it and make adjustments in color, background, font etc. as per your unique business setting.

Carbon Emission Rate Percentage Stacked Bar Graph Rules PDF
This slide shows emission rate percentage chart comparison of continents to determine lowest emission releasing continents. It includes continents and emission percentage Showcasing this set of slides titled Carbon Emission Rate Percentage Stacked Bar Graph Rules PDF. The topics addressed in these templates are Carbon Emission, Increase In Industrialization, New Manufacturing. All the content presented in this PPT design is completely editable. Download it and make adjustments in color, background, font etc. as per your unique business setting.

Carbon Emissions Of Countries Bar Graph Professional PDF
This slide depicts emissions chart of various countries to avoid the worst impacts of climate change. It includes countries and carbon emissions in million metric tons. Pitch your topic with ease and precision using this Carbon Emissions Of Countries Bar Graph Professional PDF. This layout presents information on Maximum Production, Consumer Goods, Carbon Emissions. It is also available for immediate download and adjustment. So, changes can be made in the color, design, graphics or any other component to create a unique layout.

Global Electric Cars Sales Bar Graph Graphics PDF
This slide shows usage chart of electric cars world over to access present sales and future of EV. It includes years and number of electric cars sales. Showcasing this set of slides titled Global Electric Cars Sales Bar Graph Graphics PDF. The topics addressed in these templates are Electric Vehicle Sales, Electric Cars Purchased, Underdeveloped Technology. All the content presented in this PPT design is completely editable. Download it and make adjustments in color, background, font etc. as per your unique business setting.

Manufacturing Productivity Analysis Bar Graph Introduction PDF
This slide illustrates the productivity chart of manufacturing of a company. It includes quantity produced in million units against the time period. Pitch your topic with ease and precision using this Manufacturing Productivity Analysis Bar Graph Introduction PDF. This layout presents information on Manufacturing Productivity, Production Decreased, Closure Of Companies. It is also available for immediate download and adjustment. So, changes can be made in the color, design, graphics or any other component to create a unique layout.
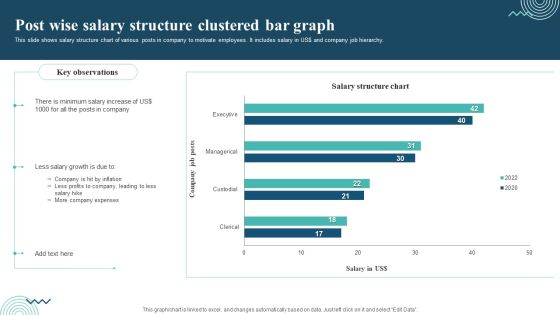
Post Wise Salary Structure Clustered Bar Graph Professional PDF
This slide shows salary structure chart of various posts in company to motivate employees. It includes salary in US dollar and company job hierarchy. Showcasing this set of slides titled Post Wise Salary Structure Clustered Bar Graph Professional PDF. The topics addressed in these templates are Minimum Salary Increase, Less Salary Growth, Company Expenses. All the content presented in this PPT design is completely editable. Download it and make adjustments in color, background, font etc. as per your unique business setting.
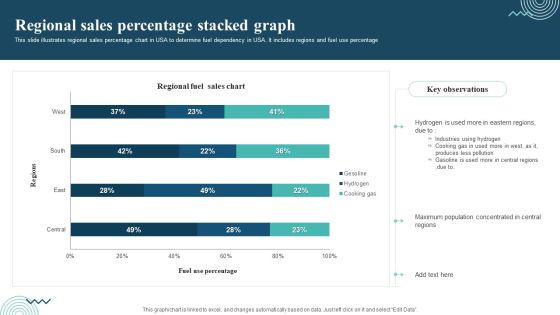
Regional Sales Percentage Stacked Graph Themes PDF
This slide illustrates regional sales percentage chart in USA to determine fuel dependency in USA. It includes regions and fuel use percentage. Pitch your topic with ease and precision using this Regional Sales Percentage Stacked Graph Themes PDF. This layout presents information on Regional Sales, Industries Using Hydrogen, Cooking Gas. It is also available for immediate download and adjustment. So, changes can be made in the color, design, graphics or any other component to create a unique layout.
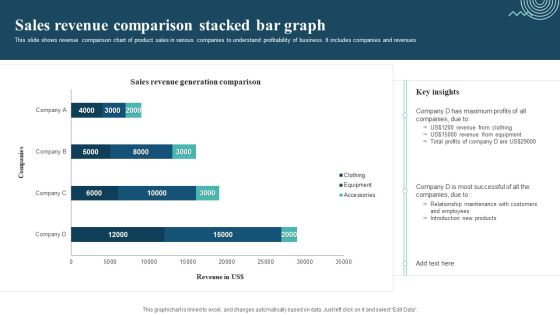
Sales Revenue Comparison Stacked Bar Graph Mockup PDF
This slide shows revenue comparison chart of product sales in various companies to understand profitability of business. It includes companies and revenues. Showcasing this set of slides titled Sales Revenue Comparison Stacked Bar Graph Mockup PDF. The topics addressed in these templates are Sales Revenue Comparison, Revenue From Clothing, Revenue From Equipment. All the content presented in this PPT design is completely editable. Download it and make adjustments in color, background, font etc. as per your unique business setting.

Annual Customer Sales Performance Comparison Graph Portrait PDF
This slide shows the annual sales comparison chart. It also includes total and monthly sales target. Pitch your topic with ease and precision using this Annual Customer Sales Performance Comparison Graph Portrait PDF. This layout presents information on Total Sales Target, Sales Target, Achievement. It is also available for immediate download and adjustment. So, changes can be made in the color, design, graphics or any other component to create a unique layout.
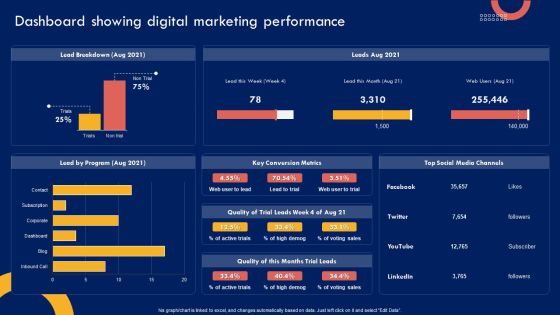
Product Marketing Leadership Dashboard Showing Digital Marketing Performance Download PDF
This graph OR chart is linked to excel, and changes automatically based on data. Just left click on it and select Edit Data. There are so many reasons you need a Product Marketing Leadership Dashboard Showing Digital Marketing Performance Download PDF. The first reason is you cant spend time making everything from scratch, Thus, Slidegeeks has made presentation templates for you too. You can easily download these templates from our website easily.

Product Marketing Leadership Product Marketing Dashboard For Pay Per Microsoft PDF
This graph or chart is linked to excel, and changes automatically based on data. Just left click on it and select Edit Data. Find a pre-designed and impeccable Product Marketing Leadership Product Marketing Dashboard For Pay Per Microsoft PDF. The templates can ace your presentation without additional effort. You can download these easy-to-edit presentation templates to make your presentation stand out from others. So, what are you waiting for Download the template from Slidegeeks today and give a unique touch to your presentation.

Annual Revenue Margin Comparison Sheet Information PDF
This slide showcases a comparison chart with monthly new customers, revenue, profits, and profit margins. It also includes the profit categorization based on set standards. Showcasing this set of slides titled Annual Revenue Margin Comparison Sheet Information PDF. The topics addressed in these templates are Customers, Revenue, Profit Margin. All the content presented in this PPT design is completely editable. Download it and make adjustments in color, background, font etc. as per your unique business setting.
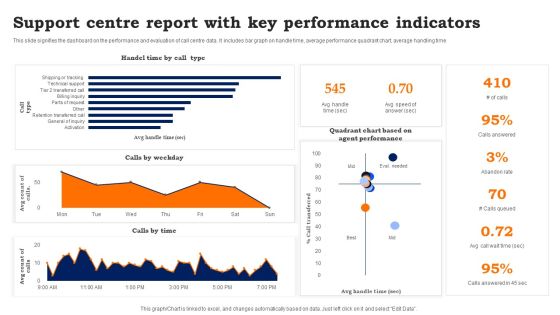
Support Centre Report With Key Performance Indicators Information PDF
This slide signifies the dashboard on the performance and evaluation of call centre data. It includes bar graph on handle time, average performance quadrant chart, average handling time. Showcasing this set of slides titled Support Centre Report With Key Performance Indicators Information PDF. The topics addressed in these templates are Support Centre Report, Key Performance Indicators. All the content presented in this PPT design is completely editable. Download it and make adjustments in color, background, font etc. as per your unique business setting.
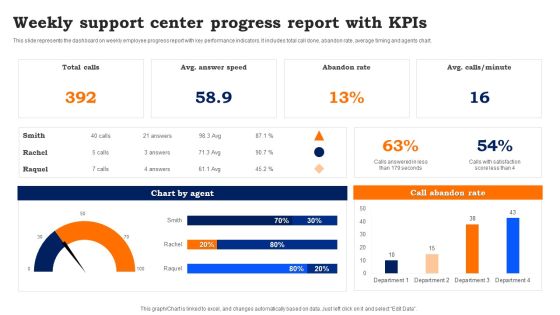
Weekly Support Center Progress Report With Kpis Template PDF
This slide represents the dashboard on weekly employee progress report with key performance indicators. It includes total call done, abandon rate, average timing and agents chart. Pitch your topic with ease and precision using this Weekly Support Center Progress Report With Kpis Template PDF. This layout presents information on Weekly Support, Center Progress Report. It is also available for immediate download and adjustment. So, changes can be made in the color, design, graphics or any other component to create a unique layout.

Prevention Of Information Major Statistics Of Cyber Security Awareness Pictures PDF
This graph or chart is linked to excel, and changes automatically based on data. Just left click on it and select Edit Data. There are so many reasons you need a Prevention Of Information Major Statistics Of Cyber Security Awareness Pictures PDF. The first reason is you cant spend time making everything from scratch, Thus, Slidegeeks has made presentation templates for you too. You can easily download these templates from our website easily.

Inventories By Segment 2016 And 2021 Global Food Products Company Profile Summary PDF
This slide highlights the inventories for 2016 and 2021 through pie chart format. It includes retail products, potash, nitrogen, and phosphateFind a pre-designed and impeccable Inventories By Segment 2016 And 2021 Global Food Products Company Profile Summary PDF. The templates can ace your presentation without additional effort. You can download these easy-to-edit presentation templates to make your presentation stand out from others. So, what are you waiting for Download the template from Slidegeeks today and give a unique touch to your presentation.

Monthly Production Summary Dashboard With Overall Batch Production Portrait PDF
The slide shows the total monthly batch production by the organisation. The slide covers the dashboard with pie charts and bar graphs. Showcasing this set of slides titled Monthly Production Summary Dashboard With Overall Batch Production Portrait PDF. The topics addressed in these templates are Monthly Production Summary Dashboard, Overall Batch Production. All the content presented in this PPT design is completely editable. Download it and make adjustments in color, background, font etc. as per your unique business setting.

Agile Team Member Customer Relationship Management Dashboard With Deals Funnel Mockup PDF
This slide illustrates graphical representation of CRM sales team member data. It includes pipeline, business components and activity level, categories etc. Pitch your topic with ease and precision using this Agile Team Member Customer Relationship Management Dashboard With Deals Funnel Mockup PDF. This layout presents information on Funnel Of Deals, Sent Campaigns Emails, Sales Chart. It is also available for immediate download and adjustment. So, changes can be made in the color, design, graphics or any other component to create a unique layout.

Financial Position Evaluation Of Organization Revenue And Expenses Slides PDF
This slide shows pie chart of organizational revenue and expenses. It can be used by a firm to categorize revenue and expenses sources. Showcasing this set of slides titled Financial Position Evaluation Of Organization Revenue And Expenses Slides PDF. The topics addressed in these templates are Expenses, Revenue, Commissions, Services, Products. All the content presented in this PPT design is completely editable. Download it and make adjustments in color, background, font etc. as per your unique business setting.

Summary Of Site Survey Results Survey SS
Following slide shows the complete overview of survey in graphs and pie charts which assist in setting future trends. It basically shows the result of website visitors, overall website rating, etc. Showcasing this set of slides titled Summary Of Site Survey Results Survey SS. The topics addressed in these templates are Summary, Site Survey Results. All the content presented in this PPT design is completely editable. Download it and make adjustments in color, background, font etc. as per your unique business setting.

Competitive Intelligence Frameworks Product Opportunity Evaluation Infographics PDF
Presenting this set of slides with name competitive intelligence frameworks product opportunity evaluation infographics pdf. This is a five stage process. The stages in this process are customer, product, finance, timing, competition. This is a completely editable PowerPoint presentation and is available for immediate download. Download now and impress your audience.

Financial Structure Approach Table With Debt Equity Ratio Professional PDF
This slide contains a table showing the calculation of owners capital and debt and the percentage of the both. It also includes the calculation of debt equity ratio to know the percentage of company financing that comes from creditors and investors. Showcasing this set of slides titled Financial Structure Approach Table With Debt Equity Ratio Professional PDF. The topics addressed in these templates are Preferred Stock, Debt, Debt Equity. All the content presented in this PPT design is completely editable. Download it and make adjustments in color, background, font etc. as per your unique business setting.

Approaches For Seamless Digital Customer Onboarding Process Designs PDF
This slide covers key techniques to enhance the efficiency of bank customer onboarding process. It includes approaches such as using governance framework, documenting management system, using process first approach, building trust, etc. If you are looking for a format to display your unique thoughts, then the professionally designed Approaches For Seamless Digital Customer Onboarding Process Designs PDF is the one for you. You can use it as a Google Slides template or a PowerPoint template. Incorporate impressive visuals, symbols, images, and other charts. Modify or reorganize the text boxes as you desire. Experiment with shade schemes and font pairings. Alter, share or cooperate with other people on your work. Download Approaches For Seamless Digital Customer Onboarding Process Designs PDF and find out how to give a successful presentation. Present a perfect display to your team and make your presentation unforgettable.

Approaches For Seamless Digital Customer Onboarding Process Ppt Slides Professional PDF
This slide covers key techniques to enhance the efficiency of bank customer onboarding process. It includes approaches such as using governance framework, documenting management system, using process-first approach, building trust, etc. If you are looking for a format to display your unique thoughts, then the professionally designed Approaches For Seamless Digital Customer Onboarding Process Ppt Slides Professional PDF is the one for you. You can use it as a Google Slides template or a PowerPoint template. Incorporate impressive visuals, symbols, images, and other charts. Modify or reorganize the text boxes as you desire. Experiment with shade schemes and font pairings. Alter, share or cooperate with other people on your work. Download Approaches For Seamless Digital Customer Onboarding Process Ppt Slides Professional PDF and find out how to give a successful presentation. Present a perfect display to your team and make your presentation unforgettable.

Define Staff Roles And Responsibilities Clearly Rules PDF
The following slide depicts the employee roles and responsibility chart to clarify roles and promote accountability. It mainly includes elements such as tasks, project manager, IT, finance team, scope statement, budget, quality services, work breakdown structure etc. Get a simple yet stunning designed Define Staff Roles And Responsibilities Clearly Rules PDF. It is the best one to establish the tone in your meetings. It is an excellent way to make your presentations highly effective. So, download this PPT today from Slidegeeks and see the positive impacts. Our easy to edit Define Staff Roles And Responsibilities Clearly Rules PDF can be your go to option for all upcoming conferences and meetings. So, what are you waiting for Grab this template today.

Risk Analysis Chart With Financial Factor Ppt PowerPoint Presentation Gallery Inspiration PDF
Pitch your topic with ease and precision using this risk analysis chart with financial factor ppt powerpoint presentation gallery inspiration pdf. This layout presents information on severity, financial, funds. It is also available for immediate download and adjustment. So, changes can be made in the color, design, graphics or any other component to create a unique layout.
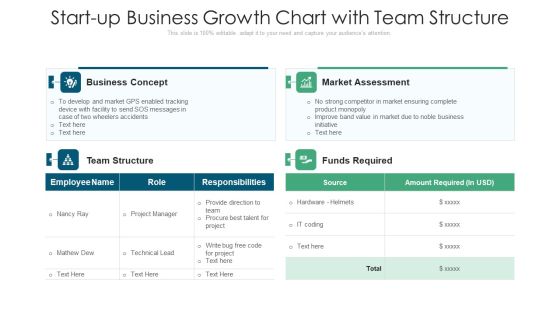
Start Up Business Growth Chart With Team Structure Ppt Model Example File PDF
Pitch your topic with ease and precision using this start up business growth chart with team structure ppt model example file pdf. This layout presents information on business concept, team structure, market assessment, funds required. It is also available for immediate download and adjustment. So, changes can be made in the color, design, graphics or any other component to create a unique layout.

Executing Advance Data Analytics At Workspace Assessing Staff Performance Graphics PDF
This slide helps in analyzing the performance of different executives representatives. It will help in tracking metrics such as cost per contact, percentage of tickets opened, etc. The staff performance will be assessed on various parameters such as cost, quality, productivity and service level. Deliver and pitch your topic in the best possible manner with this executing advance data analytics at workspace assessing staff performance graphics pdf. Use them to share invaluable insights on assessing staff performance on various parameters and impress your audience. This template can be altered and modified as per your expectations. So, grab it now.
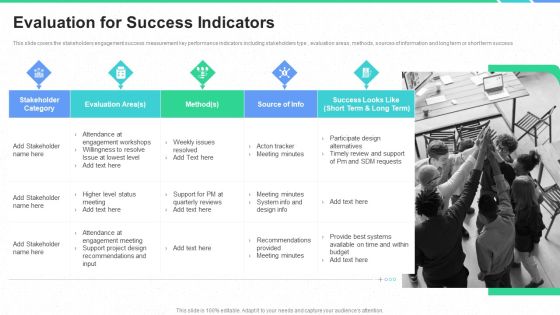
Stakeholders Participation Project Development Process Evaluation For Success Indicators Diagrams PDF
This slide covers the stakeholders engagement success measurement key performance indicators including stakeholders type , evaluation areas, methods, sources of information and long term or short term success. This is a stakeholders participation project development process evaluation for success indicators diagrams pdf template with various stages. Focus and dispense information on one stage using this creative set, that comes with editable features. It contains large content boxes to add your information on topics like stakeholder category, provide best systems available on time and within budget, support project design recommendations and input, meeting minutes. You can also showcase facts, figures, and other relevant content using this PPT layout. Grab it now.
Comparative Analysis Of Land Asset Management Software Solutions Microsoft PDF
Following slide demonstrates software solution which can be used by business for effective management of real estate assets. It includes elements such as software subscription price, features, rating, operating systems, etc. Showcasing this set of slides titled Comparative Analysis Of Land Asset Management Software Solutions Microsoft PDF. The topics addressed in these templates are Budget Management, Online Payment, Administrating. All the content presented in this PPT design is completely editable. Download it and make adjustments in color, background, font etc. as per your unique business setting.

Key To Success And Career Future PowerPoint Templates Ppt Backgrounds For Slides 0113
We present our Key To Success And Career Future PowerPoint Templates PPT Backgrounds For Slides 0113.Present our Security PowerPoint Templates because Our PowerPoint Templates and Slides will let you Hit the target. Go the full distance with ease and elan. Present our Business PowerPoint Templates because You can Double your output with our PowerPoint Templates and Slides. They make beating deadlines a piece of cake. Present our Finance PowerPoint Templates because Our PowerPoint Templates and Slides offer you the needful to organise your thoughts. Use them to list out your views in a logical sequence. Download our Future PowerPoint Templates because You should Bet on your luck with our PowerPoint Templates and Slides. Be assured that you will hit the jackpot. Download and present our Success PowerPoint Templates because Our PowerPoint Templates and Slides will let your ideas bloom. Create a bed of roses for your audience.Use these PowerPoint slides for presentations relating to Career text on key as symbol of new job, security, business, finance, future, success. The prominent colors used in the PowerPoint template are Black, Gray, White. People tell us our Key To Success And Career Future PowerPoint Templates PPT Backgrounds For Slides 0113 are aesthetically designed to attract attention. We guarantee that they will grab all the eyeballs you need. People tell us our job PowerPoint templates and PPT Slides effectively help you save your valuable time. PowerPoint presentation experts tell us our Key To Success And Career Future PowerPoint Templates PPT Backgrounds For Slides 0113 will make you look like a winner. PowerPoint presentation experts tell us our as PowerPoint templates and PPT Slides will help them to explain complicated concepts. Presenters tell us our Key To Success And Career Future PowerPoint Templates PPT Backgrounds For Slides 0113 will help them to explain complicated concepts. The feedback we get is that our key PowerPoint templates and PPT Slides will make the presenter look like a pro even if they are not computer savvy.
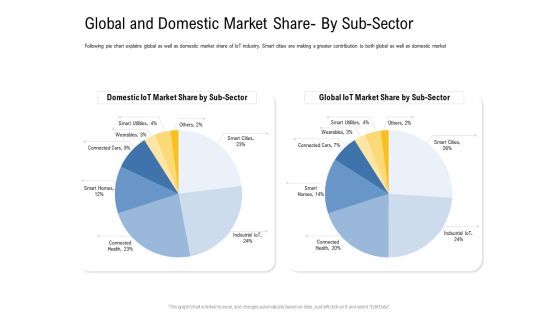
IOT Industry Assessment Global And Domestic Market Share By Sub Sector Ppt Layouts Graphics PDF
Following pie chart explains global as well as domestic market share of IoT industry. Smart cities are making a greater contribution to both global as well as domestic market. Deliver an awe inspiring pitch with this creative iot industry assessment global and domestic market share by sub sector ppt layouts graphics pdf bundle. Topics like global and domestic market share by sub sector can be discussed with this completely editable template. It is available for immediate download depending on the needs and requirements of the user.

Customer Relationship Management Dashboard CRM Application Dashboard Quarter Icons PDF
This graph or chart is linked to excel, and changes automatically based on data. Just left click on it and select Edit Data.Deliver and pitch your topic in the best possible manner with this customer relationship management dashboard crm application dashboard quarter icons pdf. Use them to share invaluable insights on marketing funnel all time, opportunity generation by quarter, active prospects, new prospects, new opportunities and impress your audience. This template can be altered and modified as per your expectations. So, grab it now.

Customer Relationship Management Dashboard Customer Retention Benefits Inspiration PDF
This graph or chart is linked to excel, and changes automatically based on data. Just left click on it and select Edit Data.Deliver an awe inspiring pitch with this creative customer relationship management dashboard customer retention benefits inspiration pdf bundle. Topics like increasing customer retention rates, on average, loyal customers are worth up to 10 times as ,much as their first purchase, profits by 25percent to 95percent can be discussed with this completely editable template. It is available for immediate download depending on the needs and requirements of the user.

Managing Customer Experience CRM Application Dashboard Month Mockup PDF
This graph or chart is linked to excel, and changes automatically based on data. Just left click on it and select Edit Data.Deliver an awe-inspiring pitch with this creative managing customer experience crm application dashboard month mockup pdf bundle. Topics like show me the deals by each stage, what is the revenue this month, get me the number of leads created this month by source can be discussed with this completely editable template. It is available for immediate download depending on the needs and requirements of the user.
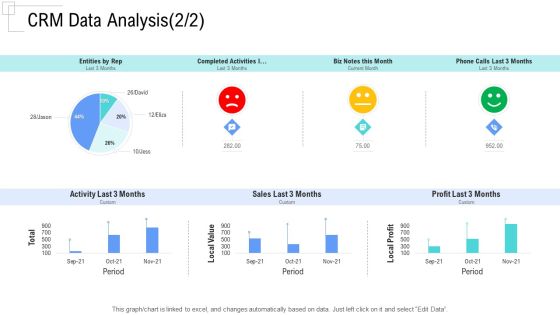
Managing Customer Experience CRM Data Analysis Sales Pictures PDF
This graph or chart is linked to excel, and changes automatically based on data. Just left click on it and select Edit Data.Deliver and pitch your topic in the best possible manner with this managing customer experience crm data analysis sales pictures pdf. Use them to share invaluable insights on entities by rep, completed activities l, biz notes this month, phone calls last 3 months, activity last 3 months and impress your audience. This template can be altered and modified as per your expectations. So, grab it now.
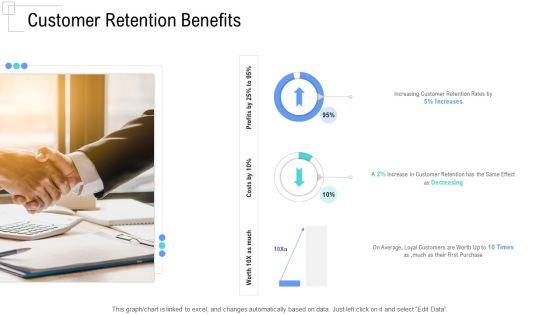
Managing Customer Experience Customer Retention Benefits Template PDF
This graph or chart is linked to excel, and changes automatically based on data. Just left click on it and select Edit Data.Deliver and pitch your topic in the best possible manner with this managing customer experience customer retention benefits template pdf. Use them to share invaluable insights on increasing customer retention rates by, average, loyal customers are worth up to 10 times as much as their first purchase, worth 10x as much and impress your audience. This template can be altered and modified as per your expectations. So, grab it now.
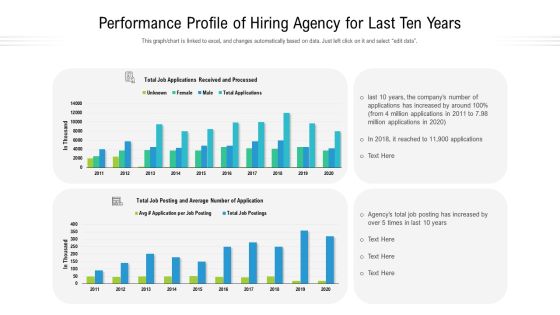
Performance Profile Of Hiring Agency For Last Ten Years Ppt Show Styles PDF
This graph to chart is linked to excel, and changes automatically based on data. Just left click on it and select edit data. Showcasing this set of slides titled performance profile of hiring agency for last ten years ppt show styles pdf. The topics addressed in these templates are performance profile of hiring agency for last ten years. All the content presented in this PPT design is completely editable. Download it and make adjustments in color, background, font etc. as per your unique business setting.

Determining The Major Issues Caused By Covid19 And Its Impact On Food Industry Demonstration PDF
Mentioned slide shows informational stats about the major issues caused by the coronavirus and their impact on food industry. Here the pie chart indicates that about 52 percentage of the food companies said that coronavirus had a dramatic impact on their operations. Deliver and pitch your topic in the best possible manner with this determining the major issues caused by covid19 and its impact on food industry demonstration pdf. Use them to share invaluable insights on communication, industry, dramatic and impress your audience. This template can be altered and modified as per your expectations. So, grab it now.

Building Brand Image Of A Railway Firm Focusing On Customer Satisfaction Formats PDF
The slide shows the pie chart presentation of key drivers of customer satisfaction including train punctuality, traffic information, safety, services, product prices etc. Additionally, it mentions the key measures to improve customer satisfaction. Deliver an awe inspiring pitch with this creative building brand image of a railway firm focusing on customer satisfaction formats pdf bundle. Topics like customers satisfaction, opportunity, innovation can be discussed with this completely editable template. It is available for immediate download depending on the needs and requirements of the user.

Devops Quality Assurance And Testing To Improve Speed And Quality IT Determine Software Testing Topics PDF
This slide provides information regarding essential software testing initiatives in DevOps dashboard in terms of test case status, defect status, etc. Deliver and pitch your topic in the best possible manner with this devops quality assurance and testing to improve speed and quality it determine software testing topics pdf. Use them to share invaluable insights on defects status, work items by state, requirements linked to test case, requirements linked bugs, test case status, requirement base suite charts and impress your audience. This template can be altered and modified as per your expectations. So, grab it now.
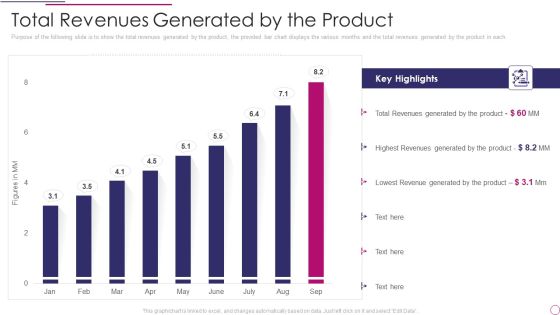
Performance Analysis Of New Product Development Total Revenues Generated By The Product Microsoft PDF
Purpose of the following slide is to show the total revenues generated by the product, the provided bar chart displays the various months and the total revenues generated by the product in each. Deliver and pitch your topic in the best possible manner with this performance analysis of new product development total revenues generated by the product microsoft pdf. Use them to share invaluable insights on total revenues generated by the product and impress your audience. This template can be altered and modified as per your expectations. So, grab it now.

Sustainability Calculation With KPI Employee Engagement And Company Culture Sample PDF Topics PDF
Following slide shows employee engagement and company culture dashboard. It includes employee details, engagement score, total given recognition, previous seven days performance and radar chart to measure employee performance. Deliver and pitch your topic in the best possible manner with this sustainability calculation with kpi employee engagement and company culture sample pdf. Use them to share invaluable insights on employee engagement and company culture dashboard and impress your audience. This template can be altered and modified as per your expectations. So, grab it now.

Development And Operations Quality Assurance And Validation IT Determine Software Testing Initiatives Elements PDF
This slide provides information regarding essential software testing initiatives in DevOps dashboard in terms of test case status, defect status, etc.Deliver and pitch your topic in the best possible manner with this development and operations quality assurance and validation it determine software testing initiatives elements pdf Use them to share invaluable insights on requirement base suite charts, requirements linked to test case, requirements linked bugs and impress your audience. This template can be altered and modified as per your expectations. So, grab it now.
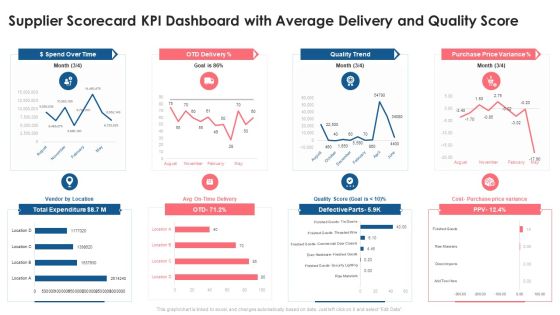
Supplier Scorecard Supplier Scorecard KPI Dashboard With Average Delivery And Quality Score Introduction PDF
This graph or chart is linked to excel, and changes automatically based on data. Just left click on it and select Edit Data. Deliver an awe inspiring pitch with this creative supplier scorecard supplier scorecard kpi dashboard with average delivery and quality score introduction pdf bundle. Topics like dollar spend over time, otd delivery, quality trend, purchase price variance, total expenditure can be discussed with this completely editable template. It is available for immediate download depending on the needs and requirements of the user.

Impact Assessment Of Risk Mitigation Initiatives Commercial Property Development Graphics PDF
This slide illustrates graphs and charts for assessing the impact of risk mitigation initiatives taken to improve personal skills, boost motivation and enhance project deadline meeting capability. Deliver and pitch your topic in the best possible manner with this impact assessment of risk mitigation initiatives commercial property development graphics pdf. Use them to share invaluable insights on impact on personals, engagement level improved, satisfaction level raised, retention level increased and impress your audience. This template can be altered and modified as per your expectations. So, grab it now.

Info Security Update And Installation Of Antivirus Software Ppt PowerPoint Presentation File Designs PDF
This slide depicts the benefits of using antivirus software in the organization, different antivirus software available in the market, and their usage by a graph. Deliver and pitch your topic in the best possible manner with this info security update and installation of antivirus software ppt powerpoint presentation file designs pdf. Use them to share invaluable insights on antivirus software usage chart across us, choose best antivirus, organization and impress your audience. This template can be altered and modified as per your expectations. So, grab it now.
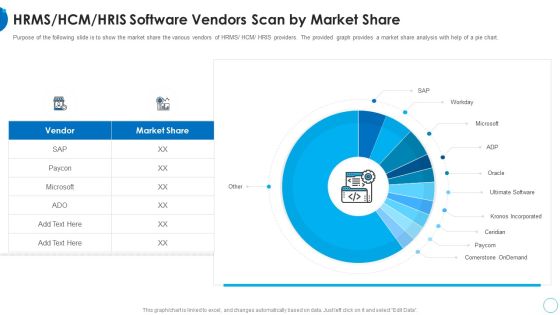
RMS HCM HRIS Software Vendors Scan By Market Share HR Change Management Tools Introduction PDF
Purpose of the following slide is to show the market share the various vendors of HRMS or HCM or HRIS providers. The provided graph provides a market share analysis with help of a pie chart. Deliver and pitch your topic in the best possible manner with this rms hcm hris software vendors scan by market share hr change management tools introduction pdf. Use them to share invaluable insights on hrms or hcm or hris software vendors scan by market share and impress your audience. This template can be altered and modified as per your expectations. So, grab it now.
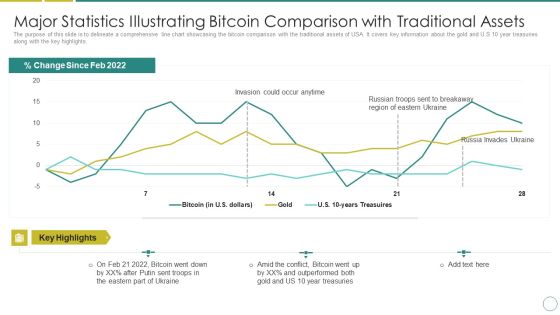
Russia Ukraine Major Statistics Illustrating Bitcoin Comparison With Traditional Assets Guidelines PDF
The purpose of this slide is to delineate a comprehensive line chart showcasing the bitcoin comparison with the traditional assets of USA. It covers key information about the gold and U.S 10 year treasuries along with the key highlights. Deliver an awe inspiring pitch with this creative russia ukraine major statistics illustrating bitcoin comparison with traditional assets guidelines pdf bundle. Topics like invasion could occur anytime, percent change since feb 2022 can be discussed with this completely editable template. It is available for immediate download depending on the needs and requirements of the user.
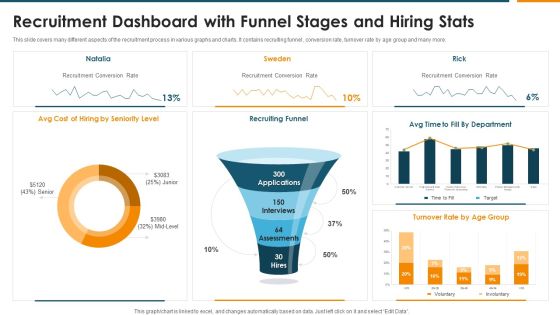
Recruitment Dashboard With Funnel Stages And Hiring Stats Rules PDF
This slide covers many different aspects of the recruitment process in various graphs and charts. It contains recruiting funnel , conversion rate, turnover rate by age group and many more. Pitch your topic with ease and precision using this Recruitment Dashboard With Funnel Stages And Hiring Stats Rules PDF. This layout presents information on Recruiting Funnel, Recruitment Conversion Rate, Seniority Level. It is also available for immediate download and adjustment. So, changes can be made in the color, design, graphics or any other component to create a unique layout.
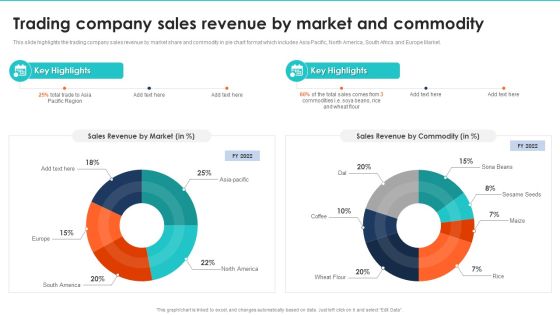
Export Management Company Profile Trading Company Sales Revenue By Market And Commodity Background PDF
This slide highlights the trading company sales revenue by market share and commodity in pie chart format which includes Asia Pacific, North America, South Africa and Europe Market. Deliver and pitch your topic in the best possible manner with this Export Management Company Profile Trading Company Sales Revenue By Market And Commodity Background PDF. Use them to share invaluable insights on Sales Revenue By Market, Sales Revenue By Commodity and impress your audience. This template can be altered and modified as per your expectations. So, grab it now.
