AI PPT Maker
Templates
PPT Bundles
Design Services
Business PPTs
Business Plan
Management
Strategy
Introduction PPT
Roadmap
Self Introduction
Timelines
Process
Marketing
Agenda
Technology
Medical
Startup Business Plan
Cyber Security
Dashboards
SWOT
Proposals
Education
Pitch Deck
Digital Marketing
KPIs
Project Management
Product Management
Artificial Intelligence
Target Market
Communication
Supply Chain
Google Slides
Research Services
 One Pagers
All Categories
-
Home
- Customer Favorites
- Resource Plan
Resource Plan

Age Wise Service Subscription Statistics Ppt PowerPoint Presentation Icon Brochure PDF
Presenting this set of slides with name age wise service subscription statistics ppt powerpoint presentation icon brochure pdf. The topics discussed in these slide is age wise website users are shown on bar chart. This is a completely editable PowerPoint presentation and is available for immediate download. Download now and impress your audience.

Customer Attrition In A Bpo - Dashboard Icons PDF
Deliver an awe-inspiring pitch with this creative customer attrition in a bpo - dashboard icons pdf. bundle. Topics like web chart performance, telecom churn overview metrics, customer care call performance, telecom churn overview metrics, monthly revenue lost can be discussed with this completely editable template. It is available for immediate download depending on the needs and requirements of the user.

Dashboards For Iot Device Summary PDF
Deliver and pitch your topic in the best possible manner with this dashboards for iot device summary pdf. Use them to share invaluable insights on horizontal bar chart, parrot drone, team recent messages and impress your audience. This template can be altered and modified as per your expectations. So, grab it now.

Intelligent Architecture Dashboards For Iot Device Ppt Template PDF
Deliver and pitch your topic in the best possible manner with this intelligent architecture dashboards for iot device ppt template pdf. Use them to share invaluable insights on dashboard, horizontal bar chart, team and impress your audience. This template can be altered and modified as per your expectations. So, grab it now.
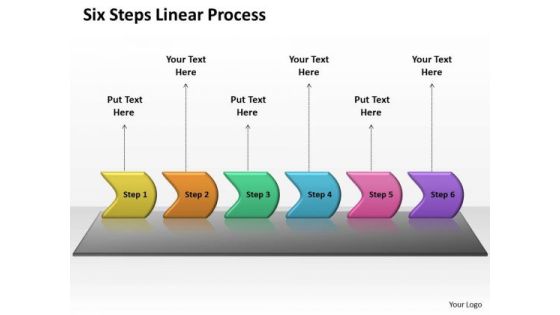
Usa Ppt Background Six Practice The PowerPoint Macro Steps Linear Process 1 Graphic
USA PPT Background six practice the powerpoint macro steps linear process 1 Graphic-This PowerPoint diagram shows six steps of a process. Demonstrate to your audience how the best and most refined ideas pass through. Use this slide to highlight your thought process.-USA PPT Background six practice the powerpoint macro steps linear process 1 Graphic-Account, Arrow, Arrows, Away, Box, Business, Chart, Choice, Choose, Concept, Concepts, Consultation, Corporate, Design, Diagram, Direction, Elements, Flow, Follow, Follows, Future, Group, Grow, Increase, Lines, Many, Month, Move, Past, Period, Phase, Project, Report, Rise, Row, Step, Success

Ppt Background Sequence And Series PowerPoint Presentation Of Selling Steps 4 Design
We present our PPT Background sequence and series PowerPoint presentation of selling steps 4 designs. Use our Arrows PowerPoint Templates because, See satisfaction spread across the room as they unravel your gifted views. Use our Business PowerPoint Templates because, Knowledge is power goes the popular saying. Use our Shapes PowerPoint Templates because, you have played a stellar role and have a few ideas. Use our Finance PowerPoint Templates because, Our Template designs are State of the Art. Use our Process and Flows PowerPoint Templates because, you have churned your mind and come up with effective ways and means to further refine it. Use these PowerPoint slides for presentations relating to 3d, arrow, background, bullet, business, chart, checkmark, chevron, diagram, drop, eps10, financial, five, glass, graphic, gray, icon, illustration, management, point, process, project, reflection, set, shadow, stage, text, transparency, vector, white. The prominent colors used in the PowerPoint template are Yellow, Gray, and Black
Pie Chart Result Discussion With Team PowerPoint Templates Ppt Backgrounds For Slides 0613
Raise A Toast With Our People Powerpoint Templates. Spread Good Cheer Amongst Your Audience. Press The Right Buttons With Our Pie Charts Powerpoint Templates. They Will Take Your Ideas Down The Perfect Channel.

7 Stages Parallel Arrow Program Instructions Starting Business PowerPoint Slides
We present our 7 stages parallel arrow program instructions starting business PowerPoint Slides .Use our Arrows PowerPoint Templates because You have the co-ordinates for your destination of success. Let our PowerPoint Templates and Slides map out your journey. Present our Marketing PowerPoint Templates because Our PowerPoint Templates and Slides will provide you the cutting edge. Slice through the doubts in the minds of your listeners. Present our Business PowerPoint Templates because Our PowerPoint Templates and Slides will bullet point your ideas. See them fall into place one by one. Download our Shapes PowerPoint Templates because Our PowerPoint Templates and Slides will definately Enhance the stature of your presentation. Adorn the beauty of your thoughts with their colourful backgrounds. Download our Flow Charts PowerPoint Templates because Our PowerPoint Templates and Slides are innately eco-friendly. Their high recall value negate the need for paper handouts.Use these PowerPoint slides for presentations relating to Abstract, arrows, balance, business, chart, company, concept, data, diagram, document, finance, financial, report, graph, market, marketing, price, profit, report, statistics, stock, success, trade, work. The prominent colors used in the PowerPoint template are Green, Gray, Black. Presenters tell us our 7 stages parallel arrow program instructions starting business PowerPoint Slides are second to none. Customers tell us our balance PowerPoint templates and PPT Slides are the best it can get when it comes to presenting. Professionals tell us our 7 stages parallel arrow program instructions starting business PowerPoint Slides provide you with a vast range of viable options. Select the appropriate ones and just fill in your text. Professionals tell us our business PowerPoint templates and PPT Slides provide you with a vast range of viable options. Select the appropriate ones and just fill in your text. Presenters tell us our 7 stages parallel arrow program instructions starting business PowerPoint Slides will make the presenter look like a pro even if they are not computer savvy. People tell us our business PowerPoint templates and PPT Slides are specially created by a professional team with vast experience. They diligently strive to come up with the right vehicle for your brilliant Ideas.
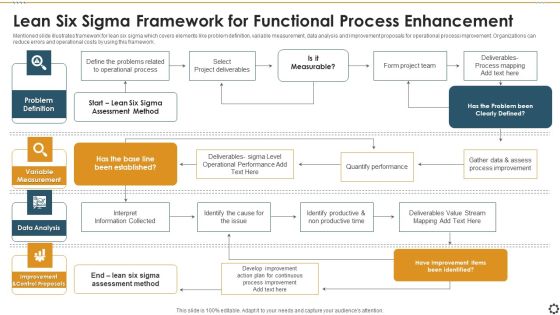
Lean Six Sigma Framework For Functional Process Enhancement Slides PDF
Mentioned slide illustrates framework for lean six sigma which covers elements like problem definition, variable measurement, data analysis and improvement proposals for operational process improvement. Organizations can reduce errors and operational costs by using this framework. Presenting lean six sigma framework for functional process enhancement slides pdf to dispense important information. This template comprises four stages. It also presents valuable insights into the topics including problem definition, variable measurement, data analysis, improvement and control proposals. This is a completely customizable PowerPoint theme that can be put to use immediately. So, download it and address the topic impactfully.

IOT Industry Assessment Competitor Analysis By Features Ppt Professional Gallery PDF
Mentioned radar chart shows competitor analysis based on features, user interface and support offered by own company and competitors. Deliver and pitch your topic in the best possible manner with this iot industry assessment competitor analysis by features ppt professional gallery pdf. Use them to share invaluable insights on features, user interface, support and impress your audience. This template can be altered and modified as per your expectations. So, grab it now.

Customer Relationship Management Dashboard CRM Data Analysis Deals Ideas PDF
This graph or chart is linked to excel, and changes automatically based on data. Just left click on it and select Edit Data.Deliver and pitch your topic in the best possible manner with this customer relationship management dashboard crm data analysis deals ideas pdf. Use them to share invaluable insights on v and impress your audience. This template can be altered and modified as per your expectations. So, grab it now.
API Administration Solution API Management Market Size By Region Graphical Representation Icons PDF
The following chart shows the Application Interface Management Market Analysis by region , over a period of years. Deliver an awe inspiring pitch with this creative api administration solution api management market size by region graphical representation icons pdf bundle. Topics like proficient, technical, continuous, development, technology can be discussed with this completely editable template. It is available for immediate download depending on the needs and requirements of the user.

API Administration Solution Market Size Of API Management By Business Segment Sample PDF
The following chart shows the Application Interface Management Market Analysis by business segment, over a period of years. Deliver and pitch your topic in the best possible manner with this api administration solution market size of api management by business segment sample pdf. Use them to share invaluable insights on management, market, business, segment and impress your audience. This template can be altered and modified as per your expectations. So, grab it now.

API Administration Solution Market Size Of API Management By Platform Clipart PDF
The following chart shows the Application Interface Management Market Analysis by deployment type , over a period of years. Deliver an awe inspiring pitch with this creative api administration solution market size of api management by platform clipart pdf bundle. Topics like market size of api management by platform can be discussed with this completely editable template. It is available for immediate download depending on the needs and requirements of the user.
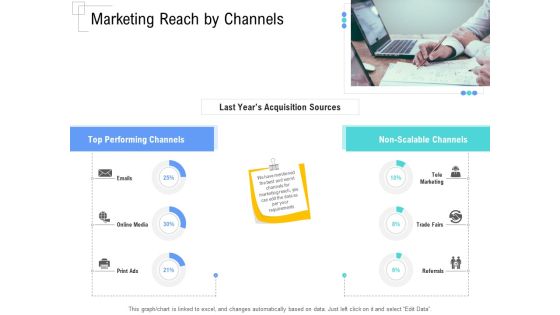
Managing Customer Experience Marketing Reach By Channels Elements PDF
This graph or chart is linked to excel, and changes automatically based on data. Just left click on it and select Edit Data.Deliver and pitch your topic in the best possible manner with this managing customer experience marketing reach by channels elements pdf. Use them to share invaluable insights on last years acquisition sources, top performing channels, non scalable channels and impress your audience. This template can be altered and modified as per your expectations. So, grab it now.
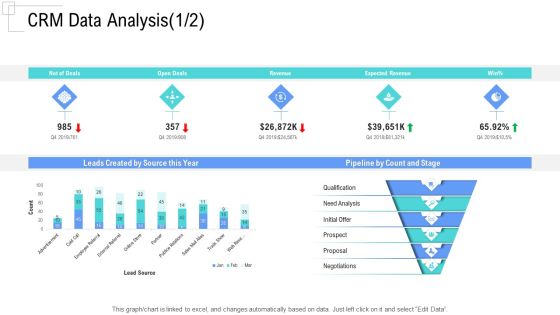
Managing Customer Experience CRM Data Analysis Revenue Designs PDF
This graph or chart is linked to excel, and changes automatically based on data. Just left click on it and select Edit Data.Deliver an awe-inspiring pitch with this creative managing customer experience crm data analysis revenue designs pdf bundle. Topics like leads created by source this year, pipeline by count and stage, qualification, need analysis, initial offer can be discussed with this completely editable template. It is available for immediate download depending on the needs and requirements of the user.

API Ecosystem API Management Market Size By Region Graphical Representation Introduction PDF
The following chart shows the Application Interface Management Market Analysis by region , over a period of years. Deliver an awe inspiring pitch with this creative api ecosystem api management market size by region graphical representation introduction pdf bundle. Topics like management, development, technical, market can be discussed with this completely editable template. It is available for immediate download depending on the needs and requirements of the user.

API Ecosystem Market Size Of API Management By Business Segment Icons PDF
The following chart shows the Application Interface Management Market Analysis by business segment, over a period of years. Deliver and pitch your topic in the best possible manner with this api ecosystem market size of api management by business segment icons pdf. Use them to share invaluable insights on financial, services, insurance, management and impress your audience. This template can be altered and modified as per your expectations. So, grab it now.

API Ecosystem Market Size Of API Management By Platform Portrait PDF
The following chart shows the Application Interface Management Market Analysis by deployment type , over a period of years. Deliver an awe inspiring pitch with this creative api ecosystem market size of api management by platform portrait pdf bundle. Topics like market size of api management by platform can be discussed with this completely editable template. It is available for immediate download depending on the needs and requirements of the user.
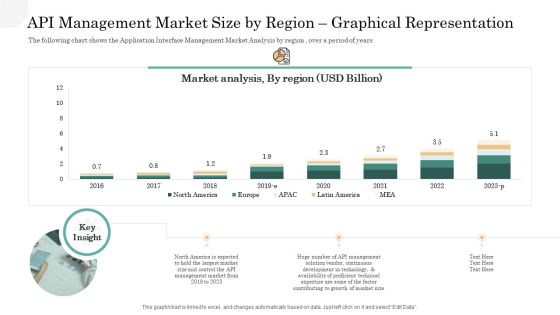
API Management Market API Management Market Size By Region Graphical Representation Ideas PDF
The following chart shows the Application Interface Management Market Analysis by region , over a period of years. Deliver an awe inspiring pitch with this creative api management market api management market size by region graphical representation ideas pdf bundle. Topics like api management market size by region graphical representation can be discussed with this completely editable template. It is available for immediate download depending on the needs and requirements of the user.

API Management Market Market Size Of API Management By Platform Professional PDF
The following chart shows the Application Interface Management Market Analysis by deployment type , over a period of years. Deliver an awe inspiring pitch with this creative api management market market size of api management by platform professional pdf bundle. Topics like market size of api management by platform can be discussed with this completely editable template. It is available for immediate download depending on the needs and requirements of the user.

Bar Graph Showing Revenues Generated By Sales Department Ppt Portfolio Graphics Example PDF
This graph or chart is linked to excel, and changes automatically based on data. Just left click on it and select edit data. Showcasing this set of slides titled bar graph showing revenues generated by sales department ppt portfolio graphics example pdf. The topics addressed in these templates are yearly sales revenues, sales team, profits. All the content presented in this PPT design is completely editable. Download it and make adjustments in color, background, font etc. as per your unique business setting.
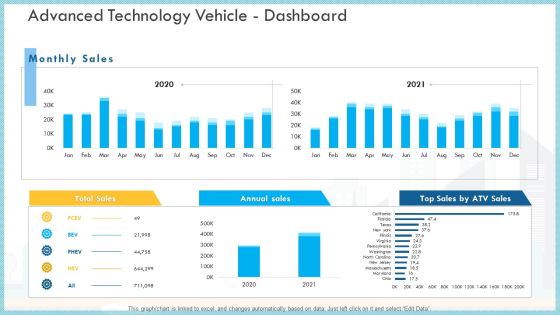
Loss Of Income And Financials Decline In An Automobile Organization Case Study Advanced Technology Vehicle Dashboard Infographics PDF
This graph or chart is linked to excel, and changes automatically based on data. Just left click on it and select Edit Data.Deliver an awe inspiring pitch with this creative loss of income and financials decline in an automobile organization case study advanced technology vehicle dashboard infographics pdf bundle. Topics like total sales, annual sales, monthly sales can be discussed with this completely editable template. It is available for immediate download depending on the needs and requirements of the user.
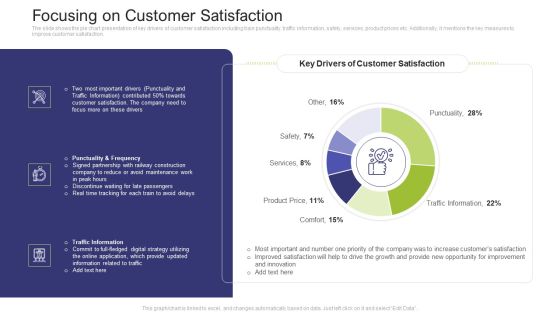
Focusing On Customer Satisfaction Formats PDF
The slide shows the pie chart presentation of key drivers of customer satisfaction including train punctuality, traffic information, safety, services, product prices etc. Additionally, it mentions the key measures to improve customer satisfaction.Deliver and pitch your topic in the best possible manner with this focusing on customer satisfaction formats pdf. Use them to share invaluable insights on product price, services, comfort, punctuality and impress your audience. This template can be altered and modified as per your expectations. So, grab it now.
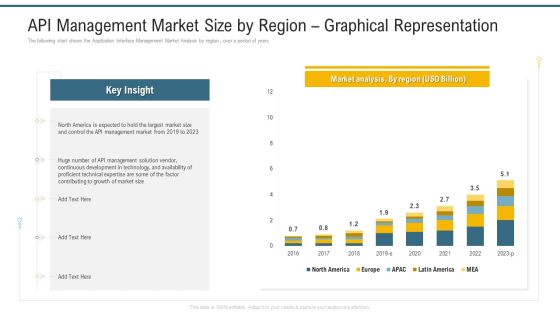
API Management Market Size By Region Graphical Representation Ppt Layouts Visuals PDF
The following chart shows the Application Interface Management Market Analysis by region , over a period of years. Deliver and pitch your topic in the best possible manner with this api management market size by region graphical representation ppt layouts visuals pdf. Use them to share invaluable insights on development in technology, growth of market size, management market and impress your audience. This template can be altered and modified as per your expectations. So, grab it now.
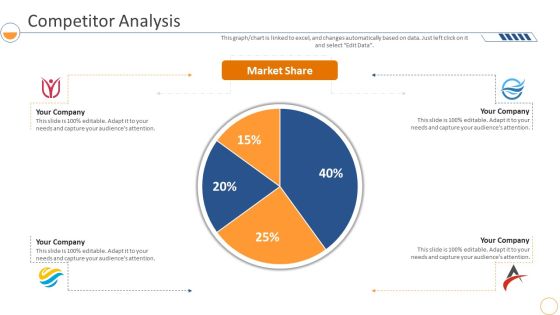
Monthly Company Performance Analysiscompetitor Analysis Market Formats PDF
This graph or chart is linked to excel, and changes automatically based on data. Just left click on it and select Edit Data. Deliver an awe inspiring pitch with this creative monthly company performance analysiscompetitor analysis market formats pdf bundle. Topics like competitor analysis, market share can be discussed with this completely editable template. It is available for immediate download depending on the needs and requirements of the user.

Monthly Company Performance Analysiscompetitor Analysis Pictures PDF
This graph or chart is linked to excel, and changes automatically based on data. Just left click on it and select Edit Data. Deliver and pitch your topic in the best possible manner with this monthly company performance analysiscompetitor analysis pictures pdf. Use them to share invaluable insights on revenue, competitor analysis and impress your audience. This template can be altered and modified as per your expectations. So, grab it now.

Monthly Company Performance Analysiscustomer Service Benchmarking Data Themes PDF
This graph or chart is linked to excel, and changes automatically based on data. Just left click on it and select Edit Data. Deliver an awe inspiring pitch with this creative monthly company performance analysiscustomer service benchmarking data themes pdf bundle. Topics like customer service benchmarking can be discussed with this completely editable template. It is available for immediate download depending on the needs and requirements of the user.
Focusing On Customer Satisfaction Icons PDF
The slide shows the pie chart presentation of key drivers of customer satisfaction including train punctuality, traffic information, safety, services, product prices etc. Additionally, it mentions the key measures to improve customer satisfaction. Deliver an awe inspiring pitch with this creative focusing on customer satisfaction icons pdf bundle. Topics like customers satisfaction, opportunity, innovation can be discussed with this completely editable template. It is available for immediate download depending on the needs and requirements of the user.
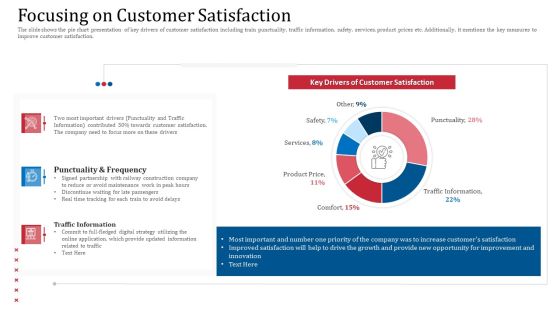
Focusing On Customer Satisfaction Background PDF
The slide shows the pie chart presentation of key drivers of customer satisfaction including train punctuality, traffic information, safety, services, product prices etc. Additionally, it mentions the key measures to improve customer satisfaction.Deliver and pitch your topic in the best possible manner with this focusing on customer satisfaction background pdf. Use them to share invaluable insights on punctuality and frequency, traffic information, updated information and impress your audience. This template can be altered and modified as per your expectations. So, grab it now.

Application Development Best Practice Tools And Templates Jira Dashboard For Software Teams Progress Microsoft PDF
This slide covers the software teams progress through JIRA dashboard which focuses on pie chart, sprint health dashboard and assigned task details. Deliver and pitch your topic in the best possible manner with this application development best practice tools and templates jira dashboard for software teams progress microsoft pdf. Use them to share invaluable insights on improvement, travel provider, initiative, task and impress your audience. This template can be altered and modified as per your expectations. So, grab it now.
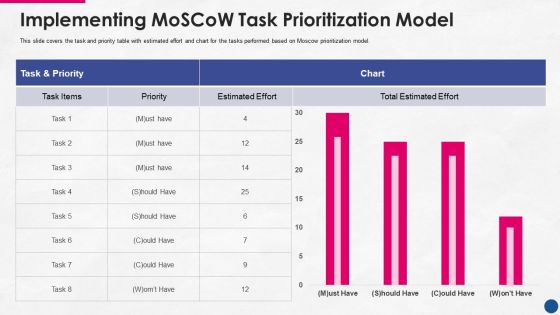
Incorporating Platform Business Model In The Organization Implementing Moscow Task Prioritization Model Inspiration PDF
This slide covers the task and priority table with estimated effort and chart for the tasks performed based on Moscow prioritization model. Deliver an awe inspiring pitch with this creative incorporating platform business model in the organization implementing moscow task prioritization model inspiration pdf bundle. Topics like implementing moscow task prioritization model can be discussed with this completely editable template. It is available for immediate download depending on the needs and requirements of the user.
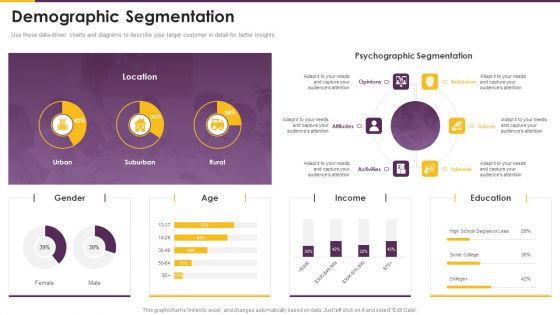
Detailed Guide Consumer Journey Marketing Demographic Segmentation Designs PDF
Use these data-driven charts and diagrams to describe your target customer in detail for better insights. Deliver and pitch your topic in the best possible manner with this detailed guide consumer journey marketing demographic segmentation designs pdf. Use them to share invaluable insights on demographic segmentation and impress your audience. This template can be altered and modified as per your expectations. So, grab it now.
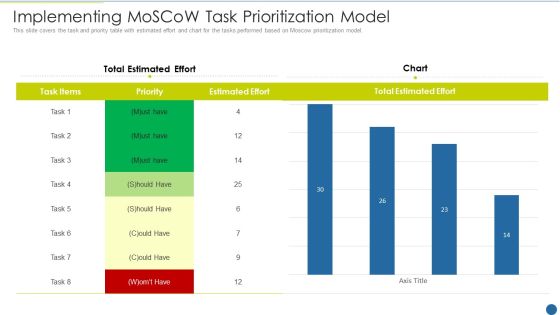
Expedite Multi Sided System Implementing Moscow Task Prioritization Model Demonstration PDF
This slide covers the task and priority table with estimated effort and chart for the tasks performed based on Moscow prioritization model. Deliver an awe inspiring pitch with this creative expedite multi sided system implementing moscow task prioritization model demonstration pdf bundle. Topics like implementing moscow task prioritization model can be discussed with this completely editable template. It is available for immediate download depending on the needs and requirements of the user.

Security Monitoring Dashboard With Application Control And Operating System Statistics Template PDF
This graph or chart is linked to excel, and changes automatically based on data. Just left click on it and select Edit Data. Deliver and pitch your topic in the best possible manner with this security monitoring dashboard with application control and operating system statistics template pdf. Use them to share invaluable insights on application control, restrict office macros, application patching, application hardening and impress your audience. This template can be altered and modified as per your expectations. So, grab it now.
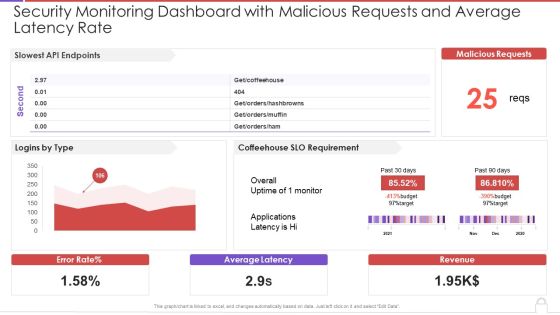
Security Monitoring Dashboard With Malicious Requests And Average Latency Rate Topics PDF
This graph or chart is linked to excel, and changes automatically based on data. Just left click on it and select Edit Data. Deliver an awe inspiring pitch with this creative security monitoring dashboard with malicious requests and average latency rate topics pdf bundle. Topics like slowest api endpoints, malicious requests, coffeehouse slo can be discussed with this completely editable template. It is available for immediate download depending on the needs and requirements of the user.

Supplier Scorecard Retail Compliance Scorecards For Supplier With Damage Free Deliveries Status Sample PDF
This graph or chart is linked to excel, and changes automatically based on data. Just left click on it and select Edit Data. Deliver and pitch your topic in the best possible manner with this supplier scorecard retail compliance scorecards for supplier with damage free deliveries status sample pdf. Use them to share invaluable insights on damage free deliveries, arrival reporting, departure reporting and impress your audience. This template can be altered and modified as per your expectations. So, grab it now.

Supplier Scorecard Retail Compliance Scorecards For Supplier With Delivery Precision Clipart PDF
This graph or chart is linked to excel, and changes automatically based on data. Just left click on it and select Edit Data. Deliver an awe inspiring pitch with this creative supplier scorecard retail compliance scorecards for supplier with delivery precision clipart pdf bundle. Topics like pick up precision, delivery precision, lead time precision can be discussed with this completely editable template. It is available for immediate download depending on the needs and requirements of the user.

Supplier Scorecard Retail Supplier Scorecard For Evaluating Risk Compliance Clipart PDF
This graph or chart is linked to excel, and changes automatically based on data. Just left click on it and select Edit Data. Deliver and pitch your topic in the best possible manner with this supplier scorecard retail supplier scorecard for evaluating risk compliance clipart pdf. Use them to share invaluable insights on risk summary, risk category, vendors evaluated, low, medium, high and impress your audience. This template can be altered and modified as per your expectations. So, grab it now.

Determining The Most Commonly Used Agile Methodologies Download PDF
Mentioned pie chart illustrates informational statistics about most commonly used agile methodologies. Here the slide shows that most of the organization prefers scrum process. Deliver an awe inspiring pitch with this creative determining the most commonly used agile methodologies download pdf bundle. Topics like methodology, organizations, customers, projects can be discussed with this completely editable template. It is available for immediate download depending on the needs and requirements of the user.
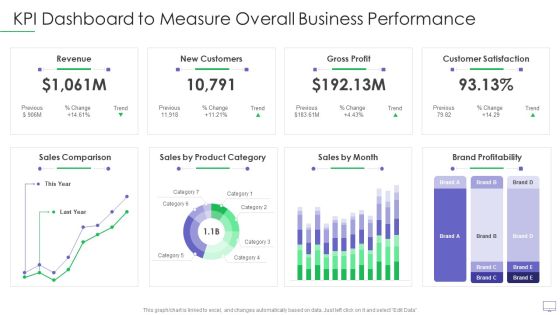
Guide For Software Developers KPI Dashboard To Measure Overall Business Performance Elements PDF
This graph or chart is linked to excel, and changes automatically based on data. Just left click on it and select Edit Data. Deliver an awe inspiring pitch with this creative guide for software developers kpi dashboard to measure overall business performance elements pdf bundle. Topics like revenue new customers, gross profit, customer satisfaction, sales comparison, brand profitability can be discussed with this completely editable template. It is available for immediate download depending on the needs and requirements of the user.
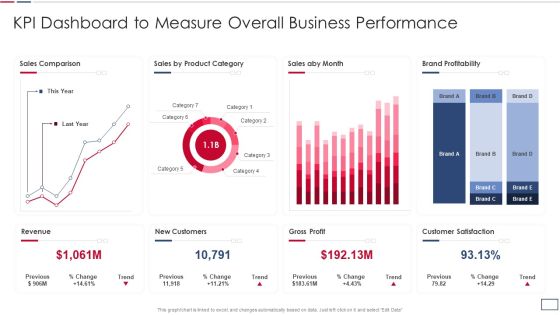
Software Developer Playbook Kpi Dashboard To Measure Overall Business Performance Topics PDF
This graph or chart is linked to excel, and changes automatically based on data. Just left click on it and select Edit Data. Deliver and pitch your topic in the best possible manner with this software developer playbook kpi dashboard to measure overall business performance topics pdf. Use them to share invaluable insights on revenue new customers, gross profit, customer satisfaction, sales comparison and impress your audience. This template can be altered and modified as per your expectations. So, grab it now.

Promotion Campaign Scorecard With Conversion Rate Ppt Inspiration Graphics PDF
This graph or chart is linked to excel, and changes automatically based on data. Just left click on it and select Edit Data. Deliver an awe inspiring pitch with this creative promotion campaign scorecard with conversion rate ppt inspiration graphics pdf bundle. Topics like ctr by campaign, conversions by campaign, impressions by date, conversion value vs target, spent by campaign can be discussed with this completely editable template. It is available for immediate download depending on the needs and requirements of the user.

Promotion Scorecard With Total Traffic And Conversions Ppt Pictures Clipart Images PDF
This graph or chart is linked to excel, and changes automatically based on data. Just left click on it and select Edit Data. Deliver an awe inspiring pitch with this creative promotion scorecard with total traffic and conversions ppt pictures clipart images pdf bundle. Topics likeunique victors monthly trend, unique victors monthly trend, marketing mix can be discussed with this completely editable template. It is available for immediate download depending on the needs and requirements of the user.

Promotion Scorecard With Traffic Sources And Leads Funnel Ppt Layouts Background PDF
This graph or chart is linked to excel, and changes automatically based on data. Just left click on it and select Edit Data. Deliver and pitch your topic in the best possible manner with this promotion scorecard with traffic sources and leads funnel ppt layouts background pdf. Use them to share invaluable insights on lead month, lead funnel, dollar, traffic sources and impress your audience. This template can be altered and modified as per your expectations. So, grab it now.

Summary Financial Accounting Statement Profit And Loss Analysis Dashboard Elements PDF
This graph or chart is linked to excel, and changes automatically based on data. Just left click on it and select Edit Data. Deliver an awe inspiring pitch with this creative Summary Financial Accounting Statement Profit And Loss Analysis Dashboard Elements PDF bundle. Topics like P And L Structure Dynamics, Dupont Rations, Debt Coverage Ratios, Creditworthiness Assessment can be discussed with this completely editable template. It is available for immediate download depending on the needs and requirements of the user.

Construction Management Dashboard With Productivity And Worked Hours Themes PDF
This graph for chart is linked to excel, and changes automatically based on data. Just left click on it and select Edit Data. Deliver an awe inspiring pitch with this creative Construction Management Dashboard With Productivity And Worked Hours Themes PDF bundle. Topics like Teams, Employees, Overall Construction Management Efficiency, Remuneration, Work Environment can be discussed with this completely editable template. It is available for immediate download depending on the needs and requirements of the user.
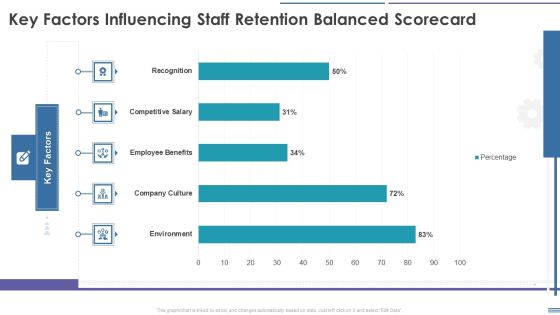
Staff Retention Balanced Scorecard Key Factors Influencing Staff Retention Balanced Scorecard Download PDF
This graph or chart is linked to excel, and changes automatically based on data. Just left click on it and select Edit Data. Deliver an awe inspiring pitch with this creative Staff Retention Balanced Scorecard Key Factors Influencing Staff Retention Balanced Scorecard Download PDF bundle. Topics like Environment, Company Culture, Employee Benefits, Competitive Salary can be discussed with this completely editable template. It is available for immediate download depending on the needs and requirements of the user.
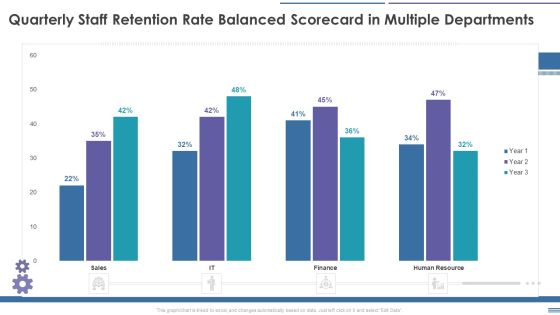
Staff Retention Balanced Scorecard Quarterly Staff Retention Rate Balanced Scorecard In Multiple Formats PDF
This graph or chart is linked to excel, and changes automatically based on data. Just left click on it and select Edit Data. Deliver an awe inspiring pitch with this creative Staff Retention Balanced Scorecard Quarterly Staff Retention Rate Balanced Scorecard In Multiple Formats PDF bundle. Topics like Staff Retention, Balanced Scorecard, Quarterly Staff Retention, Rate Balanced Scorecard can be discussed with this completely editable template. It is available for immediate download depending on the needs and requirements of the user.
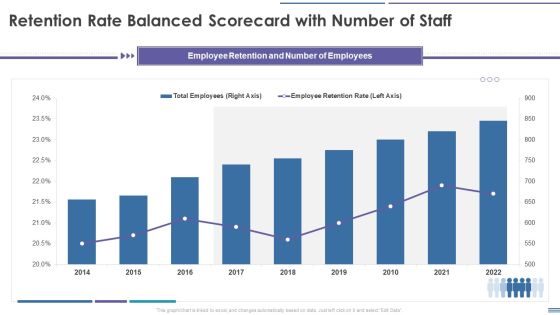
Staff Retention Balanced Scorecard Retention Rate Balanced Scorecard With Number Of Staff Diagrams PDF
This graph or chart is linked to excel, and changes automatically based on data. Just left click on it and select Edit Data. Deliver an awe inspiring pitch with this creative Staff Retention Balanced Scorecard Retention Rate Balanced Scorecard With Number Of Staff Diagrams PDF bundle. Topics like Total Employees, Employee Retention Rate, 2014 To 2022 can be discussed with this completely editable template. It is available for immediate download depending on the needs and requirements of the user.
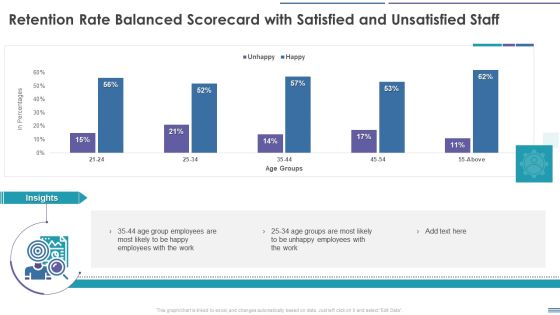
Staff Retention Balanced Scorecard Retention Rate Balanced Scorecard With Satisfied And Unsatisfied Summary PDF
This graph or chart is linked to excel, and changes automatically based on data. Just left click on it and select Edit Data. Deliver an awe inspiring pitch with this creative Staff Retention Balanced Scorecard Retention Rate Balanced Scorecard With Satisfied And Unsatisfied Summary PDF bundle. Topics like Employee, Retention Rate Balanced Scorecard, Satisfied And Unsatisfied Staff can be discussed with this completely editable template. It is available for immediate download depending on the needs and requirements of the user.
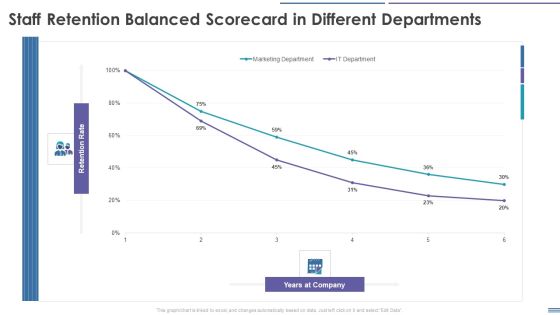
Staff Retention Balanced Scorecard Staff Retention Balanced Scorecard In Different Departments Template PDF
This graph or chart is linked to excel, and changes automatically based on data. Just left click on it and select Edit Data. Deliver and pitch your topic in the best possible manner with this Staff Retention Balanced Scorecard Staff Retention Balanced Scorecard In Different Departments Template PDF. Use them to share invaluable insights on Marketing Department, IT Department and impress your audience. This template can be altered and modified as per your expectations. So, grab it now.
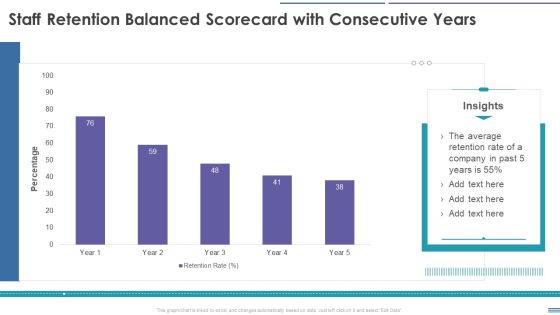
Staff Retention Balanced Scorecard Staff Retention Balanced Scorecard With Consecutive Years Download PDF
This graph or chart is linked to excel, and changes automatically based on data. Just left click on it and select Edit Data. Deliver an awe inspiring pitch with this creative Staff Retention Balanced Scorecard Staff Retention Balanced Scorecard With Consecutive Years Download PDF bundle. Topics like Retention Rate, Percentage can be discussed with this completely editable template. It is available for immediate download depending on the needs and requirements of the user.
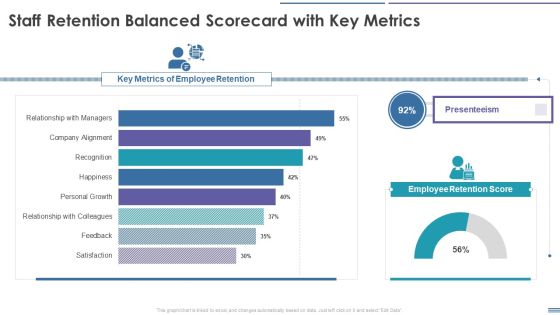
Staff Retention Balanced Scorecard Staff Retention Balanced Scorecard With Key Metrics Demonstration PDF
This graph or chart is linked to excel, and changes automatically based on data. Just left click on it and select Edit Data. Deliver and pitch your topic in the best possible manner with this Staff Retention Balanced Scorecard Staff Retention Balanced Scorecard With Key Metrics Demonstration PDF. Use them to share invaluable insights on Key Metrics Of Employee Retention, Presenteeism, Employee Retention Score and impress your audience. This template can be altered and modified as per your expectations. So, grab it now.

Components Of Integrated Solid Waste Administration In Municipal Corporation Structure PDF
This slide shows the pie chart representing the elements of management of solid waste in municipal corporation. It includes waste in the form of glass, rags, plastic, metals etc. Showcasing this set of slides titled Components Of Integrated Solid Waste Administration In Municipal Corporation Structure PDF. The topics addressed in these templates are Integrated, Administration, Corporation. All the content presented in this PPT design is completely editable. Download it and make adjustments in color, background, font etc. as per your unique business setting.

Auto Sales Profit Scorecard For Two And Four Wheeler Vehicles Inspiration PDF
This graph or chart is linked to excel, and changes automatically based on data. Just left click on it and select Edit Data. Deliver an awe inspiring pitch with this creative Auto Sales Profit Scorecard For Two And Four Wheeler Vehicles Inspiration PDF bundle. Topics like Two Wheeler Vehicles, Four Wheeler Vehicles, Six Wheeler Vehicles can be discussed with this completely editable template. It is available for immediate download depending on the needs and requirements of the user.

Auto Sales Revenues Scorecard Of Multiple Countries Inspiration PDF
This graph or chart is linked to excel, and changes automatically based on data. Just left click on it and select Edit Data. Deliver an awe inspiring pitch with this creative Auto Sales Revenues Scorecard Of Multiple Countries Inspiration PDF bundle. Topics like Auto Sales Revenues, Scorecard Multiple Countries can be discussed with this completely editable template. It is available for immediate download depending on the needs and requirements of the user.

Auto Sales Scorecard Bar Graph For Regional Performance Comparison Infographics PDF
This graph or chart is linked to excel, and changes automatically based on data. Just left click on it and select Edit Data. Deliver an awe inspiring pitch with this creative Auto Sales Scorecard Bar Graph For Regional Performance Comparison Infographics PDF bundle. Topics like Auto Sales Scorecard, Bar Graph Regional, Performance Comparison Product can be discussed with this completely editable template. It is available for immediate download depending on the needs and requirements of the user.

Auto Sales Scorecard For Petrol Vs Diesel Vehicles Template PDF
This graph or chart is linked to excel, and changes automatically based on data. Just left click on it and select Edit Data. Deliver an awe inspiring pitch with this creative Auto Sales Scorecard For Petrol Vs Diesel Vehicles Template PDF bundle. Topics like Top Products Revenue, Petrol Vs Diesel, Vehicles Incremental Sales, Marketing Activities Product can be discussed with this completely editable template. It is available for immediate download depending on the needs and requirements of the user.

Auto Sales Weekly Performance Assessment Scorecard Background PDF
This graph or chart is linked to excel, and changes automatically based on data. Just left click on it and select Edit Data. Deliver and pitch your topic in the best possible manner with this Auto Sales Weekly Performance Assessment Scorecard Background PDF. Use them to share invaluable insights on Auto Sales Weekly, Performance Assessment Scorecard and impress your audience. This template can be altered and modified as per your expectations. So, grab it now.
