AI PPT Maker
Templates
PPT Bundles
Design Services
Business PPTs
Business Plan
Management
Strategy
Introduction PPT
Roadmap
Self Introduction
Timelines
Process
Marketing
Agenda
Technology
Medical
Startup Business Plan
Cyber Security
Dashboards
SWOT
Proposals
Education
Pitch Deck
Digital Marketing
KPIs
Project Management
Product Management
Artificial Intelligence
Target Market
Communication
Supply Chain
Google Slides
Research Services
 One Pagers
All Categories
-
Home
- Customer Favorites
- Resource Plan
Resource Plan

Mitigating Cybersecurity Threats And Vulnerabilities Cyber Threats Management Slides PDF
This slide portrays information regarding the dashboard that firm will use to manage cyber threats. The dashboard will provide clear picture of threats risks prevailing and how they are treated to technical engineers and board level executives. Deliver and pitch your topic in the best possible manner with this mitigating cybersecurity threats and vulnerabilities cyber threats management slides pdf. Use them to share invaluable insights on cyber threats management dashboard and impress your audience. This template can be altered and modified as per your expectations. So, grab it now.

Corporate Security And Risk Management Cyber Threats Management Dashboard Ideas PDF
This slide portrays information regarding the dashboard that firm will use to manage cyber threats. The dashboard will provide clear picture of threats risks prevailing and how they are treated to technical engineers and board level executives. Deliver and pitch your topic in the best possible manner with this corporate security and risk management cyber threats management dashboard ideas pdf. Use them to share invaluable insights on cyber threats management dashboard and impress your audience. This template can be altered and modified as per your expectations. So, grab it now.
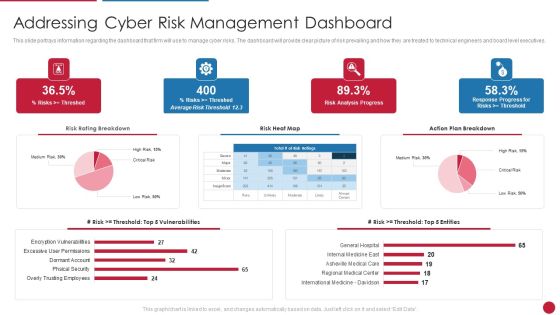
Facilitating IT Intelligence Architecture Addressing Cyber Risk Management Dashboard Professional PDF
This slide portrays information regarding the dashboard that firm will use to manage cyber risks. The dashboard will provide clear picture of risk prevailing and how they are treated to technical engineers and board level executives.Deliver and pitch your topic in the best possible manner with this Facilitating IT Intelligence Architecture Addressing Cyber Risk Management Dashboard Professional PDF Use them to share invaluable insights on International Medicine Davidson, Regional Medical Center, Asheville Medical Care and impress your audience. This template can be altered and modified as per your expectations. So, grab it now.
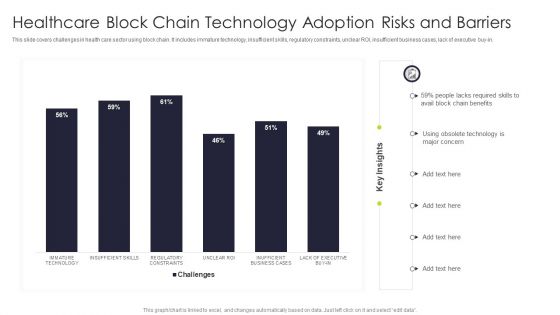
Healthcare Block Chain Technology Adoption Risks And Barriers Portrait PDF
This slide covers challenges in health care sector using block chain. It includes immature technology, insufficient skills, regulatory constraints, unclear ROI, insufficient business cases, lack of executive buy in. Pitch your topic with ease and precision using this Healthcare Block Chain Technology Adoption Risks And Barriers Portrait PDF This layout presents information on Immature Technology, Insufficient Skills, Regulatory Constraints It is also available for immediate download and adjustment. So, changes can be made in the color, design, graphics or any other component to create a unique layout.
Manpower Corporate Security Business Profile Sales Revenue By Region And Services Icons PDF
This slide highlights the security company sales revenue by region and services. It showcases retail mall security, social event security, university hospital security, executive protection and building security. Deliver and pitch your topic in the best possible manner with this Manpower Corporate Security Business Profile Sales Revenue By Region And Services Icons PDF. Use them to share invaluable insights on Sales Revenue, Region And Services and impress your audience. This template can be altered and modified as per your expectations. So, grab it now.
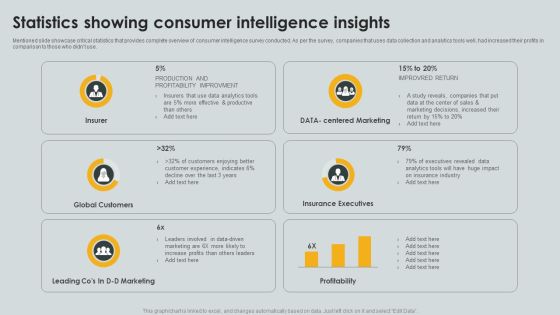
Statistics Showing Consumer Intelligence Insights Ppt PowerPoint Presentation Gallery Information PDF
Mentioned slide showcase critical statistics that provides complete overview of consumer intelligence survey conducted. As per the survey, companies that uses data collection and analytics tools well, had increased their profits in comparison to those who didnt use. Showcasing this set of slides titled Statistics Showing Consumer Intelligence Insights Ppt PowerPoint Presentation Gallery Information PDF. The topics addressed in these templates are Insurer, Global Customers, Insurance Executives. All the content presented in this PPT design is completely editable. Download it and make adjustments in color, background, font etc. as per your unique business setting.

Buy Side Advisory Services In M And A Top Deals Count Split By Sectors Summary PDF
The slide covers the name and designation of the team executivesCEO, CFO, Department head etc. of the company. It also provides the Major Transaction Experience work experience of the executives. If your project calls for a presentation, then Slidegeeks is your go-to partner because we have professionally designed, easy-to-edit templates that are perfect for any presentation. After downloading, you can easily edit Buy Side Advisory Services In M And A Top Deals Count Split By Sectors Summary PDF and make the changes accordingly. You can rearrange slides or fill them with different images. Check out all the handy templates.
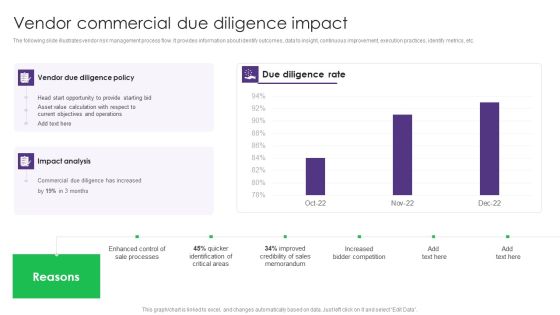
Vendor Commercial Due Diligence Impact Vendor Management System Deployment Infographics PDF
The following slide illustrates vendor risk management process flow. It provides information about identify outcomes, data to insight, continuous improvement, execution practices, identify metrics, etc. The Vendor Commercial Due Diligence Impact Vendor Management System Deployment Infographics PDF is a compilation of the most recent design trends as a series of slides. It is suitable for any subject or industry presentation, containing attractive visuals and photo spots for businesses to clearly express their messages. This template contains a variety of slides for the user to input data, such as structures to contrast two elements, bullet points, and slides for written information. Slidegeeks is prepared to create an impression.
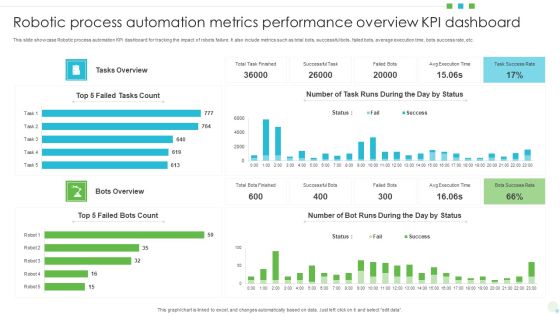
Robotic Process Automation Metrics Performance Overview KPI Dashboard Download PDF
This slide showcase Robotic process automation KPI dashboard for tracking the impact of robots failure. It also include metrics such as total bots, successful bots, failed bots, average execution time, bots success rate, etc. Showcasing this set of slides titled Robotic Process Automation Metrics Performance Overview KPI Dashboard Download PDF. The topics addressed in these templates are Robotic Process Automation, Metrics Performance Overview, Kpi Dashboard. All the content presented in this PPT design is completely editable. Download it and make adjustments in color, background, font etc. as per your unique business setting.

B2b Selling Tactics Dashboard To Maintain Productivity Introduction PDF
The following slide represents B2B selling tactics dashboard which allows executives and managers to effectively control sales and monitor them in one central place. It consists of total sales, payments, trends etc.Pitch your topic with ease and precision using this B2b Selling Tactics Dashboard To Maintain Productivity Introduction PDF. This layout presents information on Operational Effects, Stores Sales Trend, Conversion Rate. It is also available for immediate download and adjustment. So, changes can be made in the color, design, graphics or any other component to create a unique layout.
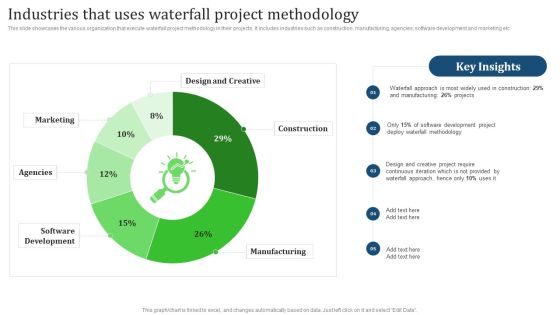
Industries That Uses Waterfall Project Methodology Pictures PDF
This slide showcases the various organization that execute waterfall project methodology in their projects. It includes industries such as construction, manufacturing, agencies, software development and marketing etc. From laying roadmaps to briefing everything in detail, our templates are perfect for you. You can set the stage with your presentation slides. All you have to do is download these easy-to-edit and customizable templates. Industries That Uses Waterfall Project Methodology Pictures PDF will help you deliver an outstanding performance that everyone would remember and praise you for. Do download this presentation today.

Business Vendor Performance Dashboard KPI With Top Supplier For Manufacturing Business Information PDF
Following slide contains executive dashboard which provide managers to track and monitor trends over a period of time. This include elements such as revenue, top products, top supplier, top customer, revenue trends annually, etc. Showcasing this set of slides titled Business Vendor Performance Dashboard KPI With Top Supplier For Manufacturing Business Information PDF. The topics addressed in these templates are Customers, Product, Sales. All the content presented in this PPT design is completely editable. Download it and make adjustments in color, background, font etc. as per your unique business setting.
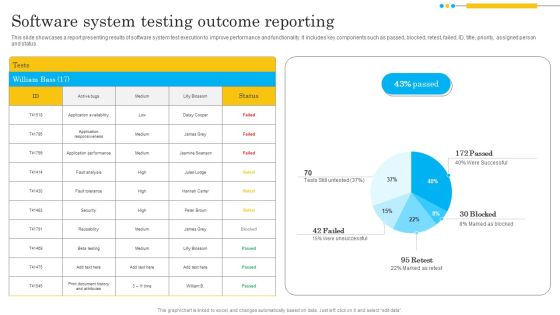
Software System Testing Outcome Reporting Infographics PDF
This slide showcases a report presenting results of software system test execution to improve performance and functionality. It includes key components such as passed, blocked, retest, failed, ID, title, priority, assigned person and status. Showcasing this set of slides titled Software System Testing Outcome Reporting Infographics PDF. The topics addressed in these templates are Application Responsiveness, Application Performance, Security. All the content presented in this PPT design is completely editable. Download it and make adjustments in color, background, font etc. as per your unique business setting.

Clustered Column Line Chart Ppt PowerPoint Presentation Professional Slides
This is a clustered column line chart ppt powerpoint presentation professional slides. This is a four stage process. The stages in this process are bar, finance, business, marketing, growth.

High Low Close Chart Ppt PowerPoint Presentation Layouts Guide
This is a high low close chart ppt powerpoint presentation layouts guide. This is a ten stage process. The stages in this process are high, volume, low, business, marketing, finance.
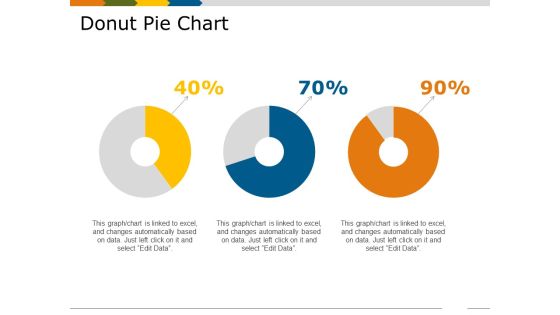
Donut Pie Chart Template 2 Ppt PowerPoint Presentation Show Skills
This is a donut pie chart template 2 ppt powerpoint presentation show skills. This is a three stage process. The stages in this process are percentage, business, marketing, process, finance.

High Low Close Chart Ppt PowerPoint Presentation Ideas Brochure
This is a high low close chart ppt powerpoint presentation ideas brochure. This is a three stage process. The stages in this process are in percentage, product, business, marketing, finance.

Scatter Bubble Chart Ppt PowerPoint Presentation Infographic Template Examples
This is a scatter bubble chart ppt powerpoint presentation infographic template examples. This is a two stage process. The stages in this process are highest sale, product, in price, finance, business.
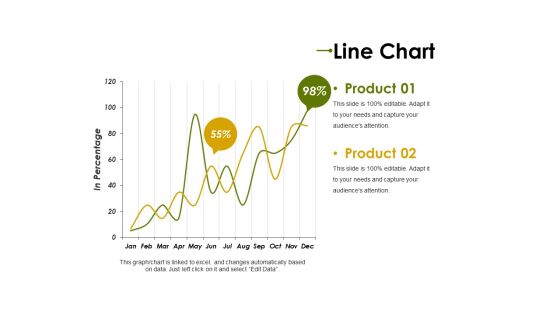
Line Chart Ppt PowerPoint Presentation Professional Clipart Images
This is a line chart ppt powerpoint presentation professional clipart images. This is a two stage process. The stages in this process are product, in percentage, graph, percentage, finance, business.
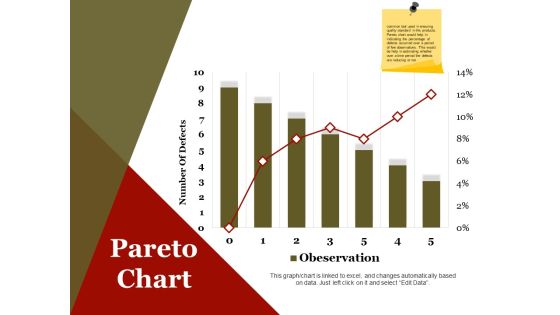
Pareto Chart Ppt PowerPoint Presentation Infographics Design Inspiration
This is a pareto chart ppt powerpoint presentation infographics design inspiration. This is a seven stage process. The stages in this process are number of defects, business, marketing, finance.
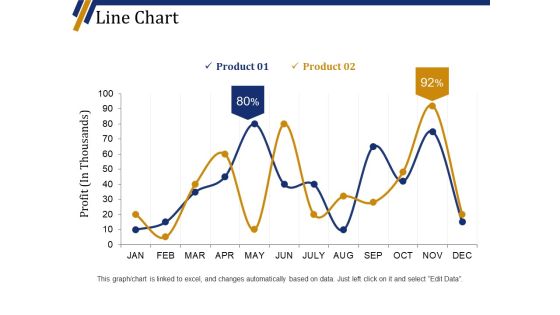
Line Chart Ppt PowerPoint Presentation Portfolio Background Designs
This is a line chart ppt powerpoint presentation portfolio background designs. This is a two stage process. The stages in this process are product, business, finance, marketing, profit in thousands.
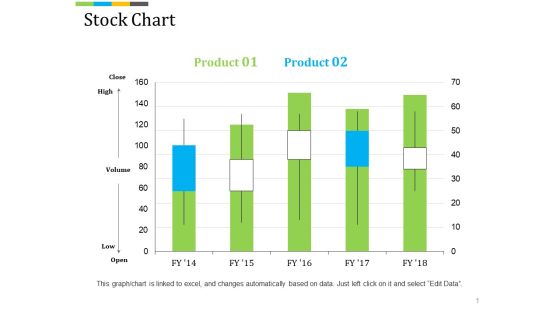
Stock Chart Ppt PowerPoint Presentation Professional Background Image
This is a stock chart ppt powerpoint presentation professional background image. This is a five stage process. The stages in this process are high, volume, low, finance, business, marketing.

Stock Chart Ppt PowerPoint Presentation Summary File Formats
This is a stock chart ppt powerpoint presentation summary file formats. This is a five stage process. The stages in this process are high, volume, low, business, graph, finance.

Column Chart Ppt PowerPoint Presentation Show Master Slide
This is a column chart ppt powerpoint presentation show master slide. This is a six stage process. The stages in this process are financial, years, business, marketing, finance, graph.

Scatter Bubble Chart Ppt PowerPoint Presentation Gallery Example Introduction
This is a scatter bubble chart ppt powerpoint presentation gallery example introduction. This is a eight stage process. The stages in this process are business, marketing, finance, bubble, scatter.
Scatter Chart Template 2 Ppt PowerPoint Presentation Slides Icons
This is a scatter chart template 2 ppt powerpoint presentation slides icons. This is a two stage process. The stages in this process are business, marketing, graph, in percentage, finance.
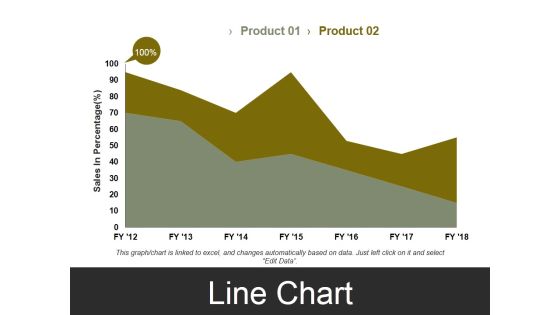
Line Chart Template 3 Ppt PowerPoint Presentation Styles Visual Aids
This is a line chart template 3 ppt powerpoint presentation styles visual aids. This is a two stage process. The stages in this process are sales in percentage, business, marketing, finance, graph.

Clustered Column Chart Ppt PowerPoint Presentation Show Slideshow
This is a clustered column chart ppt powerpoint presentation show slideshow. This is a six stage process. The stages in this process are financial year in, sales in percentage, business, marketing, finance.

Scatter Bubble Chart Ppt PowerPoint Presentation Gallery Show
This is a scatter bubble chart ppt powerpoint presentation gallery show. This is a two stage process. The stages in this process are profit, in percentage, finance, marketing, business.

Area Chart Ppt PowerPoint Presentation Portfolio Graphics Design
This is a area chart ppt powerpoint presentation portfolio graphics design. This is a two stage process. The stages in this process are business, marketing, in percentage, graph, finance.

Bar Chart Ppt PowerPoint Presentation Summary File Formats
This is a bar chart ppt powerpoint presentation summary file formats. This is a two stage process. The stages in this process are business, finance, financial years, sales in percentage, graph.

Column Chart Ppt PowerPoint Presentation Layouts Graphic Images
This is a column chart ppt powerpoint presentation layouts graphic images. This is a two stage process. The stages in this process are business, finance, years, graph, expenditure in, marketing.

Combo Chart Ppt PowerPoint Presentation Gallery Design Ideas
This is a combo chart ppt powerpoint presentation gallery design ideas. This is a three stage process. The stages in this process are business, financial years, sales in percentage, finance, graph.

Area Chart Ppt PowerPoint Presentation Layouts Graphic Images
This is a area chart ppt powerpoint presentation layouts graphic images. This is a three stage process. The stages in this process are business, in years, marketing, in percentage, finance, graph.

Commercial Property Evaluation Techniques Financial Infographics PDF
This is a commercial property evaluation techniques financial infographics pdf template with various stages. Focus and dispense information on three stages using this creative set, that comes with editable features. It contains large content boxes to add your information on topics like minimum, medium, maximum. You can also showcase facts, figures, and other relevant content using this PPT layout. Grab it now.
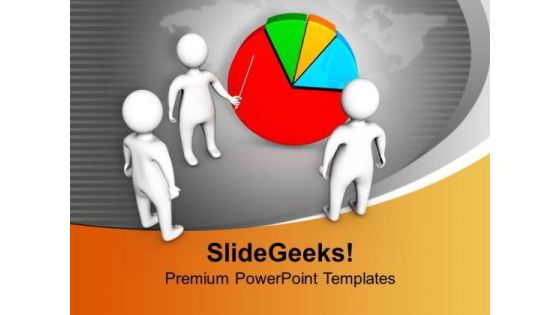
Businessman Presenting Statistical Chart PowerPoint Templates Ppt Backgrounds For Slides 0313
We present our Businessman Presenting Statistical Chart PowerPoint Templates PPT Backgrounds For Slides 0313.Use our Marketing PowerPoint Templates because Your ideas provide food for thought. Our PowerPoint Templates and Slides will help you create a dish to tickle the most discerning palate. Use our Finance PowerPoint Templates because It will Raise the bar of your Thoughts. They are programmed to take you to the next level. Download and present our People PowerPoint Templates because You can Rise to the occasion with our PowerPoint Templates and Slides. You will bring your audience on their feet in no time. Download and present our Pie charts PowerPoint Templates because Our PowerPoint Templates and Slides will let your ideas bloom. Create a bed of roses for your audience. Download and present our Business PowerPoint Templates because our PowerPoint Templates and Slides are the string of your bow. Fire of your ideas and conquer the podium.Use these PowerPoint slides for presentations relating to person pointing a pie chart, people, business, marketing, pie chart, finance. The prominent colors used in the PowerPoint template are Green, Red, White.
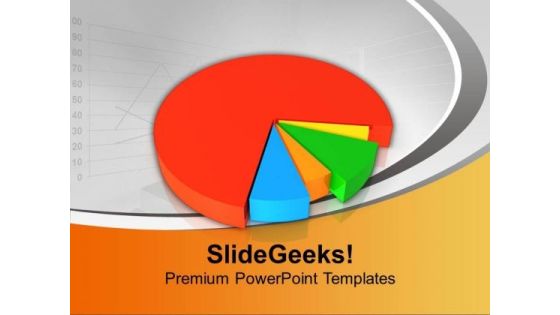
Pie Chart For Marketing And Business PowerPoint Templates Ppt Backgrounds For Slides 0413
We present our Pie Chart For Marketing And Business PowerPoint Templates PPT Backgrounds For Slides 0413.Present our Finance PowerPoint Templates because you should once Tap the ingenuity of our PowerPoint Templates and Slides. They are programmed to succeed. Download and present our Marketing PowerPoint Templates because You can Hit the nail on the head with our PowerPoint Templates and Slides. Embed your ideas in the minds of your audience. Download our Success PowerPoint Templates because Our PowerPoint Templates and Slides will let you Leave a lasting impression to your audiences. They possess an inherent longstanding recall factor. Download and present our Pie chart PowerPoint Templates because Our PowerPoint Templates and Slides will effectively help you save your valuable time. They are readymade to fit into any presentation structure. Use our Business PowerPoint Templates because you can Set pulses racing with our PowerPoint Templates and Slides. They will raise the expectations of your team.Use these PowerPoint slides for presentations relating to Pie chart, finance, marketing, business, success, pie chart. The prominent colors used in the PowerPoint template are Blue, Red, Green.

Chart With Percents Business Marketing PowerPoint Templates And PowerPoint Backgrounds 0611
Microsoft PowerPoint Template and Background with chart with percents
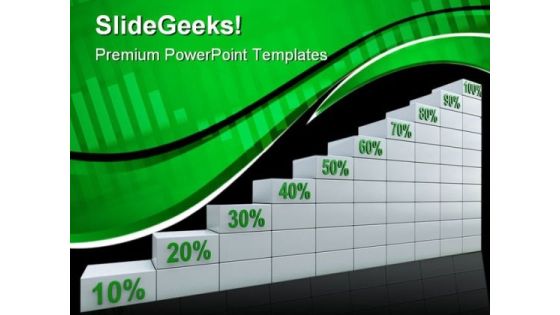
Chart With Percents Business Marketing PowerPoint Themes And PowerPoint Slides 0611
Microsoft PowerPoint Theme and Slide with chart with percents
Food Company Financial Performance Summary Historical Food Product Sales Chart Icons PDF
The following slide shows the comparative sales growth of agricultural products and processed foods. It shows the product sales from more than three decades to assess the change in demand of company products. This Food Company Financial Performance Summary Historical Food Product Sales Chart Icons PDF from Slidegeeks makes it easy to present information on your topic with precision. It provides customization options, so you can make changes to the colors, design, graphics, or any other component to create a unique layout. It is also available for immediate download, so you can begin using it right away. Slidegeeks has done good research to ensure that you have everything you need to make your presentation stand out. Make a name out there for a brilliant performance.

Comparison Of Social Media Platforms To Run Online Ads Ppt PowerPoint Presentation Diagram Graph Charts PDF
This slide showcases comparative assessment of social media channels which can help marketers to identify ideal platform for running ad campaigns. Its key components are platform, worldwide users, user demographics, B2B and B2C Slidegeeks is here to make your presentations a breeze with Comparison Of Social Media Platforms To Run Online Ads Ppt PowerPoint Presentation Diagram Graph Charts PDF With our easy to use and customizable templates, you can focus on delivering your ideas rather than worrying about formatting. With a variety of designs to choose from, you are sure to find one that suits your needs. And with animations and unique photos, illustrations, and fonts, you can make your presentation pop. So whether you are giving a sales pitch or presenting to the board, make sure to check out Slidegeeks first.

Goal Pie Chart Concept Business PowerPoint Templates And PowerPoint Themes 0612
Goal Pie Chart Concept Business PowerPoint Templates And PowerPoint Themes PPT Slides-Microsoft Powerpoint Templates and Background with pie chart concept

Cloud Platform Migration With Business Workload Forecast Introduction PDF Structure PDF
The following slide illustrates the forecasts of cloud platform migration usage in allocating multiple business workloads. It includes information about on premises, public, private and hybrid cloud platforms along with workload allocation projections. This can assist businesses in choosing most efficient system for doing operations.Showcasing this set of slides titled Cloud Platform Migration With Business Workload Forecast Introduction PDF Structure PDF. The topics addressed in these templates are Cloud Platform Migration With Business Workload Forecast. All the content presented in this PPT design is completely editable. Download it and make adjustments in color, background, font etc. as per your unique business setting.

Monthly Real Estate Sales Dashboard For Real Estate Business Ppt PowerPoint Presentation File Skills PDF
This slide showcases property sales dashboard to track progress and communicate key development to management. It further includes details such as US sales, target per employee, top selling segments, etc. Showcasing this set of slides titled Monthly Real Estate Sales Dashboard For Real Estate Business Ppt PowerPoint Presentation File Skills PDF. The topics addressed in these templates are Top 5 Sales Segments, Sold Units By State, Top 10 Projects, Sales Vs Target Per Agent. All the content presented in this PPT design is completely editable. Download it and make adjustments in color, background, font etc. as per your unique business setting.

Dashboard Depicting Client Portfolio Insights Template PDF
This slide focuses on the dashboard that depicts the insights about customer profiles which includes project manager name, gander, address, business phone, segments with timeline, brand affinities, interests, average online spend, churn risk, etc.Showcasing this set of slides titled Dashboard Depicting Client Portfolio Insights Template PDF The topics addressed in these templates are Brand Affinities, Interests Similar, Average Spend All the content presented in this PPT design is completely editable. Download it and make adjustments in color, background, font etc. as per your unique business setting.

Capacity Allotment Management Dashboard With Staff Demand Rules PDF
This slide shows Capacity Allocation Dashboard with Staff Demand which can be beneficial for project managers to effectively manage multiple tasks with optimum time allocation of workers. It includes information about capacity forecast, staff demand, allocation audit, users, etc. Showcasing this set of slides titled Capacity Allotment Management Dashboard With Staff Demand Rules PDF. The topics addressed in these templates are Capacity Forecast, Allocation Audit, Unstaffed Demand. All the content presented in this PPT design is completely editable. Download it and make adjustments in color, background, font etc. as per your unique business setting.

Financial Forecast And Essential Metrics Dashboard Showing Cash Management Designs PDF
This slide contains the projections of the company financials to predict the future position so that better decisions could be taken for the growth prospective. It also includes ratios, cash balance, inventory analysis , etc. Showcasing this set of slides titled Financial Forecast And Essential Metrics Dashboard Showing Cash Management Designs PDF. The topics addressed in these templates are Days Sales Outstanding, Cash Management Dashboard, Days Inventory Outstanding. All the content presented in this PPT design is completely editable. Download it and make adjustments in color, background, font etc. as per your unique business setting.

Cyber Security Threat Dashboard With KPI Metrics Icons PDF
This slide shows dashboard of cyber threats to organization and metrics and performance indicators for security officer. It covers operational health, audit and compliance, controls health and project status. Showcasing this set of slides titled Cyber Security Threat Dashboard With KPI Metrics Icons PDF. The topics addressed in these templates are Cyber Security Threat Dashboard, Kpi Metrics. All the content presented in this PPT design is completely editable. Download it and make adjustments in color, background, font etc. as per your unique business setting.
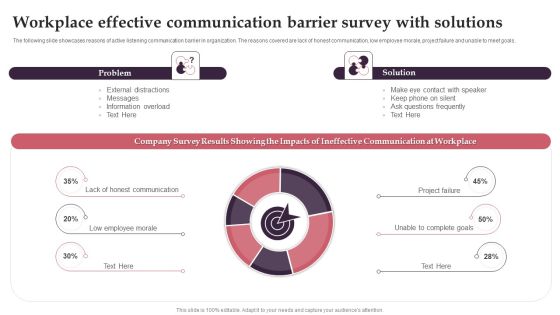
Workplace Effective Communication Barrier Survey With Solutions Elements PDF
The following slide showcases reasons of active listening communication barrier in organization. The reasons covered are lack of honest communication, low employee morale, project failure and unable to meet goals. Showcasing this set of slides titled Workplace Effective Communication Barrier Survey With Solutions Elements PDF. The topics addressed in these templates are Workplace Effective Communication, Barrier Survey With Solutions. All the content presented in this PPT design is completely editable. Download it and make adjustments in color, background, font etc. as per your unique business setting.

Enterprise Workforce Performance Dashboard With Sprint Review Themes PDF
This slide illustrates project extended team KPI dashboard with sprints evaluation. It provides information about average cycle time, velocity history, sprint variance, capacity variance, committed variance, etc. Showcasing this set of slides titled Enterprise Workforce Performance Dashboard With Sprint Review Themes PDF. The topics addressed in these templates are Velocity History, Sprint Variance, Average Cycle, Time Per State. All the content presented in this PPT design is completely editable. Download it and make adjustments in color, background, font etc. as per your unique business setting.

Post Consumer Recycled Plastic Waste Market Statistics With Growth Rate Elements PDF
This slide covers a report on plastic recycling based on future projections. It includes CAGR rate, incremental growth from 2019-2023, annual growth rate, etc. Showcasing this set of slides titled Post Consumer Recycled Plastic Waste Market Statistics With Growth Rate Elements PDF. The topics addressed in these templates are Market Acceleration, Growth CAGR, Incremental Growth, 2021 To 2023. All the content presented in this PPT design is completely editable. Download it and make adjustments in color, background, font etc. as per your unique business setting.

Building Material And Expenses Analytics For Construction Site Designs PDF
This slide shows statistics for cash outflow in first six months of project and material requirement with rate per unit for build up area of 1000 SQFT. It includes details about fittings, cement, finishers, sand, steel, etc. Showcasing this set of slides titled Building Material And Expenses Analytics For Construction Site Designs PDF. The topics addressed in these templates are Building Material, Material Quantity, Construction Site. All the content presented in this PPT design is completely editable. Download it and make adjustments in color, background, font etc. as per your unique business setting.
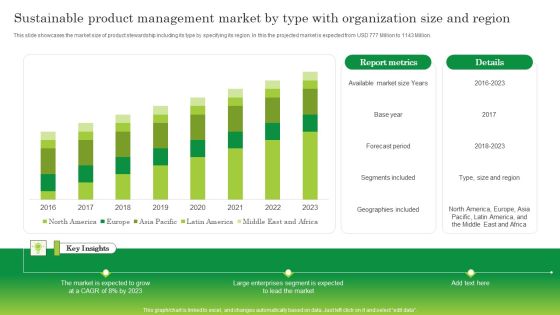
Sustainable Product Management Market By Type With Organization Size And Region Topics PDF
This slide showcases the market size of product stewardship including its type by specifying its region. In this the projected market is expected from USD 777 Million to 1143 Million. Showcasing this set of slides titled Sustainable Product Management Market By Type With Organization Size And Region Topics PDF. The topics addressed in these templates are Segments Included, Forecast Period, Available Market Size. All the content presented in this PPT design is completely editable. Download it and make adjustments in color, background, font etc. as per your unique business setting.

Negative Outcomes Resulting From Workplace Conflicts Clipart PDF
This slide shows according to the most recent workplace data, the coronavirus pandemic has had a significant impact on workplace patterns. It includes personal insults , resignations, project failure bullying, employees moving to different departments etc. Showcasing this set of slides titled Negative Outcomes Resulting From Workplace Conflicts Clipart PDF. The topics addressed in these templates are Percent Of Employees, Workplace Politics, Employee Satisfaction Ratings. All the content presented in this PPT design is completely editable. Download it and make adjustments in color, background, font etc. as per your unique business setting.
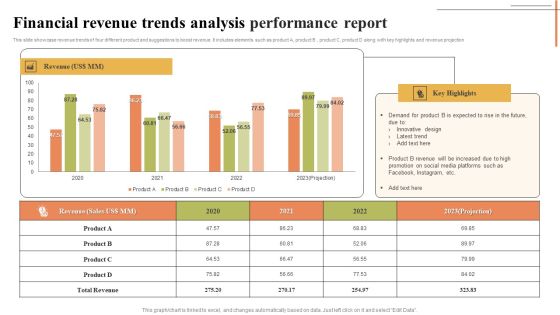
Financial Revenue Trends Analysis Performance Report Designs PDF
This slide showcase revenue trends of four different product and suggestions to boost revenue. It includes elements such as product A, product B , product C, product D along with key highlights and revenue projection. Showcasing this set of slides titled Financial Revenue Trends Analysis Performance Report Designs PDF. The topics addressed in these templates are Revenue, Innovative Design, Latest Trend. All the content presented in this PPT design is completely editable. Download it and make adjustments in color, background, font etc. as per your unique business setting.

KPI Dashboard To Track Best Market Opportunities For New Established Business Pictures PDF
Following slide showcases KPI dashboard to determine best market for launching new business. It includes key components such as growth rate by different industries, best states to launch startup, sales forecast, market growth forecast, projected sales by different states. Showcasing this set of slides titled KPI Dashboard To Track Best Market Opportunities For New Established Business Pictures PDF. The topics addressed in these templates are Forecasted Sales, Growth Rate, Startup Industries. All the content presented in this PPT design is completely editable. Download it and make adjustments in color, background, font etc. as per your unique business setting.
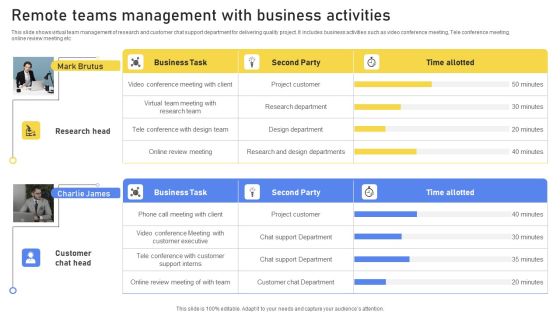
Remote Teams Management With Business Activities Graphics PDF
This slide shows virtual team management of research and customer chat support department for delivering quality project. It includes business activities such as video conference meeting, Tele conference meeting, online review meeting etc. Showcasing this set of slides titled Remote Teams Management With Business Activities Graphics PDF. The topics addressed in these templates are Research Head, Customer Chat Head, Business Task. All the content presented in this PPT design is completely editable. Download it and make adjustments in color, background, font etc. as per your unique business setting.

KPI Dashboard Highlighting Business Problems Microsoft PDF
This slide depicts a dashboard which highlights the problems faced by organizations to easily track the issues and offer solutions for the same. The various key performance indicators in this dashboard are pain points by status, unresolved pain points for march 2023 etc. Showcasing this set of slides titled KPI Dashboard Highlighting Business Problems Microsoft PDF. The topics addressed in these templates are Unresolved Pain Points, Resolved Pain Points, Project Components. All the content presented in this PPT design is completely editable. Download it and make adjustments in color, background, font etc. as per your unique business setting.
Tracking Performance Of Cloud Storage Deployment Dashboard Portrait PDF
The following slide highlights implementation of cloud storage performance tracking dashboard to improve innovation, to attain faster time to market. It includes components such as pinned folders, storage usage, recently used files, documents, images, videos, music, fonts, projects etc. Showcasing this set of slides titled Tracking Performance Of Cloud Storage Deployment Dashboard Portrait PDF. The topics addressed in these templates are Storage Usage, Dashboard, Tracking. All the content presented in this PPT design is completely editable. Download it and make adjustments in color, background, font etc. as per your unique business setting.

Key Areas Of Expenditure Guide To Enhance Organic Growth By Advancing Business Procedures Designs PDF
The following slide displays the cost breakdown or the areas of expenditure of the organization as is displays a tabular form of expenditure with the annual cost and its description. This is a Key Areas Of Expenditure Guide To Enhance Organic Growth By Advancing Business Procedures Designs PDF template with various stages. Focus and dispense information on one stage using this creative set, that comes with editable features. It contains large content boxes to add your information on topics like Cost Procurement, Audit Maintenance, Website Maintenance. You can also showcase facts, figures, and other relevant content using this PPT layout. Grab it now.
