AI PPT Maker
Templates
PPT Bundles
Design Services
Business PPTs
Business Plan
Management
Strategy
Introduction PPT
Roadmap
Self Introduction
Timelines
Process
Marketing
Agenda
Technology
Medical
Startup Business Plan
Cyber Security
Dashboards
SWOT
Proposals
Education
Pitch Deck
Digital Marketing
KPIs
Project Management
Product Management
Artificial Intelligence
Target Market
Communication
Supply Chain
Google Slides
Research Services
 One Pagers
All Categories
-
Home
- Customer Favorites
- Resource Plan
Resource Plan
Two Companies Comparison Chart With Sustainability Ppt PowerPoint Presentation Icon Model PDF
Showcasing this set of slides titled two companies comparison chart with sustainability ppt powerpoint presentation icon model pdf. The topics addressed in these templates are develop, leadership, sustainability. All the content presented in this PPT design is completely editable. Download it and make adjustments in color, background, font etc. as per your unique business setting.
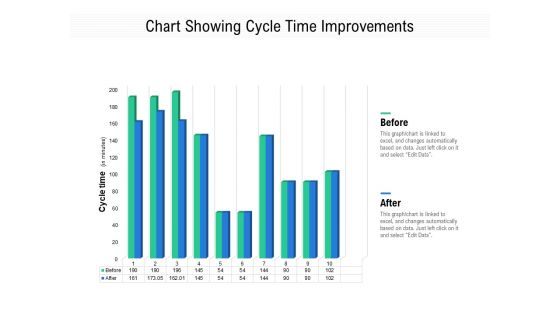
Chart Showing Cycle Time Improvements Ppt PowerPoint Presentation Infographic Template Rules PDF
Pitch your topic with ease and precision using this chart showing cycle time improvements ppt powerpoint presentation infographic template rules pdf. This layout presents information on before, after. It is also available for immediate download and adjustment. So, changes can be made in the color, design, graphics or any other component to create a unique layout.
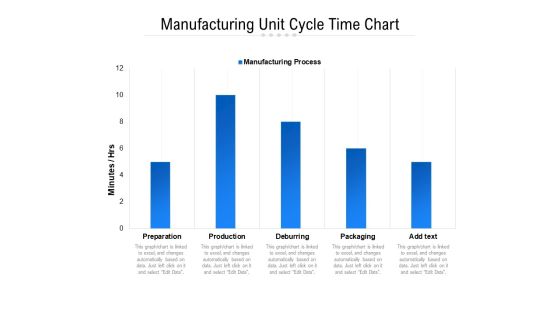
Manufacturing Unit Cycle Time Chart Ppt PowerPoint Presentation Visual Aids PDF
Showcasing this set of slides titled manufacturing unit cycle time chart ppt powerpoint presentation visual aids pdf. The topics addressed in these templates are preparation, production, deburring, packaging, manufacturing process. All the content presented in this PPT design is completely editable. Download it and make adjustments in color, background, font etc. as per your unique business setting.

Coronavirus Disease 19 Contagiousness Comparison Chart Ppt PowerPoint Presentation Professional Background Designs PDF
Pitch your topic with ease and precision using this coronavirus disease 19 contagiousness comparison chart ppt powerpoint presentation professional background designs pdf. This layout presents information on x values seasonal norovirus case fatality rate. It is also available for immediate download and adjustment. So, changes can be made in the color, design, graphics or any other component to create a unique layout.

Monthly Website Performance Analysis Chart Ppt PowerPoint Presentation Model Skills PDF
Pitch your topic with ease and precision using this monthly website performance analysis chart ppt powerpoint presentation model skills pdf. This layout presents information on visitor devices, maverage time, the breakdown, laptop, desktop, mobile. It is also available for immediate download and adjustment. So, changes can be made in the color, design, graphics or any other component to create a unique layout.

Monthly Website Performance Analysis Chart Ppt PowerPoint Presentation Ideas Master Slide PDF
Pitch your topic with ease and precision using this monthly website performance analysis chart ppt powerpoint presentation ideas master slide pdf. This layout presents information on visitor devices, website traffic trends, the breakdown, average time. It is also available for immediate download and adjustment. So, changes can be made in the color, design, graphics or any other component to create a unique layout.

Pie Chart Showing Product Classification Of A Business Ppt PowerPoint Presentation File Guide PDF
Pitch your topic with ease and precision using this pie chart showing product classification of a business ppt powerpoint presentation file guide pdf. This layout presents information on entertainment products, hardware products, software products. It is also available for immediate download and adjustment. So, changes can be made in the color, design, graphics or any other component to create a unique layout.

Chart Representing Digital Marketing Channel Mix Used For Promotion Ppt Icon Graphic Tips PDF
Showcasing this set of slides titled chart representing digital marketing channel mix used for promotion ppt icon graphic tips pdf. The topics addressed in these templates are email marketing, social media organic, paid search marketing. All the content presented in this PPT design is completely editable. Download it and make adjustments in color, background, font etc. as per your unique business setting.
Pie Chart Showing Three Phases Of Business Transformation Process Ppt PowerPoint Presentation Gallery Icon PDF
Showcasing this set of slides titled pie chart showing three phases of business transformation process ppt powerpoint presentation gallery icon pdf. The topics addressed in these templates are analysis phase, design phase, implementation phase. All the content presented in this PPT design is completely editable. Download it and make adjustments in color, background, font etc. as per your unique business setting.
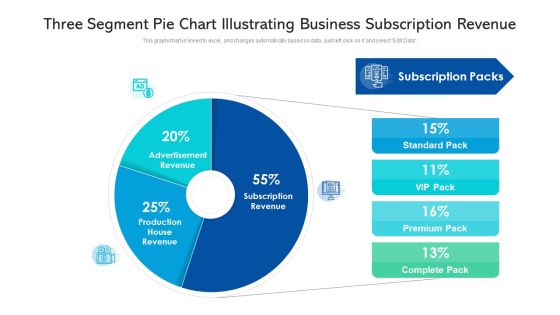
Three Segment Pie Chart Illustrating Business Subscription Revenue Ppt PowerPoint Presentation File Slideshow PDF
Showcasing this set of slides titled three segment pie chart illustrating business subscription revenue ppt powerpoint presentation file slideshow pdf. The topics addressed in these templates are advertisement revenue, production house revenue, subscription revenue. All the content presented in this PPT design is completely editable. Download it and make adjustments in color, background, font etc. as per your unique business setting.

Financial Chart Showing Business Life Cycle Ppt PowerPoint Presentation Gallery Designs PDF
Introducing our financial chart showing business life cycle ppt powerpoint presentation gallery designs pdf set of slides. The topics discussed in these slides are sales, profits, business. This is an immediately available PowerPoint presentation that can be conveniently customized. Download it and convince your audience.

Business Chart Showing Consumer Satisfaction Level Ppt PowerPoint Presentation Slides Guidelines PDF
Showcasing this set of slides titled business chart showing consumer satisfaction level ppt powerpoint presentation slides guidelines pdf. The topics addressed in these templates are dissatisfied, satisfied, services quality. All the content presented in this PPT design is completely editable. Download it and make adjustments in color, background, font etc. as per your unique business setting.
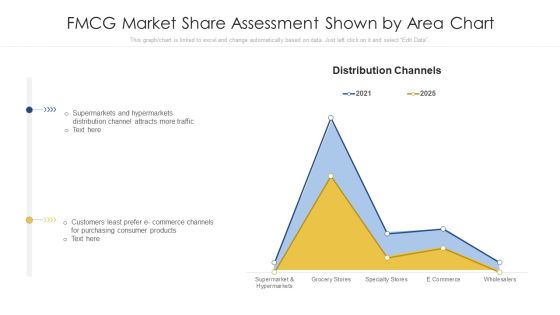
Fmcg Market Share Assessment Shown By Area Chart Ppt PowerPoint Presentation Show Infographic Template PDF
Showcasing this set of slides titled fmcg market share assessment shown by area chart ppt powerpoint presentation show infographic template pdf. The topics addressed in these templates are hypermarkets distribution, purchasing consumer products, distribution channels. All the content presented in this PPT design is completely editable. Download it and make adjustments in color, background, font etc. as per your unique business setting.

Bar Chart With Percentage Of Weekly Product Sales Ppt PowerPoint Presentation File Clipart Images PDF
Showcasing this set of slides titled bar chart with percentage of weekly product sales ppt powerpoint presentation file clipart images pdf. The topics addressed in these templates are . All the content presented in this PPT design is completely editable. Download it and make adjustments in color, background, font etc. as per your unique business setting.

Operational Process Improvement Dashboard With RACI Chart And Action Timeline Metric Designs PDF
Deliver an awe inspiring pitch with this creative operational process improvement dashboard with raci chart and action timeline metric designs pdf bundle. Topics like metric, target, quality, customer can be discussed with this completely editable template. It is available for immediate download depending on the needs and requirements of the user.

Operational Process Improvement Dashboard With RACI Chart And Action Timeline Target Summary PDF
Deliver and pitch your topic in the best possible manner with this operational process improvement dashboard with raci chart and action timeline target summary pdf. Use them to share invaluable insights on quality, metrics, customer and impress your audience. This template can be altered and modified as per your expectations. So, grab it now.
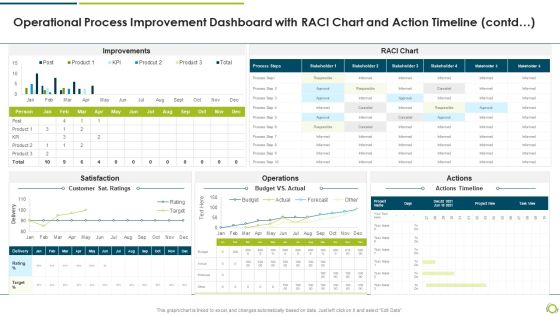
Operational Process Improvement Dashboard With RACI Chart And Action Timeline Contd Mockup PDF
Deliver and pitch your topic in the best possible manner with this operational process improvement dashboard with raci chart and action timeline contd mockup pdf. Use them to share invaluable insights on Satisfaction, operations, actions and impress your audience. This template can be altered and modified as per your expectations. So, grab it now.
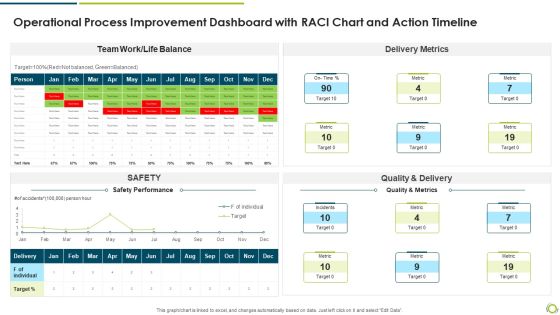
Operational Process Improvement Dashboard With RACI Chart And Action Timeline Themes PDF
Deliver an awe inspiring pitch with this creative operational process improvement dashboard with raci chart and action timeline themes pdf bundle. Topics like quality and delivery, delivery metrics, safety performance can be discussed with this completely editable template. It is available for immediate download depending on the needs and requirements of the user.

Bar Chart Representing Latest Labor Market Trend In 2022 Ppt PowerPoint Presentation File Objects PDF
Showcasing this set of slides titled bar chart representing latest labor market trend in 2022 ppt powerpoint presentation file objects pdf. The topics addressed in these templates are university, college, trades, high school, less than high school. All the content presented in this PPT design is completely editable. Download it and make adjustments in color, background, font etc. as per your unique business setting.

Quality Of Talent Scorecard With Employee Performance Bar Chart Formats PDF
Deliver an awe inspiring pitch with this creative Quality Of Talent Scorecard With Employee Performance Bar Chart Formats PDF bundle. Topics like Technical Skills, Communication Skills, Selling Skills can be discussed with this completely editable template. It is available for immediate download depending on the needs and requirements of the user.
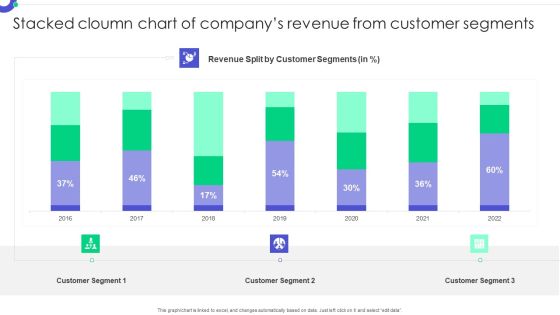
Stacked Cloumn Chart Of Companys Revenue From Customer Segments Mockup PDF
Showcasing this set of slides titled Stacked Cloumn Chart Of Companys Revenue From Customer Segments Mockup PDF. The topics addressed in these templates are Customer Segments, Revenue Split, Customer Segment. All the content presented in this PPT design is completely editable. Download it and make adjustments in color, background, font etc. as per your unique business setting.
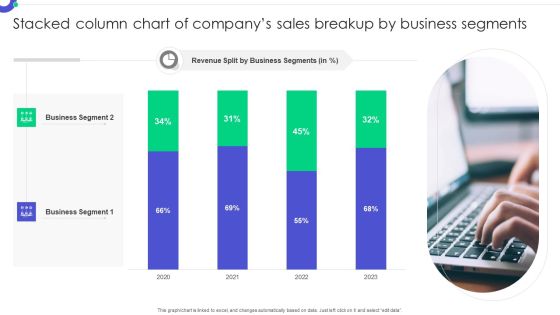
Stacked Column Chart Of Companys Sales Breakup By Business Segments Rules PDF
Pitch your topic with ease and precision using this Stacked Column Chart Of Companys Sales Breakup By Business Segments Rules PDF. This layout presents information on Business Segment, Revenue Split, Business Segments. It is also available for immediate download and adjustment. So, changes can be made in the color, design, graphics or any other component to create a unique layout.

Stacked Column Chart Of Product Sold By A Healthcare Company Download PDF
Pitch your topic with ease and precision using this Stacked Column Chart Of Product Sold By A Healthcare Company Download PDF. This layout presents information on Sales Split Products, Medical Product, Healthcare Company. It is also available for immediate download and adjustment. So, changes can be made in the color, design, graphics or any other component to create a unique layout.

Customer Churn Rate Projection For Next Five Years Ppt Layouts Influencers PDF
This slide provides the five years projection 2021 2025 of the companys customer churn rate along with the key strategic reasons behind the sudden decrease in the churn rate. Deliver and pitch your topic in the best possible manner with this customer churn rate projection for next five years ppt layouts influencers pdf. Use them to share invaluable insights on implementing, software, process, rate, techniques and impress your audience. This template can be altered and modified as per your expectations. So, grab it now.
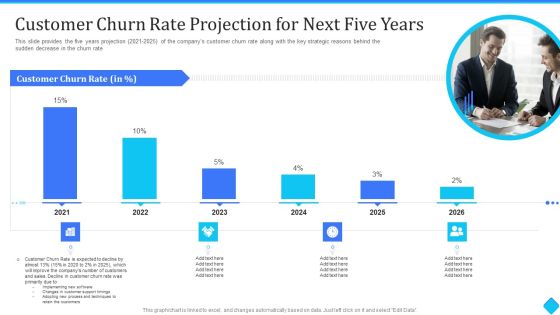
User Onboarding Process Development Customer Churn Rate Projection For Next Five Years Summary PDF
This slide provides the five years projection 2021-2025 of the companys customer churn rate along with the key strategic reasons behind the sudden decrease in the churn rate. Deliver an awe-inspiring pitch with this creative User Onboarding Process Development Customer Churn Rate Projection For Next Five Years Summary PDF bundle. Topics like customer churn rate, customers and sales, process and techniques can be discussed with this completely editable template. It is available for immediate download depending on the needs and requirements of the user.

Causes Of Low Sales Of The Company Ppt Layouts Show PDF
This slide shows that the latest marketing techniques are the triggers of a decrease in consumer satisfaction and retention rate from last year to this year. Thus, customer satisfaction rate fell by 30 percent and customer retention rate dropped by 45 percent. Deliver an awe inspiring pitch with this creative causes of low sales of the company ppt layouts show pdf bundle. Topics like customer retention, direct selling, customer satisfaction can be discussed with this completely editable template. It is available for immediate download depending on the needs and requirements of the user.
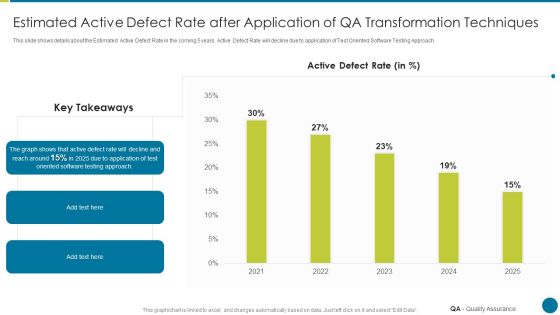
QA Modification For Product Quality Development And Consumer Satisfaction Estimated Active Defect Rate Slides PDF
This slide shows details about the Estimated Active Defect Rate in the coming 5 years. Active Defect Rate will decline due to application of Test Oriented Software Testing Approach. Deliver an awe inspiring pitch with this creative qa modification for product quality development and consumer satisfaction estimated active defect rate slides pdf bundle. Topics like estimated active defect rate after application of qa transformation techniques can be discussed with this completely editable template. It is available for immediate download depending on the needs and requirements of the user.

Sales Promotion Of Upgraded Product Through Upselling Causes Of Low Sales Of The Company Infographics PDF
This slide shows that the latest marketing techniques are the triggers of a decrease in consumer satisfaction and retention rate from last year to this year. Thus, customer satisfaction rate fell by 30 percent and customer retention rate dropped by 45 percent. Deliver an awe inspiring pitch with this creative sales promotion of upgraded product through upselling causes of low sales of the company infographics pdf bundle. Topics like direct selling, through internet can be discussed with this completely editable template. It is available for immediate download depending on the needs and requirements of the user.

Deploying Quality Assurance QA Transformation Estimated Active Defect Rate After Application Icons PDF
This slide shows details about the estimated active defect rate in the coming 5 years. Active defect rate will decline due to application of test oriented software testing approach.Deliver an awe inspiring pitch with this creative Deploying Quality Assurance QA Transformation Estimated Active Defect Rate After Application Icons PDF bundle. Topics like Estimated Active Defect Rate After Application Of QA Transformation Techniques can be discussed with this completely editable template. It is available for immediate download depending on the needs and requirements of the user.
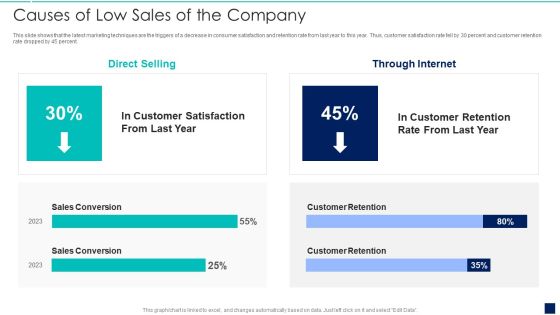
Influence Buyers To Purchase Additional High Causes Of Low Sales Of The Company Topics PDF
This slide shows that the latest marketing techniques are the triggers of a decrease in consumer satisfaction and retention rate from last year to this year. Thus, customer satisfaction rate fell by 30 percent and customer retention rate dropped by 45 percent.Deliver an awe inspiring pitch with this creative Influence Buyers To Purchase Additional High Causes Of Low Sales Of The Company Topics PDF bundle. Topics like Sales Conversion, Customer Retention, Direct Selling can be discussed with this completely editable template. It is available for immediate download depending on the needs and requirements of the user.
Sales Process Automation For Revenue Growth Decline In Sales Volume For Past 4 Years Icons PDF
This slide shows the decline in sales volume for past 4 years due to multiple reasons such as poor sales forecasting, minimal sales training, fails in sales prospecting, outdated marketing techniques, etc.Deliver an awe inspiring pitch with this creative Sales Process Automation For Revenue Growth Decline In Sales Volume For Past 4 Years Icons PDF bundle. Topics like Lost Opportunities, Pipeline By Territory, Sales By Product can be discussed with this completely editable template. It is available for immediate download depending on the needs and requirements of the user.

Latest Digital Marketing Trend Analysis Statistical Template PDF
This slide represents the graph showing the latest trends in the field of digital marketing. It includes trends such as content marketing, AI and machine learning, marketing automation, big data, CRO and improving website experiences, social media marketing etc. Deliver an awe inspiring pitch with this creative Latest Digital Marketing Trend Analysis Statistical Template PDF bundle. Topics like Business Growth, Content Marketing, Technique can be discussed with this completely editable template. It is available for immediate download depending on the needs and requirements of the user.
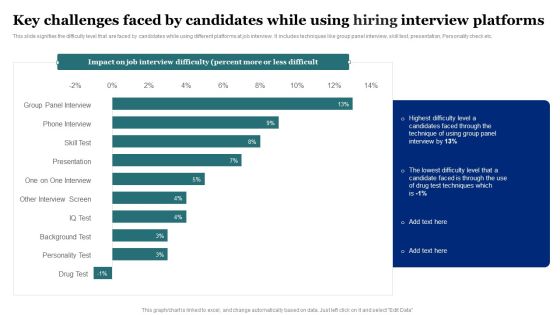
Key Challenges Faced By Candidates While Using Hiring Interview Platforms Rules PDF
This slide signifies the difficulty level that are faced by candidates while using different platforms at job interview. It includes techniques like group panel interview, skill test, presentation, Personality check etc. Pitch your topic with ease and precision using this Key Challenges Faced By Candidates While Using Hiring Interview Platforms Rules PDF. This layout presents information on Group Panel Interview, Phone Interview, Skill Test, Presentation. It is also available for immediate download and adjustment. So, changes can be made in the color, design, graphics or any other component to create a unique layout.
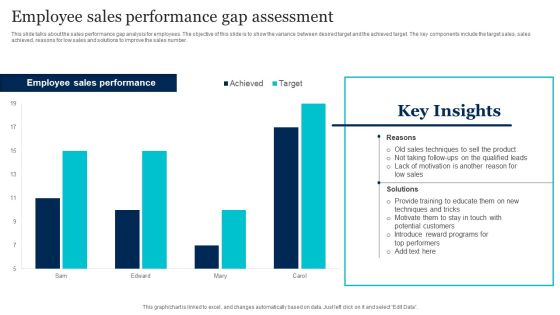
Employee Sales Performance Gap Assessment Template PDF
This slide talks about the sales performance gap analysis for employees. The objective of this slide is to show the variance between desired target and the achieved target. The key components include the target sales, sales achieved, reasons for low sales and solutions to improve the sales number. Showcasing this set of slides titled Employee Sales Performance Gap Assessment Template PDF. The topics addressed in these templates are Sales Techniques, Low Sales, Potential Customers. All the content presented in this PPT design is completely editable. Download it and make adjustments in color, background, font etc. as per your unique business setting.

Inbound And Outbound Marketing Tactics Impact After Implementing Inbound Outbound Summary PDF
This slide showcases the impact after implementing inbound and outbound marketing techniques. It includes impact on satisfaction rate, conversion rate, website traffic and profit. Want to ace your presentation in front of a live audience Our Inbound And Outbound Marketing Tactics Impact After Implementing Inbound Outbound Summary PDF can help you do that by engaging all the users towards you. Slidegeeks experts have put their efforts and expertise into creating these impeccable powerpoint presentations so that you can communicate your ideas clearly. Moreover, all the templates are customizable, and easy to edit and downloadable. Use these for both personal and commercial use.
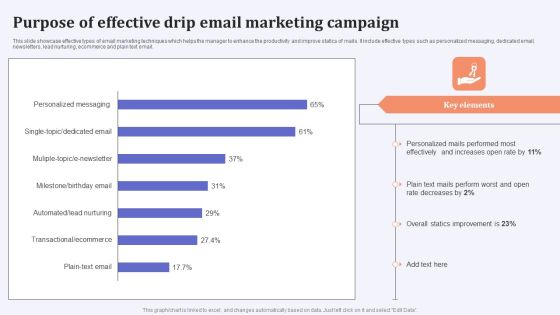
Purpose Of Effective Drip Email Marketing Campaign Brochure PDF
This slide showcase effective types of email marketing techniques which helps the manager to enhance the productivity and improve statics of mails. It include effective types such as personalized messaging, dedicated email, newsletters, lead nurturing, ecommerce and plain text email. Showcasing this set of slides titled Purpose Of Effective Drip Email Marketing Campaign Brochure PDF. The topics addressed in these templates are Personalized Mails, Rate Decreases, Overall Statics Improvement. All the content presented in this PPT design is completely editable. Download it and make adjustments in color, background, font etc. as per your unique business setting.
Business Process Flow Diagram Examples With Profit PowerPoint Templates Ppt Backgrounds For Slides
We present our business process flow diagram examples with profit PowerPoint templates PPT backgrounds for slides.Present our People PowerPoint Templates because Our PowerPoint Templates and Slides are aesthetically designed to attract attention. We gaurantee that they will grab all the eyeballs you need. Present our Globe PowerPoint Templates because Our PowerPoint Templates and Slides will let Your superior ideas hit the target always and everytime. Download and present our Success PowerPoint Templates because You are an avid believer in ethical practices. Highlight the benefits that accrue with our PowerPoint Templates and Slides. Use our Shapes PowerPoint Templates because Your ideas provide food for thought. Our PowerPoint Templates and Slides will help you create a dish to tickle the most discerning palate. Download and present our Business PowerPoint Templates because Our PowerPoint Templates and Slides will embellish your thoughts. See them provide the desired motivation to your team.Use these PowerPoint slides for presentations relating to 3d, Accounting, Advertising, Arrow, Bar, Business, Character, Computer, Concept, Diagram, Fast, Finance, Forecast, Gesture, Goal, Graph, Growth Chart, Hands, Human, Illustration, Income, Increase, Investment, Isolated, Marketing, Offer, People, Person, Present, Presentation, Profit, Progress, Render, Rise, Sale, Showing, Sign, Standing, Statistic, Successful, Up. The prominent colors used in the PowerPoint template are Blue light, Gray, White. PowerPoint presentation experts tell us our business process flow diagram examples with profit PowerPoint templates PPT backgrounds for slides are incredible easy to use. Professionals tell us our Computer PowerPoint templates and PPT Slides provide great value for your money. Be assured of finding the best projection to highlight your words. People tell us our business process flow diagram examples with profit PowerPoint templates PPT backgrounds for slides effectively help you save your valuable time. Presenters tell us our Business PowerPoint templates and PPT Slides are readymade to fit into any presentation structure. Professionals tell us our business process flow diagram examples with profit PowerPoint templates PPT backgrounds for slides are designed to make your presentations professional. We assure you our Bar PowerPoint templates and PPT Slides are topically designed to provide an attractive backdrop to any subject.

Manufacturing Operation Quality Improvement Practices Tools Templates Objectives And Key Results Of Manufacturing Information PDF
Purpose of the following slide is to show the objectives and key results that are expected to gain from the process of managing the manufacturing process. Presenting manufacturing operation quality improvement practices tools templates objectives and key results of manufacturing information pdf to provide visual cues and insights. Share and navigate important information on five stages that need your due attention. This template can be used to pitch topics like executive objectives, business strategies, project objectives, scope, results. In addtion, this PPT design contains high resolution images, graphics, etc, that are easily editable and available for immediate download.
Tips To Reduce HR Attrition Structure PDF
This slide provides various strategies to business managers for reducing employee turnover in order to save cost of recruiting and training new employees. Key elements covered are challenge, effect, strategy and result. Showcasing this set of slides titled Tips To Reduce HR Attrition Structure PDF. The topics addressed in these templates are Strategy, Reduced Productivity, Lack Of Career Growth. All the content presented in this PPT design is completely editable. Download it and make adjustments in color, background, font etc. as per your unique business setting.

Chart Of Four Business Steps Powerpoint Templates
This business diagram displays flow of four business steps. This editable slide is suitable to present growth management. Use this diagram for business and finance related topics and display complete data analysis in your presentation.
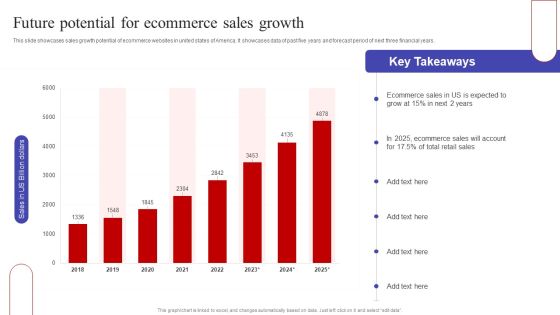
Future Potential For Ecommerce Sales Growth Ppt PowerPoint Presentation Diagram Graph Charts PDF
This slide showcases sales growth potential of ecommerce websites in united states of America. It showcases data of past five years and forecast period of next three financial years. Here you can discover an assortment of the finest PowerPoint and Google Slides templates. With these templates, you can create presentations for a variety of purposes while simultaneously providing your audience with an eye catching visual experience. Download Future Potential For Ecommerce Sales Growth Ppt PowerPoint Presentation Diagram Graph Charts PDF to deliver an impeccable presentation. These templates will make your job of preparing presentations much quicker, yet still, maintain a high level of quality. Slidegeeks has experienced researchers who prepare these templates and write high quality content for you. Later on, you can personalize the content by editing the Future Potential For Ecommerce Sales Growth Ppt PowerPoint Presentation Diagram Graph Charts PDF.

Nestle Performance Management Report Pie Chart Ppt Ideas Graphics Example PDF
This graph or chart is linked to excel, and changes automatically based on data. Just left click on it and select Edit Data. Are you in need of a template that can accommodate all of your creative concepts This one is crafted professionally and can be altered to fit any style. Use it with Google Slides or PowerPoint. Include striking photographs, symbols, depictions, and other visuals. Fill, move around, or remove text boxes as desired. Test out color palettes and font mixtures. Edit and save your work, or work with colleagues. Download Nestle Performance Management Report Pie Chart Ppt Ideas Graphics Example PDF and observe how to make your presentation outstanding. Give an impeccable presentation to your group and make your presentation unforgettable.

Problems Related To Current Product Positioning Ppt PowerPoint Presentation Diagram Graph Charts PDF
This slide highlights the problems related to current product positioning which showcases in graphical format depicting downgrading product sales and changing consumer trends. Do you have an important presentation coming up Are you looking for something that will make your presentation stand out from the rest Look no further than Problems Related To Current Product Positioning Ppt PowerPoint Presentation Diagram Graph Charts PDF. With our professional designs, you can trust that your presentation will pop and make delivering it a smooth process. And with Slidegeeks, you can trust that your presentation will be unique and memorable. So why wait Grab Problems Related To Current Product Positioning Ppt PowerPoint Presentation Diagram Graph Charts PDF today and make your presentation stand out from the rest

Data Driven Chart For Workers Turnover Assessment In Various Sectors Ppt PowerPoint Presentation Layouts Demonstration PDF
Presenting this set of slides with name data driven chart for workers turnover assessment in various sectors ppt powerpoint presentation layouts demonstration pdf. The topics discussed in these slides are share of workers quitting position annually, share of workers let go annually, leisure and hospitality, food services, manufacturing, construction. This is a completely editable PowerPoint presentation and is available for immediate download. Download now and impress your audience.

Famous Technology Trends Charts With Multichannel Analytics Ppt PowerPoint Presentation Ideas Graphics Tutorials PDF
Pitch your topic with ease and precision using this famous technology trends charts with multichannel analytics ppt powerpoint presentation ideas graphics tutorials pdf. This layout presents information on multichannel analytics, content marketing, paid media, social media marketing, email marketing . It is also available for immediate download and adjustment. So, changes can be made in the color, design, graphics or any other component to create a unique layout.
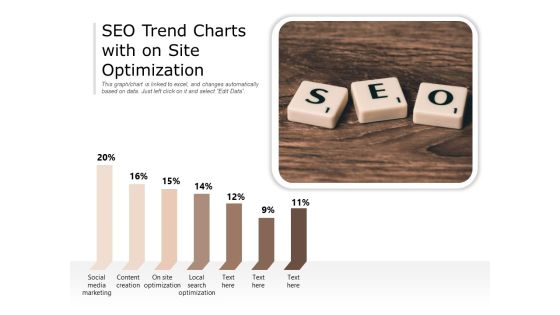
SEO Trend Charts With On Site Optimization Ppt PowerPoint Presentation Gallery Inspiration PDF
Pitch your topic with ease and precision using this seo trend charts with on site optimization ppt powerpoint presentation gallery inspiration pdf. This layout presents information on social media marketing, content creation, site optimization, local search optimization. It is also available for immediate download and adjustment. So, changes can be made in the color, design, graphics or any other component to create a unique layout.
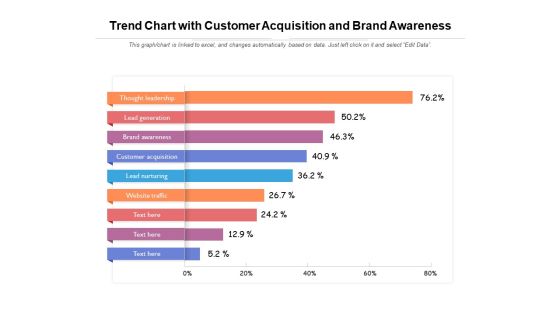
Trend Chart With Customer Acquisition And Brand Awareness Ppt PowerPoint Presentation Show Samples PDF
Pitch your topic with ease and precision using this trend chart with customer acquisition and brand awareness ppt powerpoint presentation show samples pdf. This layout presents information on thought leadership, lead generation, brand awareness, customer acquisition, lead nurturing. It is also available for immediate download and adjustment. So, changes can be made in the color, design, graphics or any other component to create a unique layout.
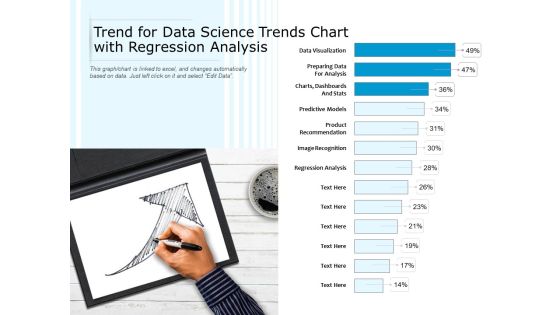
Trend For Data Science Trends Chart With Regression Analysis Ppt PowerPoint Presentation Visual Aids Layouts PDF
Showcasing this set of slides titled trend for data science trends chart with regression analysis ppt powerpoint presentation visual aids layouts pdf. The topics addressed in these templates are data visualization, preparing data for analysis, dashboards and stats, predictive models. All the content presented in this PPT design is completely editable. Download it and make adjustments in color, background, font etc. as per your unique business setting.

Chart Indicating United States Marine Corps Yearly Attrition Rate Ppt PowerPoint Presentation File Background Images PDF
Pitch your topic with ease and precision using this chart indicating united states marine corps yearly attrition rate ppt powerpoint presentation file background images pdf. This layout presents information on hart indicating united states marine corps yearly attrition rate. It is also available for immediate download and adjustment. So, changes can be made in the color, design, graphics or any other component to create a unique layout.

Business Profile Of It Company With Financial Charts Ppt PowerPoint Presentation Model Ideas PDF
Deliver and pitch your topic in the best possible manner with this business profile of it company with financial charts ppt powerpoint presentation model ideas pdf. Use them to share invaluable insights on the company reported strong financials in last five years, operating income, net income and impress your audience. This template can be altered and modified as per your expectations. So, grab it now.
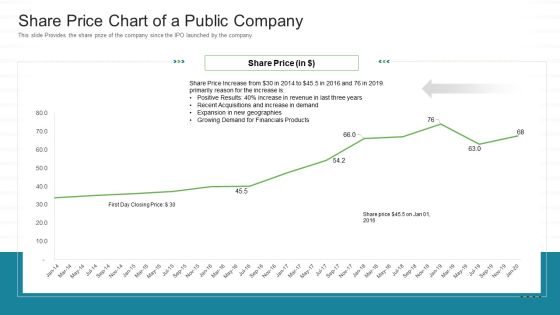
Investor Pitch Stock Market Launch Financial Institutions Share Price Chart Of A Public Company Sample PDF
This slide Provides the share prize of the company since the IPO launched by the company. Deliver and pitch your topic in the best possible manner with this investor pitch stock market launch financial institutions share price chart of a public company sample pdf. Use them to share invaluable insights on growing demand, financials products, share price and impress your audience. This template can be altered and modified as per your expectations. So, grab it now.
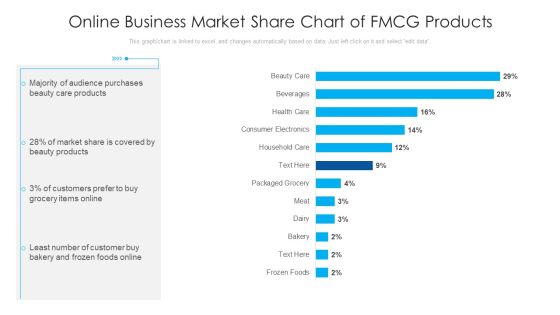
Online Business Market Share Chart Of Fmcg Products Ppt PowerPoint Presentation Portfolio Format Ideas PDF
Showcasing this set of slides titled online business market share chart of fmcg products ppt powerpoint presentation portfolio format ideas pdf. The topics addressed in these templates are majority of audience purchases, grocery items online, beauty care products. All the content presented in this PPT design is completely editable. Download it and make adjustments in color, background, font etc. as per your unique business setting.
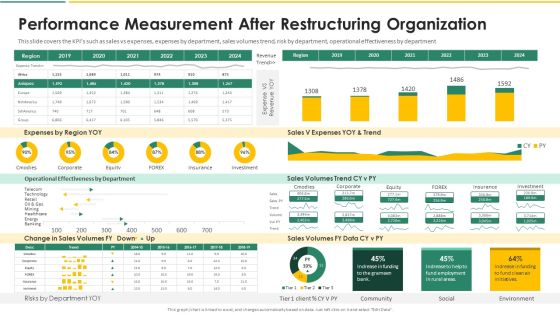
Organization Chart And Corporate Model Transformation Performance Measurement After Slides PDF
This slide covers the KPIs such as sales vs expenses, expenses by department, sales volumes trend, risk by department, operational effectiveness by department. Deliver and pitch your topic in the best possible manner with this organization chart and corporate model transformation performance measurement after slides pdf. Use them to share invaluable insights on operational effectiveness by department, expenses by region yoy, sales volumes trend and impress your audience. This template can be altered and modified as per your expectations. So, grab it now.

Organization Chart And Corporate Model Transformation Restructuring Organization Results Elements PDF
This is an analysis carried out to capture the overall experience of the Restructuring Organization process. On the views such as strongly agree, agree, disagree, strongly disagree. Deliver an awe inspiring pitch with this creative organization chart and corporate model transformation restructuring organization results elements pdf bundle. Topics like effective, involvement, organizations can be discussed with this completely editable template. It is available for immediate download depending on the needs and requirements of the user.

Brand Comparative Analysis Chart With Market Size And Pricing Model Pictures PDF
This slide illustrates comparative analysis of brands of XYZ product. It includes their market size, key features of these brands.Showcasing this set of slides titled Brand Comparative Analysis Chart With Market Size And Pricing Model Pictures PDF. The topics addressed in these templates are Pricing Model, Competitive Pricing, Market Size. All the content presented in this PPT design is completely editable. Download it and make adjustments in color, background, font etc. as per your unique business setting.

Market Chart Showing Revenue Breakdown Of IT Products Ppt File Elements PDF
This slide shows the revenue comparison graph of IT products over last six months. IT products covered in the slide are hardware and software. Pitch your topic with ease and precision using this Market Chart Showing Revenue Breakdown Of IT Products Ppt File Elements PDF. This layout presents information on Hardware, Software, Key Insights. It is also available for immediate download and adjustment. So, changes can be made in the color, design, graphics or any other component to create a unique layout.
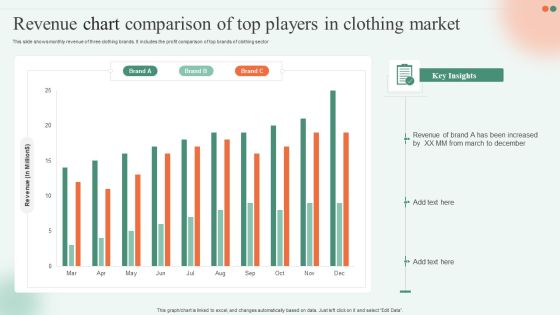
Revenue Chart Comparison Of Top Players In Clothing Market Ppt Infographics Skills PDF
This slide shows monthly revenue of three clothing brands. It includes the profit comparison of top brands of clothing sector Showcasing this set of slides titled Revenue Chart Comparison Of Top Players In Clothing Market Ppt Infographics Skills PDF. The topics addressed in these templates are Revenue, Brand, Key Insights. All the content presented in this PPT design is completely editable. Download it and make adjustments in color, background, font etc. as per your unique business setting.
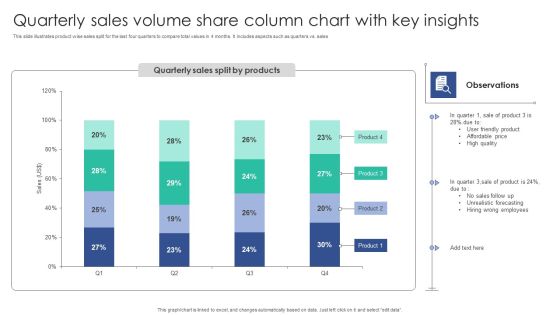
Quarterly Sales Volume Share Column Chart With Key Insights Structure PDF
This slide illustrates product wise sales split for the last four quarters to compare total values in 4 months. It includes aspects such as quarters vs. salesShowcasing this set of slides titled Quarterly Sales Volume Share Column Chart With Key Insights Structure PDF. The topics addressed in these templates are Unrealistic Forecasting, Wrong Employees, Friendly Product. All the content presented in this PPT design is completely editable. Download it and make adjustments in color, background, font etc. as per your unique business setting.

Clustered Column Chart Opening Retail Store In Untapped Industry For Sales Growth Mockup PDF
Want to ace your presentation in front of a live audience Our Clustered Column Chart Opening Retail Store In Untapped Industry For Sales Growth Mockup PDF can help you do that by engaging all the users towards you.. Slidegeeks experts have put their efforts and expertise into creating these impeccable powerpoint presentations so that you can communicate your ideas clearly. Moreover, all the templates are customizable, and easy-to-edit and downloadable. Use these for both personal and commercial use.
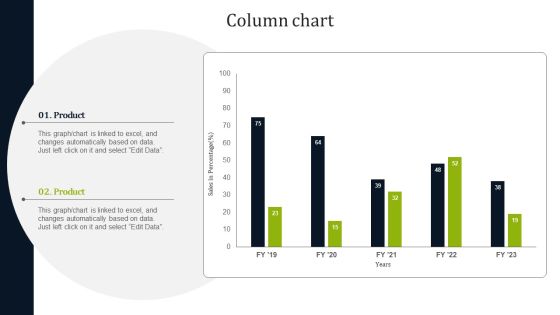
Column Chart Introducing New Commodities Through Product Line Extension Mockup PDF
From laying roadmaps to briefing everything in detail, our templates are perfect for you. You can set the stage with your presentation slides. All you have to do is download these easy-to-edit and customizable templates. Column Chart Introducing New Commodities Through Product Line Extension Mockup PDF will help you deliver an outstanding performance that everyone would remember and praise you for. Do download this presentation today.
