Resource Mapping

Financial Due Diligence Ppt PowerPoint Presentation Infographic Template Brochure
This is a financial due diligence ppt powerpoint presentation infographic template brochure. This is a one stage process. The stages in this process are business, marketing, diligence, finance, strategy.

Insurance Antitrust And Regulatory Issues Ppt PowerPoint Presentation Gallery Graphics Design
This is a insurance antitrust and regulatory issues ppt powerpoint presentation gallery graphics design. This is a one stage process. The stages in this process are insurance, antitrust and regulatory issues, business, marketing, finance.

Key Financial Ratios Template 1 Ppt PowerPoint Presentation Professional Samples
This is a key financial ratios template 1 ppt powerpoint presentation professional samples. This is a four stage process. The stages in this process are debt to equity ratio, current ratio, return on assets, business, marketing, finance.
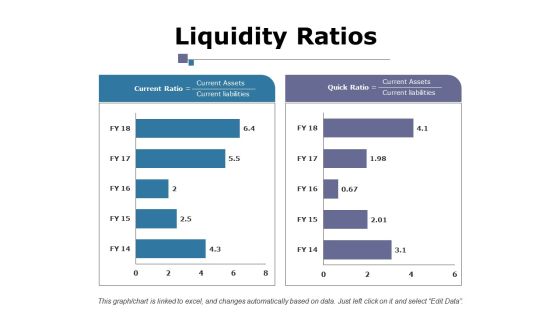
Liquidity Ratios Ppt PowerPoint Presentation Layouts Example File
This is a liquidity ratios ppt powerpoint presentation layouts example file. This is a two stage process. The stages in this process are business, current ratio, quick ratio, marketing, finance, graph.
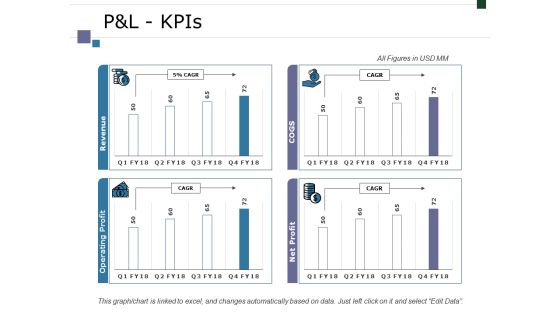
Pandl Kpis Ppt PowerPoint Presentation Infographic Template Graphics Tutorials
This is a pandl kpis ppt powerpoint presentation infographic template graphics tutorials. This is a four stage process. The stages in this process are business, marketing, finance, graph, strategy.
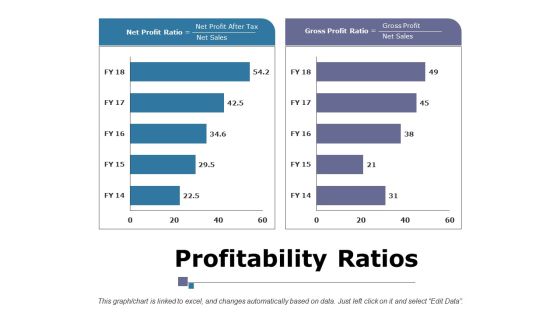
Profitability Ratios Ppt PowerPoint Presentation Infographic Template Portrait
This is a profitability ratios ppt powerpoint presentation infographic template portrait. This is a two stage process. The stages in this process are business, marketing, finance, net profit ratio, gross profit ratio.
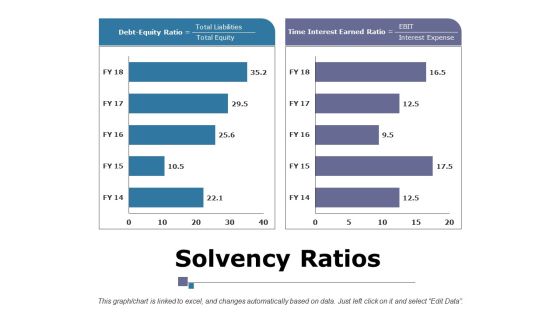
Solvency Ratios Ppt PowerPoint Presentation Summary Layouts
This is a solvency ratios ppt powerpoint presentation summary layouts. This is a two stage process. The stages in this process are business, marketing, strategy, debt equity ratio, time interest earned ratio, finance.
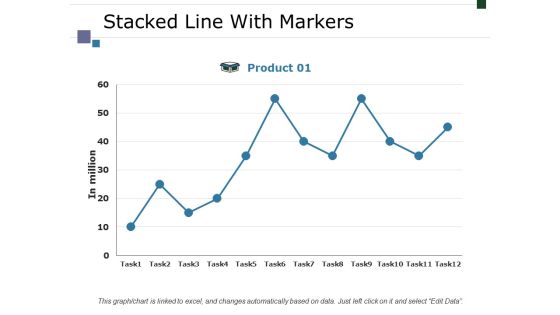
Stacked Line With Markers Ppt PowerPoint Presentation Layouts Display
This is a stacked line with markers ppt powerpoint presentation layouts display. This is a one stage process. The stages in this process are business, marketing, strategy, in million, finance.

Financial Compatibility Ppt PowerPoint Presentation Infographic Template Slide Download
This is a financial compatibility ppt powerpoint presentation infographic template slide download. This is a three stage process. The stages in this process are business, icons, marketing, strategy, process, finance.

Clustered Bar Ppt PowerPoint Presentation Styles Graphics
This is a clustered bar ppt powerpoint presentation styles graphics. This is a three stage process. The stages in this process are business, marketing, finance, graph, strategy, unit count.

Activity Ratios Ppt PowerPoint Presentation Summary Mockup
This is a activity ratios ppt powerpoint presentation summary mockup. This is a two stage process. The stages in this process are business, inventory turnover, receivables turnover, marketing, finance.

Area Chart Ppt PowerPoint Presentation Slides Master Slide
This is a area chart ppt powerpoint presentation slides master slide. This is a two stage process. The stages in this process are business, marketing, area chart, finance, strategy.

Liquidity Ratios Ppt PowerPoint Presentation Layouts Gridlines
This is a liquidity ratios ppt powerpoint presentation layouts gridlines. This is a two stage process. The stages in this process are business, marketing, current ratio, quick ratio, finance.

Activity Ratios Ppt PowerPoint Presentation Styles Infographic Template
This is a activity ratios ppt powerpoint presentation styles infographic template. This is a two stage process. The stages in this process are inventory turnover, receivables turnover, business, marketing, finance.

Cash Flow Statement Kpis Ppt PowerPoint Presentation Pictures Graphics
This is a cash flow statement kpis ppt powerpoint presentation pictures graphics. This is a four stage process. The stages in this process are business, marketing, graph, finance, strategy.

Clustered Bar Ppt PowerPoint Presentation Pictures Clipart Images
This is a clustered bar ppt powerpoint presentation pictures clipart images. This is a three stage process. The stages in this process are business, marketing, graph, finance, strategy, unit count.
Financial Due Diligence Ppt PowerPoint Presentation Icon Pictures
This is a financial due diligence ppt powerpoint presentation icon pictures. This is a one stage process. The stages in this process are business, marketing, due diligence, finance, strategy.
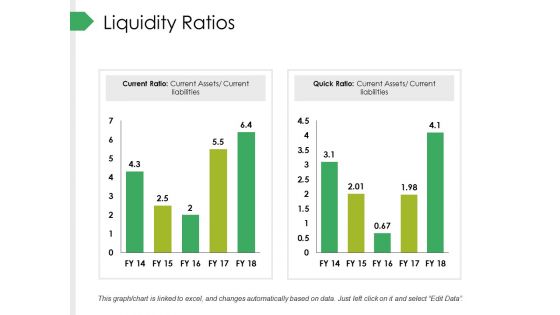
Liquidity Ratios Ppt PowerPoint Presentation Infographic Template Ideas
This is a liquidity ratios ppt powerpoint presentation infographic template ideas. This is a two stage process. The stages in this process are business, marketing, current ratio, quick ratio, finance.
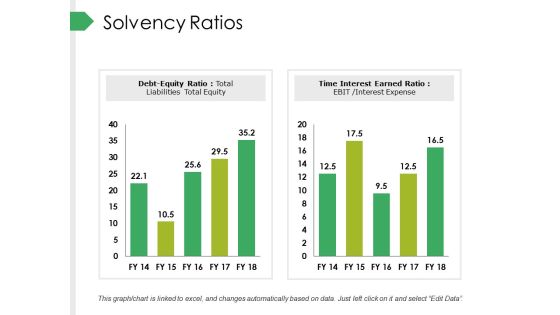
Solvency Ratios Ppt PowerPoint Presentation Outline Ideas
This is a solvency ratios ppt powerpoint presentation outline ideas. This is a two stage process. The stages in this process are business, marketing, debt equity ratio, time interest earned ratio, finance.

Stacked Line With Markers Ppt PowerPoint Presentation Pictures Design Templates
This is a stacked line with markers ppt powerpoint presentation pictures design templates. This is a one stage process. The stages in this process are business, marketing, finance, in million, graph.

P And L Kpis Tabular Form Ppt PowerPoint Presentation Pictures Gallery
This is a p and l kpis tabular form ppt powerpoint presentation pictures gallery. This is a four stage process. The stages in this process are business, marketing, graph, strategy, finance.

The Strategy Of Innovation Template 2 Ppt PowerPoint Presentation Professional Graphic Images
This is a the strategy of innovation template 2 ppt powerpoint presentation professional graphic images. This is a three stage process. The stages in this process are business, area chart, finance, marketing, strategy.

Competitor Comparison Template 1 Ppt PowerPoint Presentation Infographic Template Mockup
This is a competitor comparison template 1 ppt powerpoint presentation infographic template mockup. This is a five stage process. The stages in this process are business, marketing, graph, finance, strategy.

Competitor Comparison Template 2 Ppt PowerPoint Presentation Infographics Objects
This is a competitor comparison template 2 ppt powerpoint presentation infographics objects. This is a five stage process. The stages in this process are business, marketing, graph, finance, strategy.
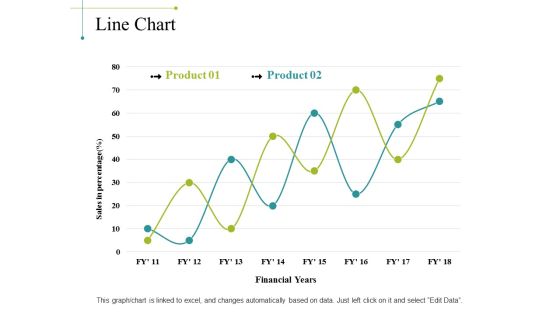
Line Chart Ppt PowerPoint Presentation Portfolio Background Image
This is a line chart ppt powerpoint presentation portfolio background image. This is a two stage process. The stages in this process are sales in percentage, financial years, chart, business, marketing, finance.

Bar Graph Ppt PowerPoint Presentation Summary Format
This is a bar graph ppt powerpoint presentation summary format. This is a three stage process. The stages in this process are bar graph, business, marketing, years, percentage, finance.

Competitor Comparison Template 1 Ppt PowerPoint Presentation Layouts Slide Portrait
This is a competitor comparison template 1 ppt powerpoint presentation layouts slide portrait. This is a four stage process. The stages in this process are business, marketing, graph, finance, strategy.

Competitor Comparison Template 2 Ppt PowerPoint Presentation Inspiration Images
This is a competitor comparison template 2 ppt powerpoint presentation inspiration images. This is a five stage process. The stages in this process are business, marketing, graph, finance, strategy.

Area Chart Ppt PowerPoint Presentation Ideas Professional
This is a area chart ppt powerpoint presentation ideas professional. This is a two stage process. The stages in this process are business, sales in percentage, area chart, marketing, finance.

Column Chart Ppt PowerPoint Presentation Outline Design Ideas
This is a column chart ppt powerpoint presentation outline design ideas. This is a two stage process. The stages in this process are business, years, expenditure in, marketing, finance.

Revenue Split By Product Segment Template 2 Ppt PowerPoint Presentation Gallery Example File
This is a revenue split by product segment template 2 ppt powerpoint presentation gallery example file. This is a four stage process. The stages in this process are business, marketing, graph, finance, revenue split.

Clustered Column Ppt PowerPoint Presentation Inspiration Introduction
This is a clustered column ppt powerpoint presentation inspiration introduction. This is a two stage process. The stages in this process are business, marketing, in percentage, finance, graph, strategy.

Area Chart Ppt PowerPoint Presentation Outline Graphics Pictures
This is a area chart ppt powerpoint presentation outline graphics pictures. This is a two stage process. The stages in this process are financial year, in percentage, business, marketing, finance.

Bar Chart Ppt PowerPoint Presentation Layouts Template
This is a bar chart ppt powerpoint presentation layouts template. This is a two stage process. The stages in this process are financial year, sales in percentage, business, marketing, finance.
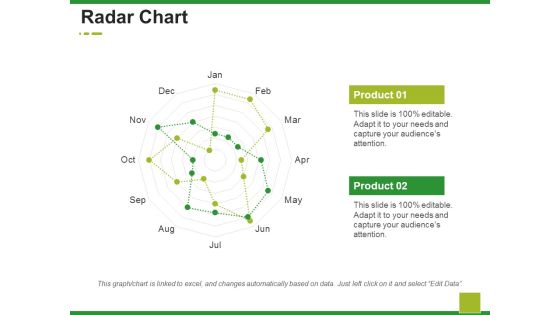
Radar Chart Ppt PowerPoint Presentation Ideas Design Ideas
This is a radar chart ppt powerpoint presentation ideas design ideas. This is a two stage process. The stages in this process are business, marketing, radar chart, finance, strategy.

Area Chart Ppt PowerPoint Presentation Layouts Graphic Images
This is a area chart ppt powerpoint presentation layouts graphic images. This is a three stage process. The stages in this process are business, in years, marketing, in percentage, finance, graph.

Bar Graph Ppt PowerPoint Presentation Layouts Influencers
This is a bar graph ppt powerpoint presentation layouts influencers. This is a two stage process. The stages in this process are business, marketing, in bar graph, sales in percentage, finance.

Clustered Bar Ppt PowerPoint Presentation Icon Professional
This is a clustered bar ppt powerpoint presentation icon professional. This is a two stage process. The stages in this process are business, marketing, profit, clustered bar, finance, strategy.

Revenue Split By Product Segment Template 2 Ppt PowerPoint Presentation Summary Good
This is a revenue split by product segment template 2 ppt powerpoint presentation summary good. This is a four stage process. The stages in this process are business, marketing, finance, strategy, graph.
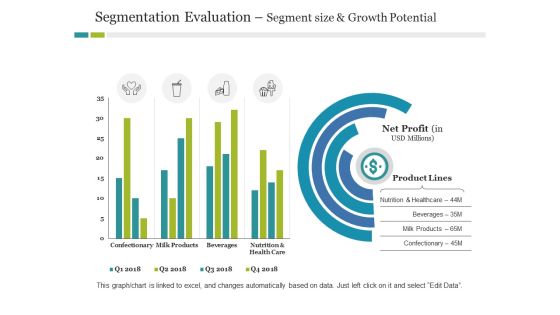
Segmentation Evaluation Segment Size And Growth Potential Ppt PowerPoint Presentation Infographic Template Outline
This is a segmentation evaluation segment size and growth potential ppt powerpoint presentation infographic template outline. This is a two stage process. The stages in this process are business, product lines, finance, marketing, strategy.
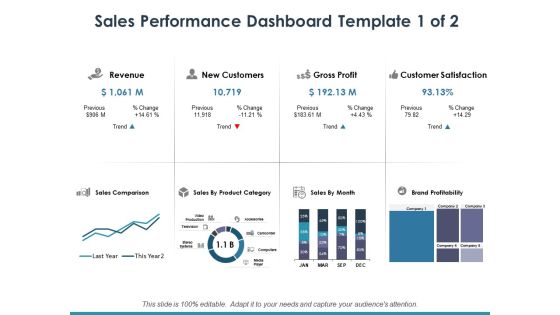
Sales Performance Dashboard Template 1 Ppt PowerPoint Presentation Infographic Template Maker
This is a sales performance dashboard template 1 ppt powerpoint presentation infographic template maker. This is a eight stage process. The stages in this process are dollar, business, finance, marketing.
Sales Target For Current Financial Year Ppt PowerPoint Presentation File Professional
This is a sales target for current financial year ppt powerpoint presentation file professional. This is a four stage process. The stages in this process are dollar, business, finance, marketing, currency.

Area Chart Ppt PowerPoint Presentation Inspiration Background Designs
This is a area chart ppt powerpoint presentation inspiration background designs. This is a two stage process. The stages in this process are business, sales in percentage, area chart, marketing, finance.

Clustered Column Line Ppt PowerPoint Presentation Model Graphics Tutorials
This is a clustered column line ppt powerpoint presentation model graphics tutorials. This is a three stage process. The stages in this process are business, marketing, in percentage, finance, graph.
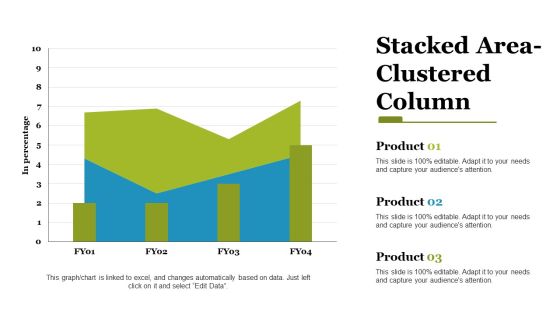
stacked area clustered column ppt powerpoint presentation styles files
This is a stacked area clustered column ppt powerpoint presentation styles files. This is a three stage process. The stages in this process are stacked area, clustered column, finance, marketing, strategy, business.

Area Chart Ppt PowerPoint Presentation Layouts Background Designs
This is a area chart ppt powerpoint presentation layouts background designs. This is a two stage process. The stages in this process are business, marketing, in percentage, area chart, finance.
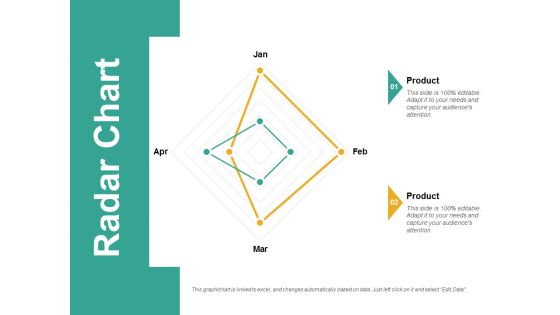
Radar Chart Ppt PowerPoint Presentation Visual Aids Professional
This is a radar chart ppt powerpoint presentation visual aids professional. This is a two stage process. The stages in this process are radar chart, finance, marketing, strategy, business.

Column Chart Template 1 Ppt PowerPoint Presentation Portfolio Format
This is a column chart template 1 ppt powerpoint presentation portfolio format. This is a two stage process. The stages in this process are column chart, finance, marketing, strategy, business.
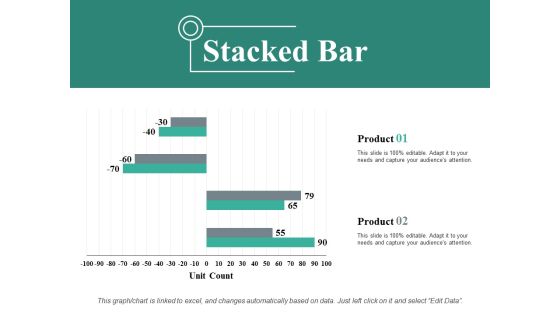
Stacked Bar Ppt PowerPoint Presentation Show Background Designs
This is a stacked bar ppt powerpoint presentation show background designs. This is a two stage process. The stages in this process are stacked bar, business, marketing, finance, unit count.

Area Chart Ppt PowerPoint Presentation Infographic Template Designs
This is a area chart ppt powerpoint presentation infographic template designs. This is a two stage process. The stages in this process are area chart, finance, marketing, strategy, business.
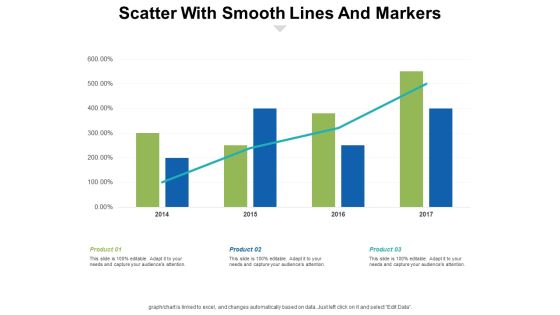
Scatter With Smooth Lines And Markers Ppt PowerPoint Presentation Layouts File Formats
This is a scatter with smooth lines and markers ppt powerpoint presentation layouts file formats. This is a three stage process. The stages in this process are finance, business, marketing, planning, strategy, business.

Financial Ppt PowerPoint Presentation Inspiration Slide Download Ppt PowerPoint Presentation Slides Background Images
This is a financial ppt powerpoint presentation inspiration slide download ppt powerpoint presentation slides background images. This is a three stage process. The stages in this process are business, finance, marketing, percentage, management.
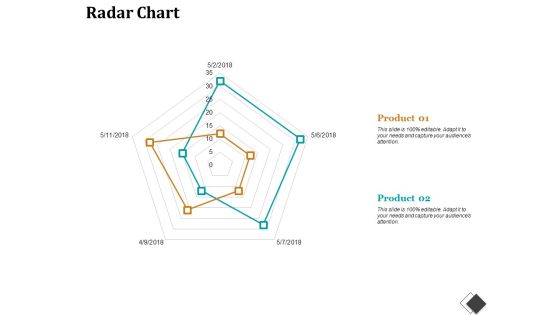
Radar Chart Enterprise Model Canvas Ppt PowerPoint Presentation File Slides
This is a radar chart enterprise model canvas ppt powerpoint presentation file slides. This is a two stage process. The stages in this process are radar chart, finance, marketing, strategy, business.
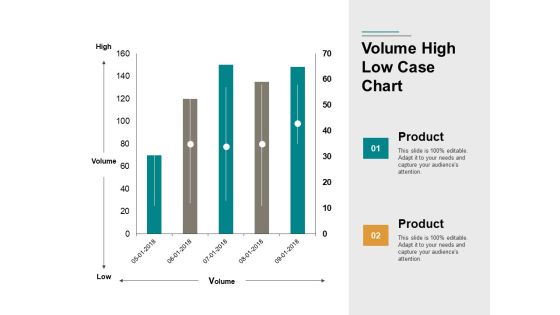
Volume High Low Case Chart Ppt PowerPoint Presentation Portfolio Images
This is a volume high low case chart ppt powerpoint presentation portfolio images. This is a two stage process. The stages in this process are finance, business, marketing, management.
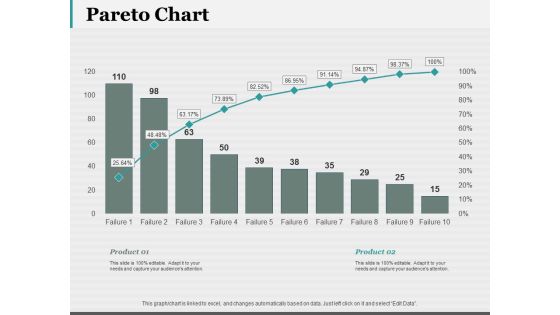
Pareto Chart Ppt PowerPoint Presentation Visual Aids Pictures
This is a pareto chart ppt powerpoint presentation visual aids pictures. This is a two stage process. The stages in this process are pareto chart, finance, marketing, strategy, business.
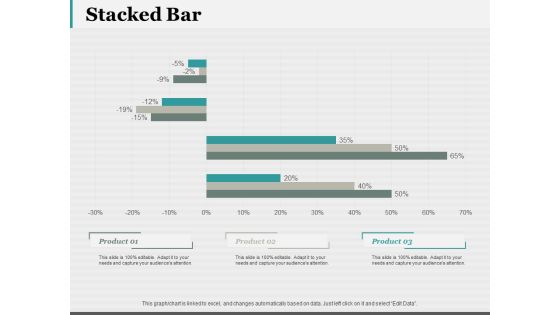
Stacked Bar 7 QC Tools Ppt PowerPoint Presentation Portfolio Smartart
This is a stacked bar 7 qc tools ppt powerpoint presentation portfolio smartart. This is a three stage process. The stages in this process are stacked bar, finance, marketing, strategy, business.
Stacked Column 7 QC Tools Ppt PowerPoint Presentation Icon
This is a stacked column 7 qc tools ppt powerpoint presentation icon. This is a three stage process. The stages in this process are stacked column, finance, marketing, strategy, business.

Combo Chart Process Ppt PowerPoint Presentation Model Clipart
This is a combo chart process ppt powerpoint presentation model clipart. This is a two stage process. The stages in this process are combo chart, finance, marketing, strategy, business.

Financial About New Product Ppt PowerPoint Presentation Infographic Template Objects
This is a financial about new product ppt powerpoint presentation infographic template objects. This is a three stage process. The stages in this process are dollar, business, finance, marketing.

Profitability Analysis Average Market Scenario Pictures PDF
The slide shows the profitability of the company after implementing the strategy. Key factors include additional products sold, additional revenue, total cost and profit estimation etc. Deliver an awe-inspiring pitch with this creative profitability analysis average market scenario pictures pdf. bundle. Topics like profitability analysis average market scenario can be discussed with this completely editable template. It is available for immediate download depending on the needs and requirements of the user.
 Home
Home