Resource Mapping

Earning Per Share Ppt PowerPoint Presentation Slides Smartart
This is a earning per share ppt powerpoint presentation slides smartart. This is a five stage process. The stages in this process are earning per share, finance, marketing, strategy, business.
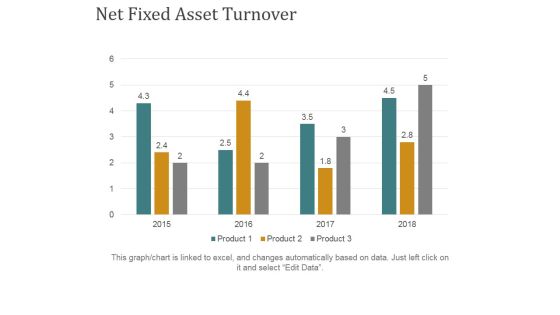
Net Fixed Asset Turnover Ppt PowerPoint Presentation Ideas Grid
This is a net fixed asset turnover ppt powerpoint presentation ideas grid. This is a four stage process. The stages in this process are business, finance, marketing, bar graph, strategy.
Real Estate Home Sales Ppt PowerPoint Presentation Icon Graphics Design
This is a real estate home sales ppt powerpoint presentation icon graphics design. This is a one stage process. The stages in this process are business, growth, finance, marketing, strategy.
Real Estate Prices Activity Ppt PowerPoint Presentation Icon File Formats
This is a real estate prices activity ppt powerpoint presentation icon file formats. This is a four stage process. The stages in this process are business, finance, marketing, strategy, prices.
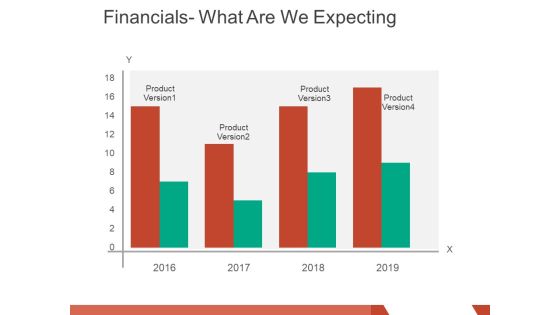
financials what are we expecting ppt powerpoint presentation layouts graphics pictures
This is a financials what are we expecting ppt powerpoint presentation layouts graphics pictures. This is a four stage process. The stages in this process are product version, business, marketing, finance, graph.

Clustered Bar Graph Ppt PowerPoint Presentation Gallery Graphics Example
This is a clustered bar graph ppt powerpoint presentation gallery graphics example. This is a three stage process. The stages in this process are clustered bar graph, finance, marketing, strategy, business.

Pie Chart Ppt PowerPoint Presentation Infographic Template Example 2015
This is a pie chart ppt powerpoint presentation infographic template example 2015. This is a five stage process. The stages in this process are pie chart, finance, marketing, strategy, business.
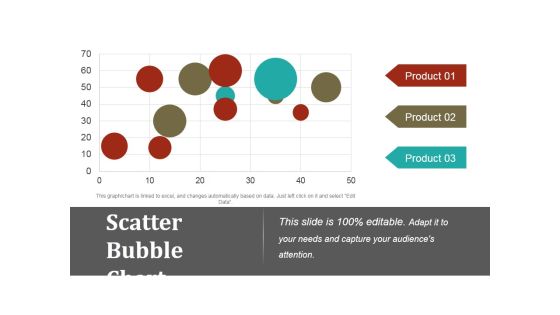
Scatter Bubble Chart Ppt PowerPoint Presentation Outline Rules
This is a scatter bubble chart ppt powerpoint presentation outline rules. This is a three stage process. The stages in this process are scatter bubble chart, product, finance, marketing, business.

Stacked Column Chart Ppt PowerPoint Presentation Infographics Smartart
This is a stacked column chart ppt powerpoint presentation infographics smartart. This is a two stage process. The stages in this process are stacked column chart, business, finance, marketing, strategy.

High Low Close Chart Ppt PowerPoint Presentation Layouts Guide
This is a high low close chart ppt powerpoint presentation layouts guide. This is a ten stage process. The stages in this process are high, volume, low, business, marketing, finance.
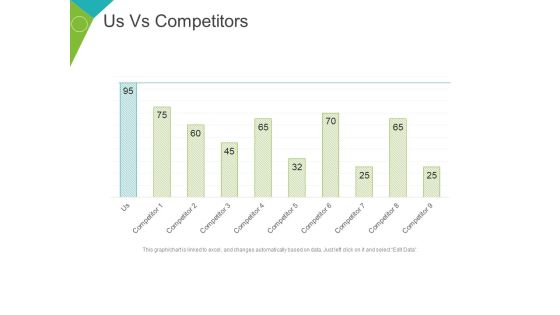
Us Vs Competitors Template 2 Ppt PowerPoint Presentation File Show
This is a us vs competitors template 2 ppt powerpoint presentation file show. This is a nine stage process. The stages in this process are competitor, graph, business, marketing, finance.

Portfolio Evaluation Template 1 Ppt PowerPoint Presentation Slides Professional
This is a portfolio evaluation template 1 ppt powerpoint presentation slides professional. This is a one stage process. The stages in this process are portfolio evaluation, finance, marketing, strategy, business.

Portfolio Selection Allocation Template 1 Ppt PowerPoint Presentation Infographic Template Guidelines
This is a portfolio selection allocation template 1 ppt powerpoint presentation infographic template guidelines. This is a two stage process. The stages in this process are business, finance, marketing, strategy, comparison, success.

Monthly Run Revenue Ppt PowerPoint Presentation Ideas Graphics Template
This is a monthly run revenue ppt powerpoint presentation ideas graphics template. This is a two stage process. The stages in this process are business, finance, marketing, management, graph.

Project Progress And Reasons For Delay Ppt PowerPoint Presentation Pictures Influencers
This is a project progress and reasons for delay ppt powerpoint presentation pictures influencers. This is a two stage process. The stages in this process are graph, percentage, finance, business, marketing.
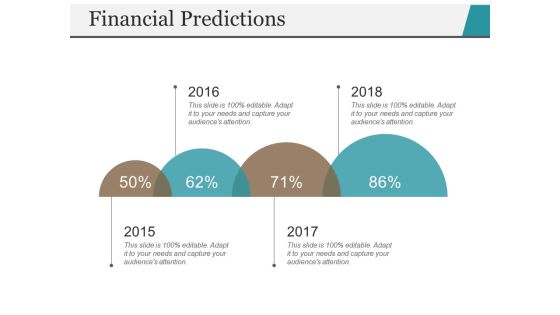
Financial Predictions Template 1 Ppt PowerPoint Presentation Slides File Formats
This is a financial predictions template 1 ppt powerpoint presentation slides file formats. This is a four stage process. The stages in this process are percentage, years, finance, business, marketing.

Area Chart Ppt PowerPoint Presentation Slides Rules
This is a area chart ppt powerpoint presentation slides rules. This is a two stage process. The stages in this process are sales in percentage, business, marketing, product, finance.

Bubble Chart Ppt PowerPoint Presentation Icon Slides
This is a bubble chart ppt powerpoint presentation icon slides. This is a three stage process. The stages in this process are product, finance, business, marketing, bubble chart .
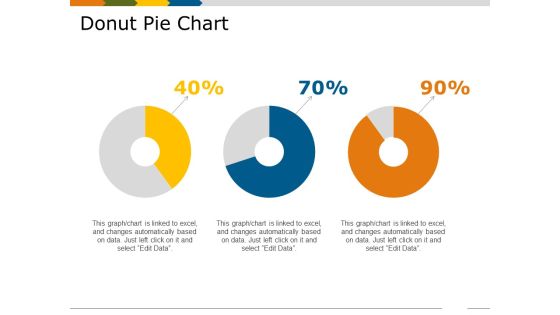
Donut Pie Chart Template 2 Ppt PowerPoint Presentation Show Skills
This is a donut pie chart template 2 ppt powerpoint presentation show skills. This is a three stage process. The stages in this process are percentage, business, marketing, process, finance.

Area Stacked Ppt PowerPoint Presentation Diagram Images
This is a area stacked ppt powerpoint presentation diagram images. This is a two stage process. The stages in this process are sales in percentage, product, business, marketing, finance.

Clustered Column Line Ppt PowerPoint Presentation Infographics Templates
This is a clustered column line ppt powerpoint presentation infographics templates. This is a three stage process. The stages in this process are in percentage, business, marketing, product, finance, graph.

Clustered Column Ppt PowerPoint Presentation Slides Ideas
This is a clustered column ppt powerpoint presentation slides ideas. This is a two stage process. The stages in this process are sales in percentage, business, marketing, finance, graph.

High Low Close Chart Ppt PowerPoint Presentation Ideas Brochure
This is a high low close chart ppt powerpoint presentation ideas brochure. This is a three stage process. The stages in this process are in percentage, product, business, marketing, finance.

Line Chart Ppt PowerPoint Presentation Professional Ideas
This is a line chart ppt powerpoint presentation professional ideas. This is a two stage process. The stages in this process are in percentage, product, business, marketing, finance, percentage.
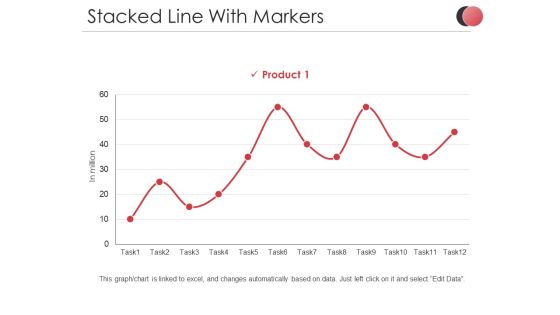
Stacked Line With Markers Ppt PowerPoint Presentation Slides Demonstration
This is a stacked line with markers ppt powerpoint presentation slides demonstration. This is a one stage process. The stages in this process are in million, product, percentage, business, marketing, finance.

Logistics And It Ppt PowerPoint Presentation Show Vector
This is a logistics and it ppt powerpoint presentation show vector. This is a three stage process. The stages in this process are transportation medium, transportation challenges, finance, business, marketing.

Donut Pie Chart Ppt PowerPoint Presentation Infographics Background Designs
This is a donut pie chart ppt powerpoint presentation infographics background designs. This is a three stage process. The stages in this process are finance, business, marketing, strategy, percentage.

Sales Forecasting Template 2 Ppt PowerPoint Presentation Infographic Template Examples
This is a sales forecasting template 2 ppt powerpoint presentation infographic template examples. This is a two stage process. The stages in this process are forecasting, business, marketing, finance, graph.

Area Chart Ppt PowerPoint Presentation Summary Objects
This is a area chart ppt powerpoint presentation summary objects. This is a two stage process. The stages in this process are product, sales in percentage, finance, business, marketing.

Bar Graph Template 2 Ppt PowerPoint Presentation Ideas Files
This is a bar graph template 2 ppt powerpoint presentation ideas files. This is a five stage process. The stages in this process are in percentage, business, marketing, finance, graph.

Stacked Line Ppt PowerPoint Presentation Infographic Template Graphics Template
This is a stacked line ppt powerpoint presentation infographic template graphics template. This is a three stage process. The stages in this process are product, in percentage, business, marketing, finance.

Bar Graph Ppt PowerPoint Presentation Gallery Grid
This is a bar graph ppt powerpoint presentation gallery grid. This is a three stage process. The stages in this process are sales in percentage, product, finance, business, marketing.
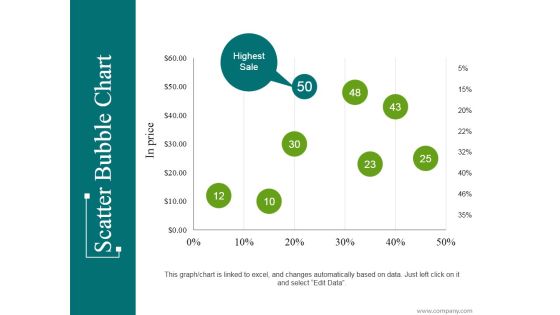
Scatter Bubble Chart Ppt PowerPoint Presentation Infographic Template Introduction
This is a scatter bubble chart ppt powerpoint presentation infographic template introduction. This is a eight stage process. The stages in this process are highest sale, business, marketing, percentage, finance.
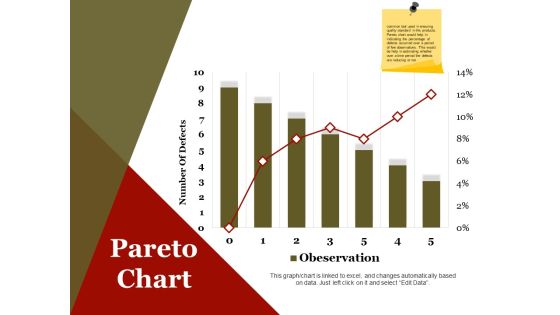
Pareto Chart Ppt PowerPoint Presentation Infographics Design Inspiration
This is a pareto chart ppt powerpoint presentation infographics design inspiration. This is a seven stage process. The stages in this process are number of defects, business, marketing, finance.

4 Quarter Track Record Template Ppt PowerPoint Presentation Model Graphics Download
This is a 4 quarter track record template ppt powerpoint presentation model graphics download. This is a four stage process. The stages in this process are business, marketing, strategy, planning, finance.
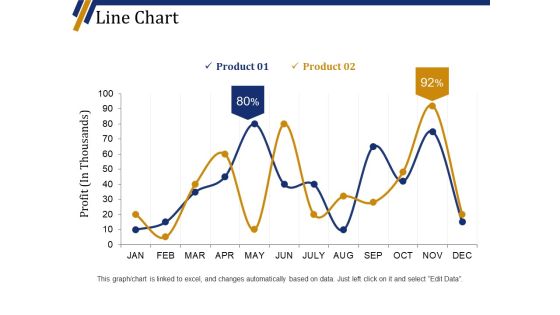
Line Chart Ppt PowerPoint Presentation Portfolio Background Designs
This is a line chart ppt powerpoint presentation portfolio background designs. This is a two stage process. The stages in this process are product, business, finance, marketing, profit in thousands.
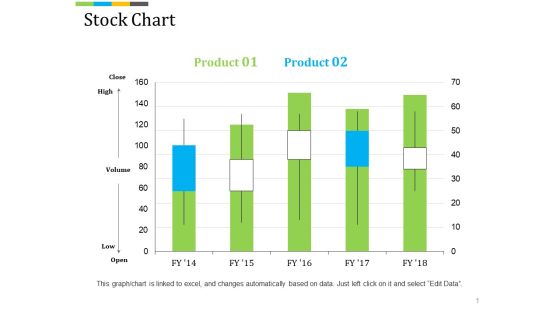
Stock Chart Ppt PowerPoint Presentation Professional Background Image
This is a stock chart ppt powerpoint presentation professional background image. This is a five stage process. The stages in this process are high, volume, low, finance, business, marketing.

Clustered Column Ppt PowerPoint Presentation Inspiration Shapes
This is a clustered column ppt powerpoint presentation inspiration shapes. This is a two stage process. The stages in this process are profit in percentage, business, marketing, graph, finance.

Column Chart Ppt PowerPoint Presentation Show Master Slide
This is a column chart ppt powerpoint presentation show master slide. This is a six stage process. The stages in this process are financial, years, business, marketing, finance, graph.

Stacked Area Clustered Column Ppt PowerPoint Presentation Ideas Show
This is a stacked area clustered column ppt powerpoint presentation ideas show. This is a three stage process. The stages in this process are in percentage, business, marketing, finance, graph.
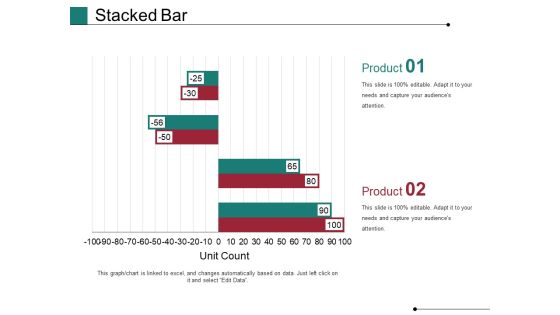
Stacked Bar Template 1 Ppt PowerPoint Presentation Show Slides
This is a stacked bar template 1 ppt powerpoint presentation show slides. This is a two stage process. The stages in this process are Unit Count, Business, Marketing, Graph, Finance.
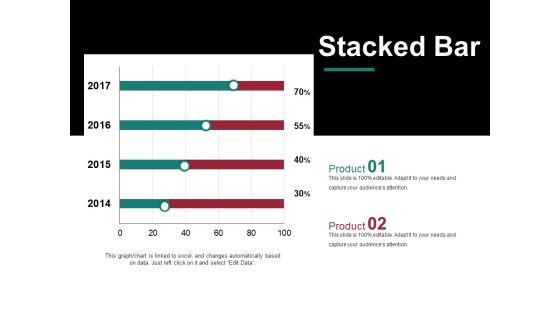
Stacked Bar Template 2 Ppt PowerPoint Presentation Model Graphic Images
This is a stacked bar template 2 ppt powerpoint presentation model graphic images. This is a two stage process. The stages in this process are business, years, marketing, percentage, finance.
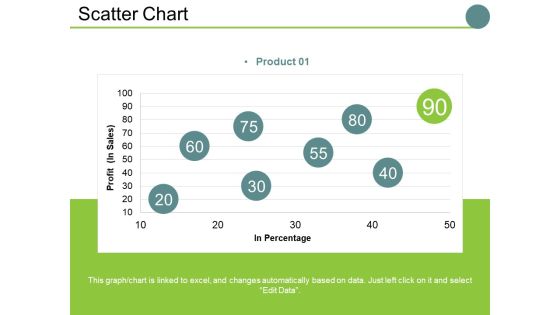
Scatter Chart Ppt PowerPoint Presentation Slides Examples
This is a scatter chart ppt powerpoint presentation slides examples. This is a one stage process. The stages in this process are profit , in percentage, business, marketing, finance, graph.

Radar Chart Ppt PowerPoint Presentation Portfolio Design Templates
This is a radar chart ppt powerpoint presentation portfolio design templates. This is a two stage process. The stages in this process are radar chart, product, finance, marketing, strategy, business.
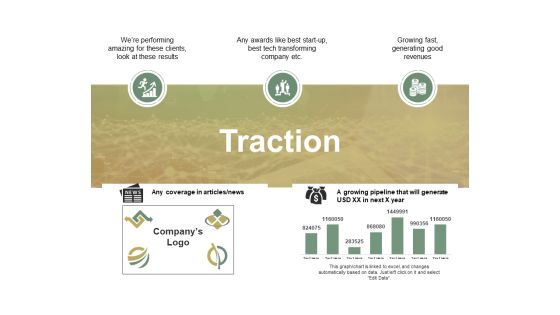
Traction Ppt PowerPoint Presentation Layouts Portrait
This is a traction ppt powerpoint presentation layouts portrait. This is a five stage process. The stages in this process are any coverage in articles news, growing pipeline that will generate usd xx in next x year, business, finance, marketing.
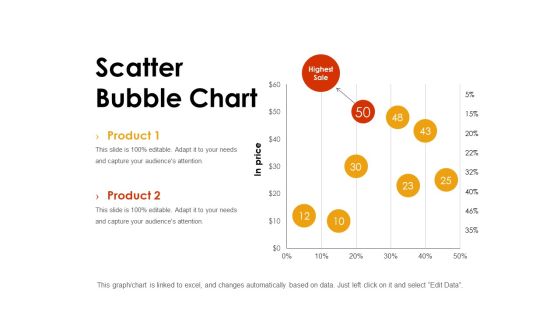
Scatter Bubble Chart Ppt PowerPoint Presentation Styles Background
This is a scatter bubble chart ppt powerpoint presentation styles background. This is a two stage process. The stages in this process are chart, in price, highest sale, finance, marketing.
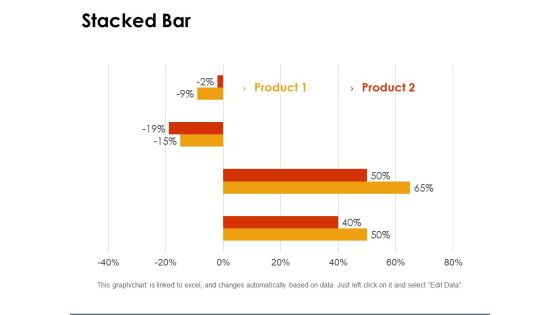
Stacked Bar Template 1 Ppt PowerPoint Presentation Gallery Clipart
This is a stacked bar template 1 ppt powerpoint presentation gallery clipart. This is a two stage process. The stages in this process are percentage, graph, business, marketing, finance.
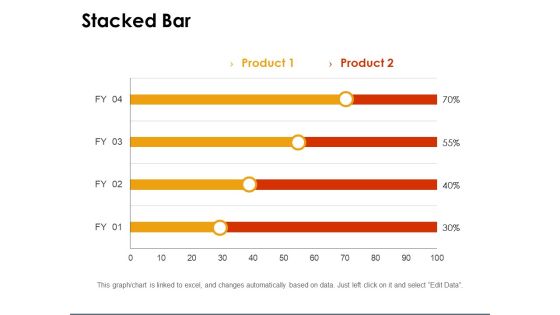
Stacked Bar Template 2 Ppt PowerPoint Presentation Infographics Graphics Design
This is a stacked bar template 2 ppt powerpoint presentation infographics graphics design. This is a two stage process. The stages in this process are percentage, business, marketing, finance.

Area Chart Ppt PowerPoint Presentation Professional Brochure
This is a area chart ppt powerpoint presentation professional brochure. This is a two stage process. The stages in this process are sales in percentage, business, marketing, finance, graph.

Bar Chart Ppt PowerPoint Presentation Portfolio Diagrams
This is a bar chart ppt powerpoint presentation portfolio diagrams. This is a three stage process. The stages in this process are sales in percentage, business, marketing, graph, finance.

Brand Tracking Info Graphics Ppt PowerPoint Presentation Infographic Template Graphics Download
This is a brand tracking info graphics ppt powerpoint presentation infographic template graphics download. This is a four stage process. The stages in this process are business, marketing, finance, strategy, icons.
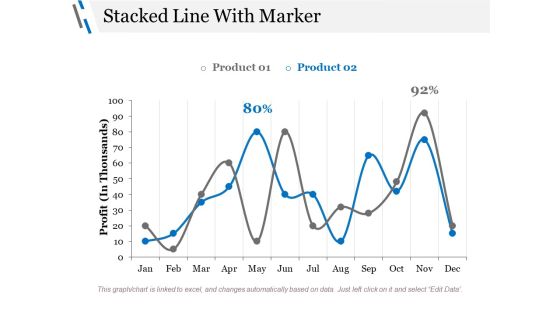
Stacked Line With Marker Ppt PowerPoint Presentation Styles Graphics Design
This is a stacked line with marker ppt powerpoint presentation styles graphics design. This is a three stage process. The stages in this process are profit, business, marketing, finance, percentage.

Area Chart Ppt PowerPoint Presentation Model Influencers
This is a area chart ppt powerpoint presentation model influencers. This is a two stage process. The stages in this process are sales in percentage, chart, business, marketing, finance.

Brand Tracking Info Graphics Ppt PowerPoint Presentation Slides Inspiration
This is a brand tracking info graphics ppt powerpoint presentation slides inspiration. This is a four stage process. The stages in this process are finance, marketing, percentage, business, strategy.
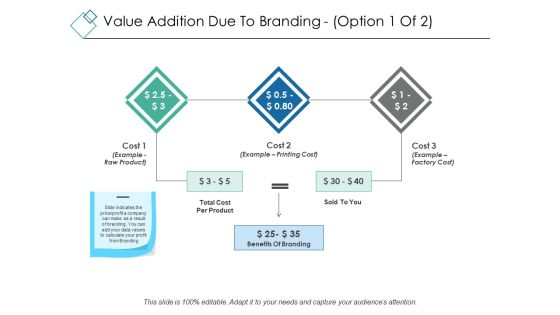
Value Addition Due To Branding Template 1 Ppt PowerPoint Presentation Portfolio Visual Aids
This is a value addition due to branding template 1 ppt powerpoint presentation portfolio visual aids. This is a three stage process. The stages in this process are business, marketing, finance, strategy benefits of branding.
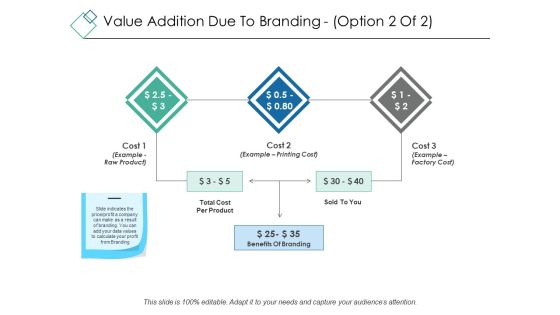
Value Addition Due To Branding Template 2 Ppt PowerPoint Presentation Ideas Sample
This is a value addition due to branding template 2 ppt powerpoint presentation ideas sample. This is a three stage process. The stages in this process are business, marketing, finance, strategy benefits of branding.

Area Chart Ppt PowerPoint Presentation Summary Show
This is a area chart ppt powerpoint presentation summary show. This is a two stage process. The stages in this process are sales in percentage, financial year, business, marketing, finance.

Stacked Bar Template Ppt PowerPoint Presentation Summary Visual Aids
This is a stacked bar template ppt powerpoint presentation summary visual aids. This is a three stage process. The stages in this process are unit count, business, marketing, finance, graph.
Scatter Chart Template 2 Ppt PowerPoint Presentation Slides Icons
This is a scatter chart template 2 ppt powerpoint presentation slides icons. This is a two stage process. The stages in this process are business, marketing, graph, in percentage, finance.

Area Chart Ppt PowerPoint Presentation Portfolio Templates
This is a area chart ppt powerpoint presentation portfolio templates. This is a two stage process. The stages in this process are sales in percentage, chart, business, marketing, finance.
 Home
Home