Rating Meter
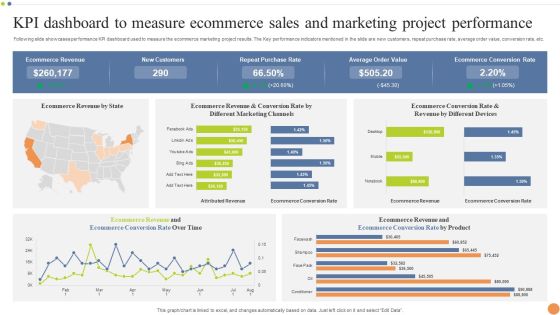
KPI Dashboard To Measure Ecommerce Sales And Marketing Project Performance Portrait PDF
Following slide showcases performance KPI dashboard used to measure the ecommerce marketing project results. The Key performance indicators mentioned in the slide are new customers, repeat purchase rate, average order value, conversion rate, etc. Pitch your topic with ease and precision using this KPI Dashboard To Measure Ecommerce Sales And Marketing Project Performance Portrait PDF. This layout presents information on Purchase Rate, Average Order Value, Ecommerce Conversion Rate. It is also available for immediate download and adjustment. So, changes can be made in the color, design, graphics or any other component to create a unique layout.
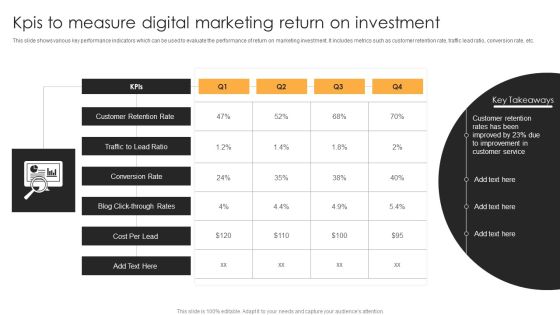
Kpis To Measure Digital Marketing Return On Investment Mockup PDF
This slide shows various key performance indicators which can be used to evaluate the performance of return on marketing investment. It includes metrics such as customer retention rate, traffic lead ratio, conversion rate, etc. Pitch your topic with ease and precision using this Kpis To Measure Digital Marketing Return On Investment Mockup PDF. This layout presents information on Conversion Rate, Traffic To Lead Ratio, Customer Retention Rate. It is also available for immediate download and adjustment. So, changes can be made in the color, design, graphics or any other component to create a unique layout.

Current Construction Management Efficiency Indicators In The Company Brochure PDF
This slide shows the current Construction Management System Efficiency Indicators of the company that are compared for 3 years. Some indicators are Incident Rate, Equipment Downtime, Labor Downtime , Construction Documentation Issues, Labor Productivity, Overall Construction Management Efficiency etc. Deliver and pitch your topic in the best possible manner with this current construction management efficiency indicators in the company brochure pdf. Use them to share invaluable insights on performance indicators, incident rate, equipment downtime, management and impress your audience. This template can be altered and modified as per your expectations. So, grab it now.

Management Techniques Current Construction Management Efficiency Indicators Slides PDF
This slide shows the current Construction Management System Efficiency Indicators of the Company that are Compared for 3 years. Some Indicators are Incident Rate, Equipment Downtime, Labor Downtime , Construction Documentation Issues, Labor Productivity, Overall Construction Management Efficiency etc. Deliver and pitch your topic in the best possible manner with this Management Techniques Current Construction Management Efficiency Indicators Slides PDF. Use them to share invaluable insights on Performance Indicators, 2020 to 2022, Incident Rate, Equipment Downtime and impress your audience. This template can be altered and modified as per your expectations. So, grab it now.

Management Techniques Future Estimated Construction Management Efficiency Indicators Elements PDF
This slide shows the future estimated Construction Management System Efficiency Indicators of the company that are compared for 3 years. Some indicators are Incident Rate, Equipment Downtime, Labor Downtime , Construction Documentation Issues, Labor Productivity, Overall Construction Management Efficiency etc. Deliver an awe inspiring pitch with this creative Management Techniques Future Estimated Construction Management Efficiency Indicators Elements PDF bundle. Topics like Equipment Downtime, Incident Rate, Labor Downtime can be discussed with this completely editable template. It is available for immediate download depending on the needs and requirements of the user.

Key Performance Indicators Of Office Work Culture Inspiration PDF
This slide showcases various indicators of inappropriate office work culture to take proactive action. It includes indicators such as high turnover rate, decrease performance levels, lack of collaboration and office gossip. Presenting Key Performance Indicators Of Office Work Culture Inspiration PDF to dispense important information. This template comprises four stages. It also presents valuable insights into the topics including High Turnover Rate, Decrease Performance Levels, Office Gossip. This is a completely customizable PowerPoint theme that can be put to use immediately. So, download it and address the topic impactfully.

Key Performance Indicator Metrics Of Marketing Research Guidelines PDF
Following template showcases various key performance indicators which can be used by business organizations to track the effectiveness of their brand performance by conducting market research. The key performance indicators are response rate, net promoter score among many others. Showcasing this set of slides titled Key Performance Indicator Metrics Of Marketing Research Guidelines PDF. The topics addressed in these templates are Response Rate, Net Promoter Score, Customer Satisfaction Score . All the content presented in this PPT design is completely editable. Download it and make adjustments in color, background, font etc. as per your unique business setting.
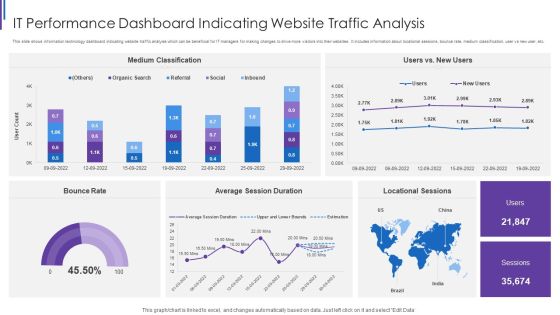
IT Performance Dashboard Indicating Website Traffic Analysis Background PDF
This slide shows information technology dashboard indicating website traffic analysis which can be beneficial for IT managers for making changes to drive more visitors into their websites. It includes information about locational sessions, bounce rate, medium classification, user vs new user, etc. Pitch your topic with ease and precision using this IT Performance Dashboard Indicating Website Traffic Analysis Background PDF. This layout presents information on Medium Classification Rate, Average Session Duration, Locational Sessions Bounce. It is also available for immediate download and adjustment. So, changes can be made in the color, design, graphics or any other component to create a unique layout.
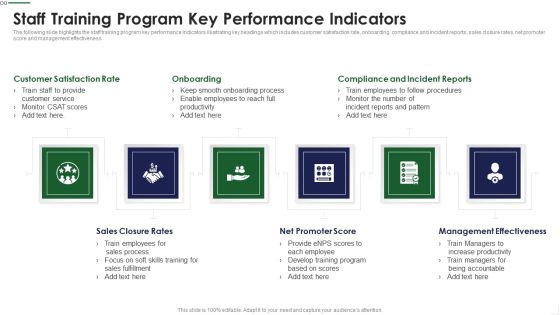
Staff Training Program Key Performance Indicators Diagrams PDF
The following slide highlights the staff training program key performance Indicators illustrating key headings which includes customer satisfaction rate, onboarding, compliance and incident reports, sales closure rates, net promoter score and management effectiveness Presenting Staff Training Program Key Performance Indicators Diagrams PDF to provide visual cues and insights. Share and navigate important information on six stages that need your due attention. This template can be used to pitch topics like Turnover Quarter, Turnover Type, Turnover Reasons In addtion, this PPT design contains high resolution images, graphics, etc, that are easily editable and available for immediate download.

Key Performance Indicators For Staff Performance Management Clipart PDF
The following slide highlights the key performance Indicators for staff performance management illustrating key headings which includes revenue per hour, profit per employee, utilization rate, task completion rate, overtime per employee and employee capacity Persuade your audience using this Key Performance Indicators For Staff Growth Topics PDF This PPT design covers six stages, thus making it a great tool to use. It also caters to a variety of topics including Revenue Employee, Profit Employee, Task Completion Download this PPT design now to present a convincing pitch that not only emphasizes the topic but also showcases your presentation skills.

Key Performance Indicators Of Service Desk Problem Management Elements PDF
This slide showcases key metrics tracked and measured for incident management. Metrics included are incident response time, number of unresolved incidents, reopen rate, total cost per contact, customer satisfaction and first call resolution rate. Presenting Key Performance Indicators Of Service Desk Problem Management Elements PDF to dispense important information. This template comprises eight stages. It also presents valuable insights into the topics including Incident Response Time, Number Of Unresolved Incidents, Number Of Contacts Handled. This is a completely customizable PowerPoint theme that can be put to use immediately. So, download it and address the topic impactfully.

Yearly Sales Assessment With Key Performance Indicator Matrix Introduction PDF
This slide covers quarterly product units sold through out a financial year in an organization with growth in revenue, profit and number of customer from previous years sales. It includes product sold and growth rate. Presenting Yearly Sales Assessment With Key Performance Indicator Matrix Introduction PDF to dispense important information. This template comprises four stages. It also presents valuable insights into the topics including Sold Growth Rate, Customers, Growth In Profit. This is a completely customizable PowerPoint theme that can be put to use immediately. So, download it and address the topic impactfully.

Key Performance Indicators For Advertising And Promotion Plan Background PDF
This slide shows KPIs for measuring effectiveness of advertising and promotion plan for increasing overall revenue. It include KPIs such as conversion rate, cost per lead and social media management, etc. Persuade your audience using this Key Performance Indicators For Advertising And Promotion Plan Background PDF. This PPT design covers five stages, thus making it a great tool to use. It also caters to a variety of topics including Conversion Rate, Cost Per Lead, Social Media Management. Download this PPT design now to present a convincing pitch that not only emphasizes the topic but also showcases your presentation skills.

Fuel Gauge Industrial PowerPoint Templates And PowerPoint Backgrounds 0311
Microsoft PowerPoint Template and Background with fuel gauge with money amounts
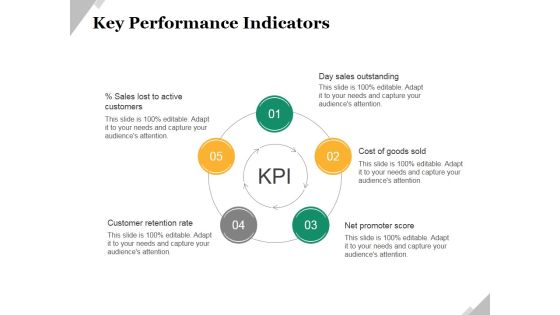
Key Performance Indicators Template 1 Ppt PowerPoint Presentation Inspiration Elements
This is a key performance indicators template 1 ppt powerpoint presentation inspiration elements. This is a five stage process. The stages in this process are sales lost to active customers, customer retention rate, day sales outstanding, cost of goods sold, net promoter score.
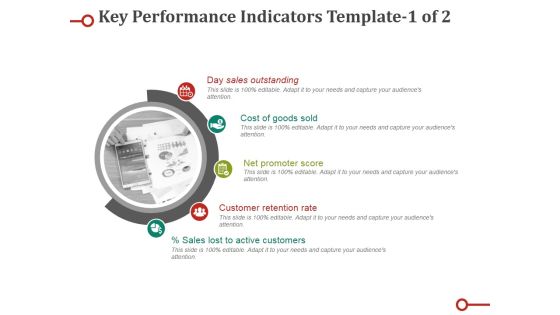
Key Performance Indicators Template Ppt PowerPoint Presentation Professional Diagrams
This is a key performance indicators template ppt powerpoint presentation professional diagrams. This is a five stage process. The stages in this process are day sales outstanding, cost of goods sold, net promoter score, customer retention rate, sales lost to active customers.

Complete Guide For Total Employee Involvement Strategic Approach Current Employee Engagement Ideas PDF
This slide shows the current Employee Engagement Performance Indicators in the Company that are compared for 3 years. Some indicators are Employee Turnover Rate, Internal Promotion Rate, Absenteeism Rate, Employee Satisfaction Index, NPS Net Promoter Score etc. Deliver and pitch your topic in the best possible manner with this Complete Guide For Total Employee Involvement Strategic Approach Current Employee Engagement Ideas PDF Use them to share invaluable insights on Employee Turnover, Employee Absenteeism, Performance Indicators and impress your audience. This template can be altered and modified as per your expectations. So, grab it now.
Measurement Gauge Vector Icon Ppt PowerPoint Presentation File Infographics PDF
Presenting this set of slides with name measurement gauge vector icon ppt powerpoint presentation file infographics pdf. This is a three stage process. The stages in this process are measurement gauge vector icon. This is a completely editable PowerPoint presentation and is available for immediate download. Download now and impress your audience.
Sales Team Accomplishment Evaluation With Gauge Icon Introduction PDF
Showcasing this set of slides titled sales team accomplishment evaluation with gauge icon introduction pdf The topics addressed in these templates are sales team accomplishment evaluation with gauge icon All the content presented in this PPT design is completely editable. Download it and make adjustments in color, background, font etc. as per your unique business setting.
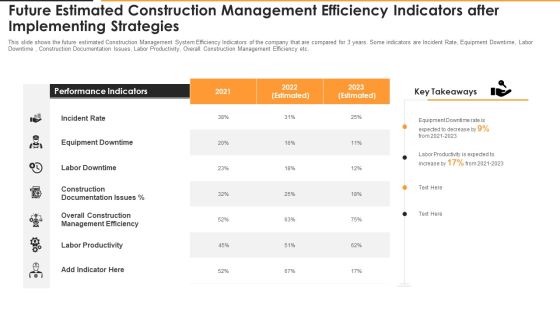
Future Estimated Construction Management Efficiency Indicators After Implementing Strategies Graphics PDF
This slide shows the future estimated Construction Management System Efficiency Indicators of the company that are compared for 3 years. Some indicators are Incident Rate, Equipment Downtime, Labor Downtime , Construction Documentation Issues, Labor Productivity, Overall Construction Management Efficiency etc. Deliver an awe inspiring pitch with this creative future estimated construction management efficiency indicators after implementing strategies graphics pdf bundle. Topics like incident rate, performance indicators, equipment downtime, management efficiency can be discussed with this completely editable template. It is available for immediate download depending on the needs and requirements of the user.

Future Integrated Logistics Management Efficiency Indicators In The Company Ideas PDF
This slide shows the current Integrated Logistics Management System Efficiency Indicators of the company that are compared for 3 years. Some indicators are order accuracy rate, on time delivery, average cycle time , inventory accuracy, perfect order rate, overall integrated logistics efficiency etc. Deliver and pitch your topic in the best possible manner with this future integrated logistics management efficiency indicators in the company ideas pdf. Use them to share invaluable insights on average, inventory accuracy, performance indicators and impress your audience. This template can be altered and modified as per your expectations. So, grab it now.

Sales Key Performance Indicators Of The Company Before Strategy Implementation Growth Ppt Infographic Template Microsoft PDF
This slide shows the current Sales Performance Indicators of the company before adopting an effective strategy. These stats are related to Sales Growth, Average Sales Cycle Length, Profit Margin, Customer Churn Rate, Overall Company Sales etc. from the years 2018 to 2020 along with key takeaways. Deliver and pitch your topic in the best possible manner with this sales key performance indicators of the company before strategy implementation growth ppt infographic template microsoft pdf. Use them to share invaluable insights on performance indicators metrics, sales growth, customer churn rate, profit margin, 2018 to 2020 and impress your audience. This template can be altered and modified as per your expectations. So, grab it now.
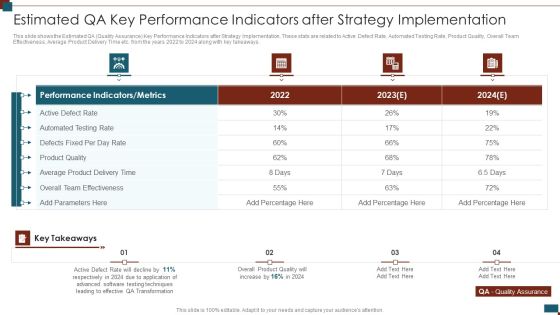
Successful Quality Assurance Transition Techniques To Enhance Product Quality Estimated Qa Key Performance Indicators Slides PDF
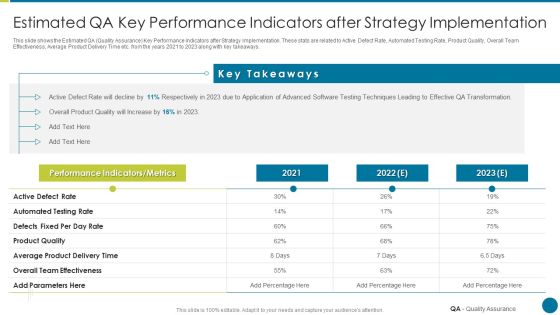
This slide shows the Estimated QA Quality Assurance Key Performance Indicators after Strategy Implementation. These stats are related to Active Defect Rate, Automated Testing Rate, Product Quality, Overall Team Effectiveness, Average Product Delivery Time etc. from the years 2022 to 2024 along with key takeaways. Deliver an awe inspiring pitch with this creative successful quality assurance transition techniques to enhance product quality estimated qa key performance indicators slides pdf bundle. Topics like estimated qa key performance indicators after strategy implementation can be discussed with this completely editable template. It is available for immediate download depending on the needs and requirements of the user.
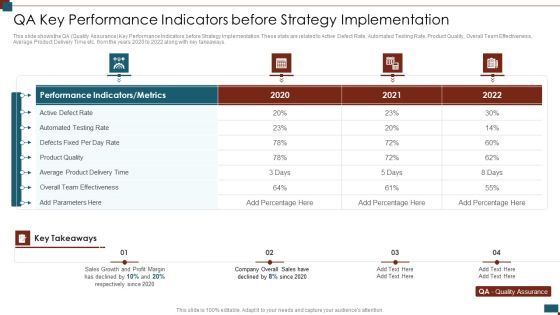
Successful Quality Assurance Transition Techniques To Enhance Product Quality Qa Key Performance Indicators Summary PDF
This slide shows the QA Quality Assurance Key Performance Indicators before Strategy Implementation. These stats are related to Active Defect Rate, Automated Testing Rate, Product Quality, Overall Team Effectiveness, Average Product Delivery Time etc. from the years 2020 to 2022 along with key takeaways. Deliver an awe inspiring pitch with this creative successful quality assurance transition techniques to enhance product quality qa key performance indicators summary pdf bundle. Topics like qa key performance indicators before strategy implementation can be discussed with this completely editable template. It is available for immediate download depending on the needs and requirements of the user.

Deploying Quality Assurance QA Transformation Estimated QA Key Performance Indicators Ideas PDF
This slide shows the estimated QA quality assurance key performance indicators after strategy implementation. These stats are related to active defect rate, automated testing rate, product quality, overall team effectiveness, average product delivery time etc. From the years 2020 to 2022 along with key takeaways.Deliver and pitch your topic in the best possible manner with this Deploying Quality Assurance QA Transformation Estimated QA Key Performance Indicators Ideas PDF Use them to share invaluable insights on Performance Indicators, Automated Testing, Overall Team Effectiveness and impress your audience. This template can be altered and modified as per your expectations. So, grab it now.

Deploying Quality Assurance QA Transformation QA Key Performance Indicators Before Strategy Graphics PDF
This slide shows the QA Quality Assurance Key Performance Indicators before Strategy Implementation. These stats are related to Active Defect Rate, Automated Testing Rate, Product Quality, Overall Team Effectiveness, Average Product Delivery Time etc. from the years 2020 to 2022 along with key takeaways.Deliver an awe inspiring pitch with this creative Deploying Quality Assurance QA Transformation QA Key Performance Indicators Before Strategy Graphics PDF bundle. Topics like Performance Indicators, Automated Testing, Overall Team Effectiveness can be discussed with this completely editable template. It is available for immediate download depending on the needs and requirements of the user.
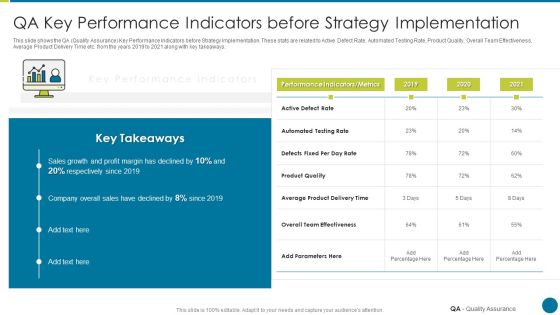
QA Modification For Product Quality Development And Consumer Satisfaction QA Key Performance Indicators Infographics PDF
This slide shows the QA Quality Assurance Key Performance Indicators before Strategy Implementation. These stats are related to Active Defect Rate, Automated Testing Rate, Product Quality, Overall Team Effectiveness, Average Product Delivery Time etc. from the years 2019 to 2021 along with key takeaways. Deliver an awe inspiring pitch with this creative qa modification for product quality development and consumer satisfaction qa key performance indicators infographics pdf bundle. Topics like overall team effectiveness, product quality, performance, product quality can be discussed with this completely editable template. It is available for immediate download depending on the needs and requirements of the user.

Ukraine Vs Russia Examining Russia Vs Ukraine Comparison Based On Economic Indicators Sample PDF
This slide provides information regarding comparison of Russia and Ukraine based on economic indicators. Both nations are compared on parameters such as inflation, petrol prices, GDP per capita, USD exchange rate. Deliver an awe inspiring pitch with this creative Ukraine Vs Russia Examining Russia Vs Ukraine Comparison Based On Economic Indicators Sample PDF bundle. Topics like Inflation, Petrol Prices, USD Exchange Rate, GDP Per Capita can be discussed with this completely editable template. It is available for immediate download depending on the needs and requirements of the user.
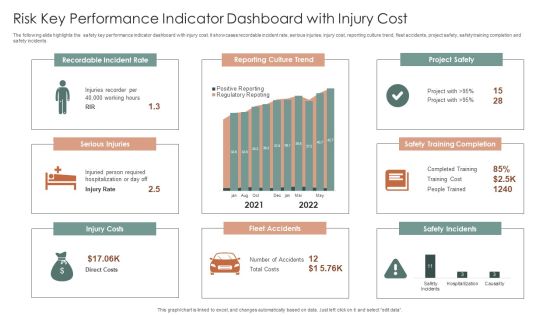
Risk Key Performance Indicator Dashboard With Injury Cost Ppt Summary Brochure PDF
The following slide highlights the safety key performance indicator dashboard with injury cost. It showcases recordable incident rate, serious injuries, injury cost, reporting culture trend, fleet accidents, project safety, safety training completion and safety incidents. Pitch your topic with ease and precision using this Risk Key Performance Indicator Dashboard With Injury Cost Ppt Summary Brochure PDF. This layout presents information on Recordable Incident Rate, Reporting Culture Trend, Project Safety. It is also available for immediate download and adjustment. So, changes can be made in the color, design, graphics or any other component to create a unique layout.

Technology Innovation Human Resource System HR Key Performance Indicators Ppt Styles Designs Download PDF
The dashboard focus on monitoring the internal hire rate, percentage of eligible candidate, revenue per employee and workforce below job standard. Presenting technology innovation human resource system hr key performance indicators ppt styles designs download pdf to provide visual cues and insights. Share and navigate important information on four stages that need your due attention. This template can be used to pitch topics like revenue per employee, performance standards, internal rate. In addition, this PPT design contains high-resolution images, graphics, etc, that are easily editable and available for immediate download.

Complete Guide For Total Employee Involvement Strategic Approach Estimated Employee Engagement Pictures PDF
This slide shows the estimated and improved Employee Engagement Performance Indicators in the Company after strategy implementation for the coming 3 years. Some of the indicators are Employee Turnover Rate, Internal Promotion Rate, Absenteeism Rate, Employee Satisfaction Index, NPS Net Promoter Score etc. Deliver an awe inspiring pitch with this creative Complete Guide For Total Employee Involvement Strategic Approach Estimated Employee Engagement Pictures PDF bundle. Topics like Score Expected, Expected Increase, Expected To Decrease can be discussed with this completely editable template. It is available for immediate download depending on the needs and requirements of the user.

Kpis To Optimize For Overcoming Decline Of Sales Mockup PDF
This slide consists of key performance indicators that can be implemented by managers for optimizing and overcoming lost sales. Major key performance indicators are stockout rate, order fulfilment rate, customer satisfaction rate, etc. Showcasing this set of slides titled Kpis To Optimize For Overcoming Decline Of Sales Mockup PDF. The topics addressed in these templates are Target, Actual, Deviation. All the content presented in this PPT design is completely editable. Download it and make adjustments in color, background, font etc. as per your unique business setting.

Progress Gauge Ppt PowerPoint Presentation Complete Deck With Slides
If designing a presentation takes a lot of your time and resources and you are looking for a better alternative, then this Progress Gauge Ppt PowerPoint Presentation Complete Deck With Slides is the right fit for you. This is a prefabricated set that can help you deliver a great presentation on the topic. All the ten slides included in this sample template can be used to present a birds-eye view of the topic. These slides are also fully editable, giving you enough freedom to add specific details to make this layout more suited to your business setting. Apart from the content, all other elements like color, design, theme are also replaceable and editable. This helps in designing a variety of presentations with a single layout. Not only this, you can use this PPT design in formats like PDF, PNG, and JPG once downloaded. Therefore, without any further ado, download and utilize this sample presentation as per your liking.

Gas Gauge Ppt PowerPoint Presentation Complete With Slides
Boost your confidence and team morale with this well-structured Gas Gauge Ppt PowerPoint Presentation Complete With Slides. This prefabricated set gives a voice to your presentation because of its well-researched content and graphics. Our experts have added all the components very carefully, thus helping you deliver great presentations with a single click. Not only that, it contains a set of eleven slides that are designed using the right visuals, graphics, etc. Various topics can be discussed, and effective brainstorming sessions can be conducted using the wide variety of slides added in this complete deck. Apart from this, our PPT design contains clear instructions to help you restructure your presentations and create multiple variations. The color, format, design anything can be modified as deemed fit by the user. Not only this, it is available for immediate download. So, grab it now.

Reverse Logistic In Supply Chain Strategy Key Performing Indicators In Reverse Logistics Indicators Background PDF
The purpose of this slide is to provide regarding important aspects that should be considered during reverse logistics in firm.Deliver an awe inspiring pitch with this creative reverse logistic in supply chain strategy key performing indicators in reverse logistics indicators background pdf bundle. Topics like inventory fill rate, indicators, industry average can be discussed with this completely editable template. It is available for immediate download depending on the needs and requirements of the user.
Fuel Indicator Vector Icons Ppt PowerPoint Presentation File Example File
This is a fuel indicator vector icons ppt powerpoint presentation file example file. This is a three stage process. The stages in this process are fuel gauge, gas gauge, fuel containers.

Fuel Levels Indicators And Dashboards Ppt PowerPoint Presentation Outline Skills
This is a fuel levels indicators and dashboards ppt powerpoint presentation outline skills. This is a three stage process. The stages in this process are fuel gauge, gas gauge, fuel containers.

Headspace Fund Raising Pitch Deck Our Headspace Signals Microsoft PDF
Purpose of the following slide is to show the Key performance indicators, these KPIs can help in analyzing the organization performance . These KPIs could be growth rate, weekly growth rate, market share, twitter follower, similar web unique visitor and majestic referring domains.Deliver and pitch your topic in the best possible manner with this Headspace Fund Raising Pitch Deck Our Headspace Signals Microsoft PDF. Use them to share invaluable insights on Growth Rate, Weekly Growth, Referring Domains and impress your audience. This template can be altered and modified as per your expectations. So, grab it now.

Ecommerce Operations Management Metrics To Measure Performance Professional PDF
This slide showcases essential metrics of e-commerce to make informed decisions. Major key performance indicators covered are website traffic, shopping cart abandonment rate, revenue per visitor and on time delivery rate. Presenting Ecommerce Operations Management Metrics To Measure Performance Professional PDF to dispense important information. This template comprises one stage. It also presents valuable insights into the topics including Abandonment Rate, Industry Benchmark, Performance. This is a completely customizable PowerPoint theme that can be put to use immediately. So, download it and address the topic impactfully.

Decreased Shipping And Logistics Management Performance Efficiency Slides PDF
This slide covers the reasons why company wants to implement automation in business as current shipping and Logistics Management System Efficiency is decreasing compared for 3 years. Some indicators are order accuracy rate, on time delivery, average cycle time , inventory accuracy, perfect order rate, overall integrated logistics efficiency etc. Deliver an awe inspiring pitch with this creative Decreased Shipping And Logistics Management Performance Efficiency Slides PDF bundle. Topics like Accuracy Rate, Inventory, Average can be discussed with this completely editable template. It is available for immediate download depending on the needs and requirements of the user.

Dashboard For Big Healthcare Data Analytics Graphics PDF
This slide showcase the dashboard for big data analytics in healthcare. It includes elements such as bed occupancy rate, patient turnover rate, efficiency and costs, missed and cancelled appointment rate. Showcasing this set of slides titled Dashboard For Big Healthcare Data Analytics Graphics PDF. The topics addressed in these templates are Satisfaction Service Indicators, Occupancy, Forecasted Patient Turnover. All the content presented in this PPT design is completely editable. Download it and make adjustments in color, background, font etc. as per your unique business setting.

Retail Apparel Online Track Metrics To Analyze Social Media Engagement Professional PDF
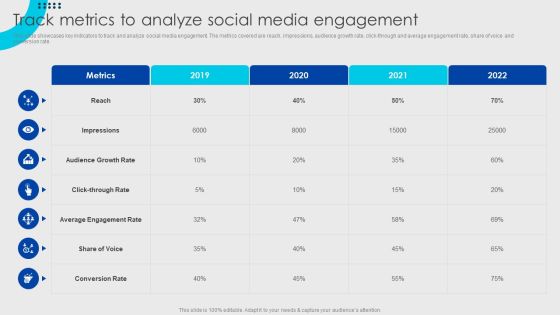
This slide showcases key indicators to track and analyze social media engagement. The metrics covered are reach, impressions, audience growth rate, click-through and average engagement rate, share of voice and conversion rate. Want to ace your presentation in front of a live audience Our Retail Apparel Online Track Metrics To Analyze Social Media Engagement Professional PDF can help you do that by engaging all the users towards you. Slidegeeks experts have put their efforts and expertise into creating these impeccable powerpoint presentations so that you can communicate your ideas clearly. Moreover, all the templates are customizable, and easy-to-edit and downloadable. Use these for both personal and commercial use.
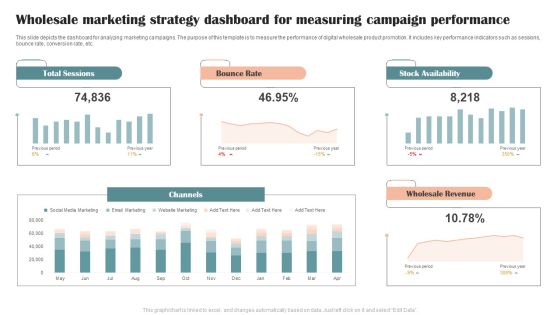
Wholesale Marketing Strategy Dashboard For Measuring Campaign Performance Graphics PDF
This slide depicts the dashboard for analyzing marketing campaigns. The purpose of this template is to measure the performance of digital wholesale product promotion. It includes key performance indicators such as sessions, bounce rate, conversion rate, etc. Showcasing this set of slides titled Wholesale Marketing Strategy Dashboard For Measuring Campaign Performance Graphics PDF. The topics addressed in these templates are Total Sessions, Bounce Rate, Stock Availability. All the content presented in this PPT design is completely editable. Download it and make adjustments in color, background, font etc. as per your unique business setting.

Ecommerce Website Performance Gap Assessment Information PDF
This slide represents the performance gap analysis of an ecommerce website. The purpose of this slide is to demonstrate the various key performance indicators used in website performance. The key components include sales, signups or leads, visit to signup rate, bounce rate, and unique visitors. Pitch your topic with ease and precision using this Ecommerce Website Performance Gap Assessment Information PDF. This layout presents information on Navigation System, Performance, Bounce Rate. It is also available for immediate download and adjustment. So, changes can be made in the color, design, graphics or any other component to create a unique layout.
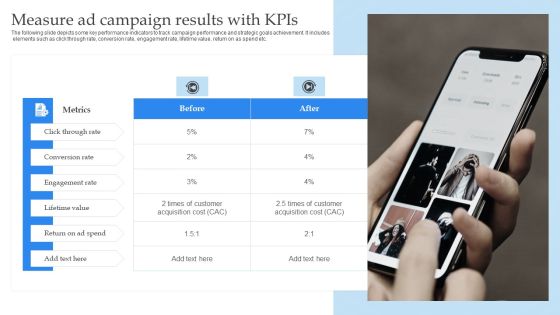
Mobile Promotion Strategic Guide For Micro Businesses Measure Ad Campaign Results With Kpis Sample PDF
The following slide depicts some key performance indicators to track campaign performance and strategic goals achievement. It includes elements such as click through rate, conversion rate, engagement rate, lifetime value, return on as spend etc. From laying roadmaps to briefing everything in detail, our templates are perfect for you. You can set the stage with your presentation slides. All you have to do is download these easy to edit and customizable templates. Mobile Promotion Strategic Guide For Micro Businesses Measure Ad Campaign Results With Kpis Sample PDF will help you deliver an outstanding performance that everyone would remember and praise you for. Do download this presentation today.

Track Metrics To Analyze Social Media Engagement Download PDF
This slide showcases key indicators to track and analyze social media engagement. The metrics covered are reach, impressions, audience growth rate, click-through and average engagement rate, share of voice and conversion rate. If your project calls for a presentation, then Slidegeeks is your go to partner because we have professionally designed, easy to edit templates that are perfect for any presentation. After downloading, you can easily edit Track Metrics To Analyze Social Media Engagement Download PDF and make the changes accordingly. You can rearrange slides or fill them with different images. Check out all the handy templates.
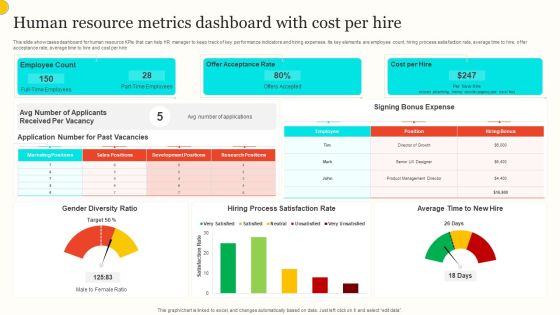
Human Resource Metrics Dashboard With Cost Per Hire Portrait PDF
This slide showcases dashboard for human resource KPIs that can help HR manager to keep track of key performance indicators and hiring expenses. Its key elements are employee count, hiring process satisfaction rate, average time to hire, offer acceptance rate, average time to hire and cost per hire. Showcasing this set of slides titled Human Resource Metrics Dashboard With Cost Per Hire Portrait PDF. The topics addressed in these templates are Employee Count, Offer Acceptance Rate, Cost Per Hire. All the content presented in this PPT design is completely editable. Download it and make adjustments in color, background, font etc. as per your unique business setting.

Variables Influencing Stock Market Conceptual Structure Summary PDF
This slide exhibits various indicators that influence stock market. Purpose of this slide is to determine market trends that helps in stock market growth. It include elements such as exchange rate, inflation rate, GDP, capital market management, turnover rate, share price etc. Presenting Variables Influencing Stock Market Conceptual Structure Summary PDF to dispense important information. This template comprises four stages. It also presents valuable insights into the topics including Dependent Variables, Independent Variables, Intervening Variables. This is a completely customizable PowerPoint theme that can be put to use immediately. So, download it and address the topic impactfully.

Increasing Consumer Engagement With Database Key Metrics To Measure Success Of Targeted Guidelines PDF
The purpose of this slide is to showcase key performance indicators KPIs through which marketers can evaluate success of targeted social media campaign. The metrics are customer engagement rate, conversion rate, website traffic, lead generation, brand awareness rate, etc. There are so many reasons you need a Increasing Consumer Engagement With Database Key Metrics To Measure Success Of Targeted Guidelines PDF. The first reason is you cannot spend time making everything from scratch, Thus, Slidegeeks has made presentation templates for you too. You can easily download these templates from our website easily.

Key Performance Indicators Of ADC Cosmetics Company With Future Targets Structure PDF
Deliver an awe inspiring pitch with this creative key performance indicators of adc cosmetics company with future targets structure pdf bundle. Topics like market share, stock turnover rate, key performance indicators can be discussed with this completely editable template. It is available for immediate download depending on the needs and requirements of the user.
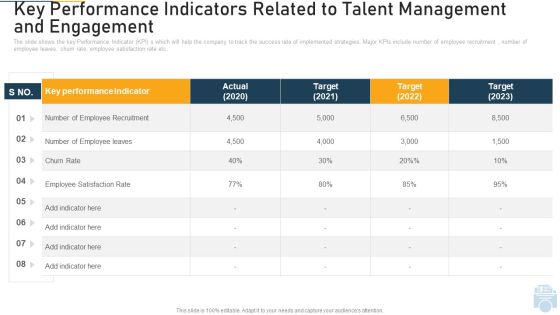
Key Performance Indicators Related To Talent Management And Engagement Ppt Show Outline PDF
Deliver an awe inspiring pitch with this creative key performance indicators related to talent management and engagement ppt show outline pdf bundle. Topics like recruitment, churn rate, key performance indicator, target can be discussed with this completely editable template. It is available for immediate download depending on the needs and requirements of the user.
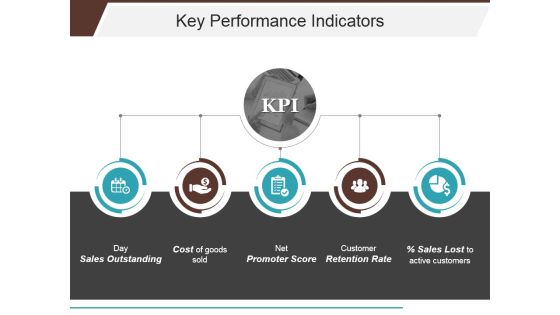
Key Performance Indicators Template 1 Ppt PowerPoint Presentation Portfolio Background Image
This is a key performance indicators template 1 ppt powerpoint presentation portfolio background image. This is a five stage process. The stages in this process are sales outstanding, cost of goods sold, net promoter score, customer retention rate, sales lost to active customers.
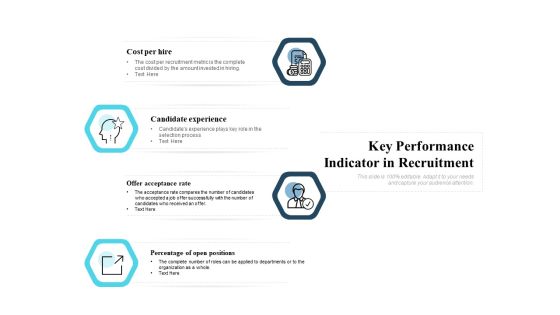
Key Performance Indicator In Recruitment Ppt PowerPoint Presentation Show Graphic Tips
Presenting this set of slides with name key performance indicator in recruitment ppt powerpoint presentation show graphic tips. This is a four stage process. The stages in this process are cost per hire, candidate experience, offer acceptance rate, percentage of open positions. This is a completely editable PowerPoint presentation and is available for immediate download. Download now and impress your audience.

Key Findings Ppt PowerPoint Presentation Complete Deck With Slides
This is a key findings ppt powerpoint presentation complete deck with slides. This is a one stage process. The stages in this process are key findings, management, planning, business, analysis.

Key Performance Indicators Highlighting Yearly Business Performance Portrait PDF
This slide includes key components such as website visit, blog traffic, conversion rate, social share, click through rate, etc. which help businesses to measure website performance, number of customer converted and retained to estimate current situation of business. Create an editable Key Performance Indicators Highlighting Yearly Business Performance Portrait PDF that communicates your idea and engages your audience. Whether you are presenting a business or an educational presentation, pre designed presentation templates help save time. Key Performance Indicators Highlighting Yearly Business Performance Portrait PDF is highly customizable and very easy to edit, covering many different styles from creative to business presentations. Slidegeeks has creative team members who have crafted amazing templates. So, go and get them without any delay.
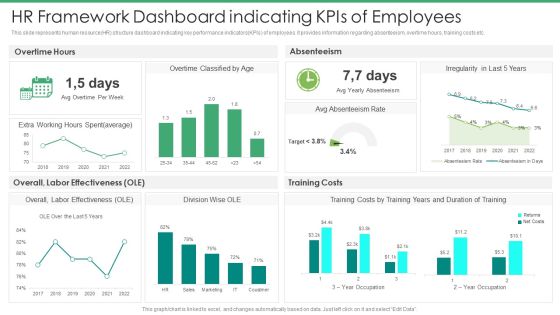
HR Framework Dashboard Indicating Kpis Of Employees Introduction PDF
This slide represents human resource HR structure dashboard indicating key performance indicators KPIs of employees. it provides information regarding absenteeism, overtime hours, training costs etc.Pitch your topic with ease and precision using this HR Framework Dashboard Indicating Kpis Of Employees Introduction PDF. This layout presents information on Absenteeism Rate, Costs, Average. It is also available for immediate download and adjustment. So, changes can be made in the color, design, graphics or any other component to create a unique layout.
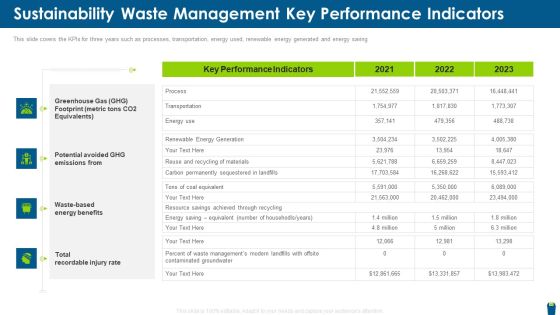
Sustainability Waste Management Key Performance Indicators Summary PDF
This slide covers the KPIs for three years such as processes, transportation, energy used, renewable energy generated and energy saving. Deliver an awe inspiring pitch with this creative sustainability waste management key performance indicators summary pdf bundle. Topics like metric, equivalent, rate, management, performance can be discussed with this completely editable template. It is available for immediate download depending on the needs and requirements of the user.

KPI Metrics For Cyber Safety And Security Report Elements PDF
This slide shows various key performance indicators which can be used to report cyber security. It includes metrics detected intrusion attempts, incident rate, vulnerability patch response times, etc. Showcasing this set of slides titled KPI Metrics For Cyber Safety And Security Report Elements PDF. The topics addressed in these templates are Incident Rate, Application, Metrics. All the content presented in this PPT design is completely editable. Download it and make adjustments in color, background, font etc. as per your unique business setting.
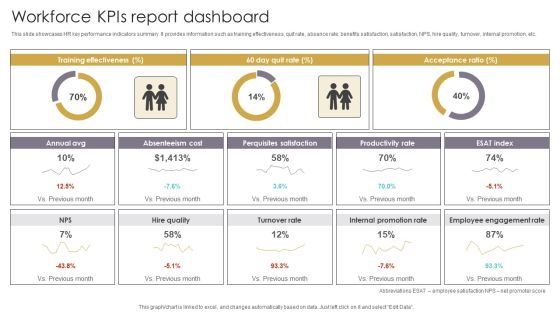
Workforce Kpis Report Dashboard Slides PDF
This slide showcases HR key performance indicators summary. It provides information such as training effectiveness, quit rate, absence rate, benefits satisfaction, satisfaction, NPS, hire quality, turnover, internal promotion, etc. Pitch your topic with ease and precision using this Workforce Kpis Report Dashboard Slides PDF. This layout presents information on Acceptance Ratio, Absenteeism Cost, Perquisites Satisfaction. It is also available for immediate download and adjustment. So, changes can be made in the color, design, graphics or any other component to create a unique layout.

Dashboard For Measuring And Assessing Communication Tactics Information PDF
This slide represents dashboard to assess and gauge internal communication approaches which benefits industries in assessing strategy, plan gaps and build efficient employee engagement. Elements included in this slide are engagement score, employee satisfaction rate, communication tools and strategies, etc. Showcasing this set of slides titled Dashboard For Measuring And Assessing Communication Tactics Information PDF. The topics addressed in these templates are Employee Engagement, Employee Response Rate, Communication Effectiveness. All the content presented in this PPT design is completely editable. Download it and make adjustments in color, background, font etc. as per your unique business setting.

Business Plan Speedometer Future PowerPoint Template 1110
A speedometer with needle pointing to the words Business Plan
Four Fuel Dashboards Indicators With Text Holders Ppt PowerPoint Presentation File Graphics Design
This is a four fuel dashboards indicators with text holders ppt powerpoint presentation file graphics design. This is a four stage process. The stages in this process are fuel gauge, gas gauge, fuel containers.

Three Dashboard Speed Indicators With Text Holders Ppt PowerPoint Presentation Summary Layout
This is a three dashboard speed indicators with text holders ppt powerpoint presentation summary layout. This is a three stage process. The stages in this process are fuel gauge, gas gauge, fuel containers.

Speedometer Diagram For Growth Analysis Powerpoint Template
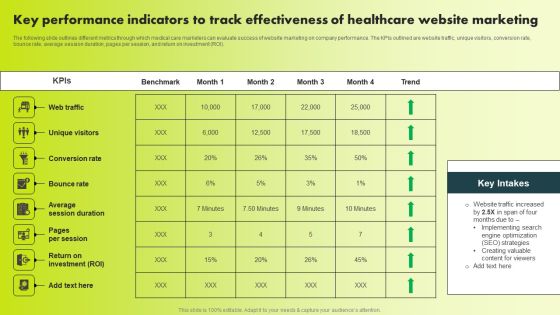
Key Performance Indicators To Track Effectiveness Of Healthcare Website Marketing Themes PDF
The following slide outlines different metrics through which medical care marketers can evaluate success of website marketing on company performance. The KPIs outlined are website traffic, unique visitors, conversion rate, bounce rate, average session duration, pages per session, and return on investment ROI. Whether you have daily or monthly meetings, a brilliant presentation is necessary. Key Performance Indicators To Track Effectiveness Of Healthcare Website Marketing Themes PDF can be your best option for delivering a presentation. Represent everything in detail using Key Performance Indicators To Track Effectiveness Of Healthcare Website Marketing Themes PDF and make yourself stand out in meetings. The template is versatile and follows a structure that will cater to your requirements. All the templates prepared by Slidegeeks are easy to download and edit. Our research experts have taken care of the corporate themes as well. So, give it a try and see the results.

Key Performance Indicators To Track Effectiveness Of Healthcare Social Media Marketing Elements PDF
The following slide outlines various metrics that can assist medical care companies in analyzing success of social media marketing campaign on Facebook, Instagram, LinkedIn, YouTube, and Twitter. The KPIs are engagement rate, brand impressions, follower growth, post views, conversion rate, watch time, etc. Slidegeeks is here to make your presentations a breeze with Key Performance Indicators To Track Effectiveness Of Healthcare Social Media Marketing Elements PDF With our easy-to-use and customizable templates, you can focus on delivering your ideas rather than worrying about formatting. With a variety of designs to choose from, you are sure to find one that suits your needs. And with animations and unique photos, illustrations, and fonts, you can make your presentation pop. So whether you are giving a sales pitch or presenting to the board, make sure to check out Slidegeeks first
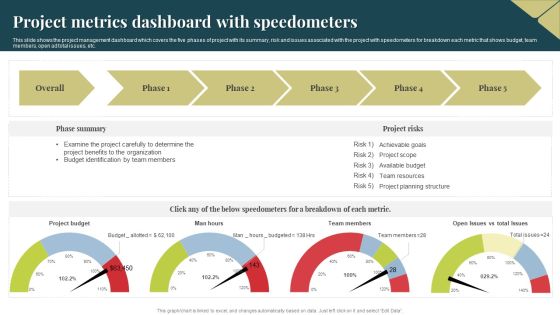
Project Metrics Dashboard With Speedometers Themes PDF
This slide shows the project management dashboard which covers the five phases of project with its summary, risk and issues associated with the project with speedometers for breakdown each metric that shows budget, team members, open ad total issues, etc. Showcasing this set of slides titled Project Metrics Dashboard With Speedometers Themes PDF. The topics addressed in these templates are Budget, Project Benefits, Organization. All the content presented in this PPT design is completely editable. Download it and make adjustments in color, background, font etc. as per your unique business setting.

Business Framework PowerPoint Speedometer PowerPoint Presentation
This image slide displays speedometer diagram with download and upload speed template. This innovative image slide has been designed to depict progress. This image slide is 100% editable. You may change color, size and orientation of any icon to your liking. This image slide may be used in school, business and social presentations. Create amazing presentations using this image slide.
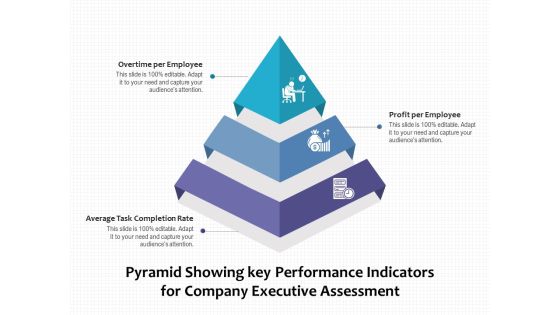
Pyramid Showing Key Performance Indicators For Company Executive Assessment Ppt PowerPoint Presentation Portfolio Rules PDF
Presenting pyramid showing key performance indicators for company executive assessment ppt powerpoint presentation portfolio rules pdf to dispense important information. This template comprises three stages. It also presents valuable insights into the topics including overtime per employee, profit per employee, average task completion rate. This is a completely customizable PowerPoint theme that can be put to use immediately. So, download it and address the topic impactfully.

Pyramid Showing Key Performance Indicators For Ecommerce Website Evaluation Ppt PowerPoint Presentation Portfolio Layout Ideas PDF
Persuade your audience using this pyramid showing key performance indicators for ecommerce website evaluation ppt powerpoint presentation portfolio layout ideas pdf. This PPT design covers three stages, thus making it a great tool to use. It also caters to a variety of topics including average order value, gross profit, shopping cart abandonment rate. Download this PPT design now to present a convincing pitch that not only emphasizes the topic but also showcases your presentation skills.

Pyramid Showing Key Performance Indicators For Healthcare Assessment Ppt PowerPoint Presentation Show Background Image PDF
Presenting pyramid showing key performance indicators for healthcare assessment ppt powerpoint presentation show background image pdf to dispense important information. This template comprises four stages. It also presents valuable insights into the topics including average treatment charge, average hospital stay, bed occupancy rate, average patient wait time. This is a completely customizable PowerPoint theme that can be put to use immediately. So, download it and address the topic impactfully.
Key Performance Indicators Of Nss Electronic Manufacturing Company With Future Targets Icons PDF
Presenting key performance indicators of nss electronic manufacturing company with future targets icons pdf to provide visual cues and insights. Share and navigate important information on five stages that need your due attention. This template can be used to pitch topics like company revenue, labor shortage rate, on standard operating efficiency. In addtion, this PPT design contains high resolution images, graphics, etc, that are easily editable and available for immediate download.

Client Acquisition Journey Plan Performance Indicators For Successful Client Structure PDF
This slide showcases KPIs that showcases success of user onboarding. Major KPIs included are customer engagement, retention and count, average response time, completion and free trial conversion rate. There are so many reasons you need a Client Acquisition Journey Plan Performance Indicators For Successful Client Structure PDF. The first reason is you cant spend time making everything from scratch, Thus, Slidegeeks has made presentation templates for you too. You can easily download these templates from our website easily.

Leading And Lagging Indicators Of Automobile Industries Professional PDF
This slide showcase the some of the key lagging and leading parameter indicators for a car manufacturing industry. It includes parameter such as downtime, throughput time, improving safety incidents, increasing productivity rate. Pitch your topic with ease and precision using this Leading And Lagging Indicators Of Automobile Industries Professional PDF. This layout presents information on Leading Indicators, Lagging Indicators. It is also available for immediate download and adjustment. So, changes can be made in the color, design, graphics or any other component to create a unique layout.

Leading And Lagging Safety Indicators With Status Slides PDF
This slide enable to track the progress of safety goals in order to improve overall performance along with the progress status of each metrics. It incorporates metrics like incident rate,number of lost work days, cost of loss, safety audit score and safety training. Pitch your topic with ease and precision using this Leading And Lagging Safety Indicators With Status Slides PDF. This layout presents information on Safety Indicators, Metrics, Expected, Lagging Indicators. It is also available for immediate download and adjustment. So, changes can be made in the color, design, graphics or any other component to create a unique layout.

Staff Turnover Key Performance Indicators Dashboard Sample PDF
The following slide highlights the staff turnover key performance Indicators dashboard illustrating employee turn over, turn over rate, average tenure, turnover per quarter, turnover per department, turnover type, turnover time period, turnover per position and turnover reasons Deliver and pitch your topic in the best possible manner with this Staff Turnover Key Performance Indicators Dashboard Sample PDF Use them to share invaluable insights on Management Goals, Subjective Appraisal, Product Defects and impress your audience. This template can be altered and modified as per your expectations. So, grab it now.

Call Center Process Key Performance Indicator Dashboard Mockup PDF
This slide showcases call center process measurements and key performance indicators so managers and teams can keep track of and improve performance . It includes received calls, calculating speed of answering calls , ended calls before starting conversations , average calls per minute etc. Showcasing this set of slides titled Call Center Process Key Performance Indicator Dashboard Mockup PDF. The topics addressed in these templates are Received Calls, Conversation, Abandon Rate. All the content presented in this PPT design is completely editable. Download it and make adjustments in color, background, font etc. as per your unique business setting.

Strategies For Integrated Logistics Management Enhancing Order Efficiency Current Integrated Logistics Introduction PDF
This slide shows the current Integrated Logistics Management System Efficiency Indicators of the company that are compared for 3 years. Some indicators are order accuracy rate, on time delivery, average cycle time , inventory accuracy, perfect order rate, overall integrated logistics efficiency etc. Deliver and pitch your topic in the best possible manner with this Strategies For Integrated Logistics Management Enhancing Order Efficiency Current Integrated Logistics Introduction PDF Use them to share invaluable insights on Performance Indicators, Inventory Accuracy, Overall Integrated and impress your audience. This template can be altered and modified as per your expectations. So, grab it now.

Strategies For Integrated Logistics Management Enhancing Order Efficiency Future Integrated Logistics Microsoft PDF
This slide shows the current Integrated Logistics Management System Efficiency Indicators of the company that are compared for 3 years. Some indicators are order accuracy rate, on time delivery, average cycle time , inventory accuracy, perfect order rate, overall integrated logistics efficiency etc. Deliver an awe inspiring pitch with this creative Strategies For Integrated Logistics Management Enhancing Order Efficiency Future Integrated Logistics Microsoft PDF bundle. Topics like Performance Indicators, Inventory Accuracy, Overall Integrated can be discussed with this completely editable template. It is available for immediate download depending on the needs and requirements of the user.

Prospective Buyer Retention Dashboard With Key Performance Indicators Themes PDF
This slide shows the dashboard representing the key performance metrics for retention of potential customers of the organization. It shows no. of active users, churn rate, cost of customer acquisition, their life time value, monthly recurring revenue etc.Pitch your topic with ease and precision using this Prospective Buyer Retention Dashboard With Key Performance Indicators Themes PDF. This layout presents information on Recurring Revenue, Revenue Growth, Customer Acquisition. It is also available for immediate download and adjustment. So, changes can be made in the color, design, graphics or any other component to create a unique layout.
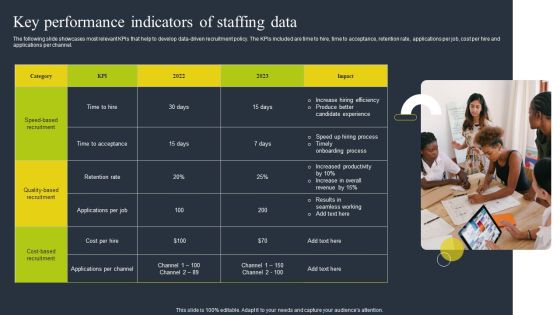
Key Performance Indicators Of Staffing Data Download PDF
The following slide showcases most relevant KPIs that help to develop data driven recruitment policy. The KPIs included are time to hire, time to acceptance, retention rate, applications per job, cost per hire and applications per channel. Persuade your audience using this Key Performance Indicators Of Staffing Data Download PDF. This PPT design covers one stages, thus making it a great tool to use. It also caters to a variety of topics including Quality Based Recruitment, Cost, Applications Per Channel. Download this PPT design now to present a convincing pitch that not only emphasizes the topic but also showcases your presentation skills.

Performance Indicators For Successful Client Onboarding Template PDF
This slide showcases KPIs that showcases success of user onboarding. Major KPIs included are customer engagement, retention and count, average response time, completion and free trial conversion rate. If your project calls for a presentation, then Slidegeeks is your go-to partner because we have professionally designed, easy-to-edit templates that are perfect for any presentation. After downloading, you can easily edit Performance Indicators For Successful Client Onboarding Template PDF and make the changes accordingly. You can rearrange slides or fill them with different images. Check out all the handy templates
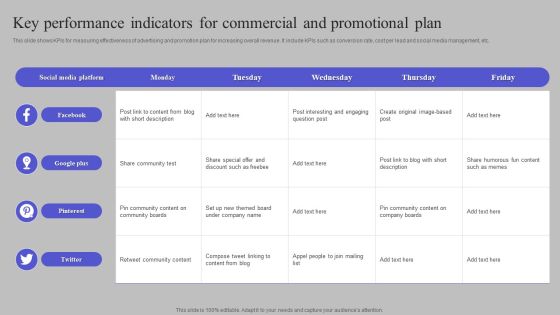
Key Performance Indicators For Commercial And Promotional Plan Information PDF
This slide shows KPIs for measuring effectiveness of advertising and promotion plan for increasing overall revenue. It include KPIs such as conversion rate, cost per lead and social media management, etc. Showcasing this set of slides titled Key Performance Indicators For Commercial And Promotional Plan Information PDF. The topics addressed in these templates are Facebook, Google Plus, Pinterest. All the content presented in this PPT design is completely editable. Download it and make adjustments in color, background, font etc. as per your unique business setting.

Ad Campaign Performance Indicators Tracking Dashboard Diagrams PDF
This slide covers dashboard to measure the performance of ad campaigns on LinkedIn platform. The purpose of this template is to provide the company an overview on the outcomes of running ad campaigns on LinkedIn. It includes performance based on impressions, CTR, engagement rates, CPC, CPM, etc. Find a pre designed and impeccable Ad Campaign Performance Indicators Tracking Dashboard Diagrams PDF. The templates can ace your presentation without additional effort. You can download these easy to edit presentation templates to make your presentation stand out from others. So, what are you waiting for Download the template from Slidegeeks today and give a unique touch to your presentation.

Pyramid Showing Key Performance Indicators For IT Department Performance Evaluation Ppt PowerPoint Presentation Show Graphics Design PDF
Persuade your audience using this pyramid showing key performance indicators for it department performance evaluation ppt powerpoint presentation show graphics design pdf. This PPT design covers five stages, thus making it a great tool to use. It also caters to a variety of topics including it roi, team attrition rate, server downtime, number of new features developed, number of projects completed. Download this PPT design now to present a convincing pitch that not only emphasizes the topic but also showcases your presentation skills.

Construction Sector Project Risk Management Using Leading Metrics To Improve Safety Management Sample PDF
This slide covers the indicators of safety performance, such as total recordable incident rates, and days away and restricted or transferred rates, which are well established in the construction industry. This is a construction sector project risk management using leading metrics to improve safety management sample pdf template with various stages. Focus and dispense information on two stages using this creative set, that comes with editable features. It contains large content boxes to add your information on topics like developing leading indicators, safety database. You can also showcase facts, figures, and other relevant content using this PPT layout. Grab it now.

Kpis To Measure Success Of Market Expansion Efforts Portrait PDF
This slide illustrates major key performing indicators that are used by marketers and top managers to track the effectiveness and success of market development efforts. The key performance indicators market share, revenue growth, distribution channel effectiveness rate, customer retention rate, return on investment. Showcasing this set of slides titled Kpis To Measure Success Of Market Expansion Efforts Portrait PDF. The topics addressed in these templates are Revenue Growth, Market Share, Return On Investment. All the content presented in this PPT design is completely editable. Download it and make adjustments in color, background, font etc. as per your unique business setting.
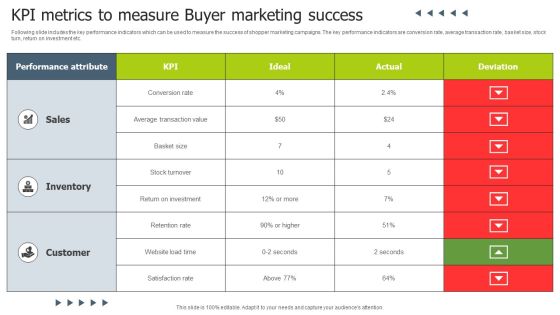
KPI Metrics To Measure Buyer Marketing Success Background PDF
Following slide includes the key performance indicators which can be used to measure the success of shopper marketing campaigns. The key performance indicators are conversion rate, average transaction rate, basket size, stock turn, return on investment etc. Showcasing this set of slides titled KPI Metrics To Measure Buyer Marketing Success Background PDF. The topics addressed in these templates are Performance Attribute, Sales, Inventory. All the content presented in this PPT design is completely editable. Download it and make adjustments in color, background, font etc. as per your unique business setting.

Kpis To Track Roll Out Communication Method Performance Demonstration PDF
This slide presents major key performing indicators which are to be monitored by managers to assess the effectiveness of roll-out communication plan. Major key performance indicators are time spend on a page, bounce rate, new trials, etc. Presenting Kpis To Track Roll Out Communication Method Performance Demonstration PDF to dispense important information. This template comprises one stages. It also presents valuable insights into the topics including Bounce Rate, New Trials, Referrals. This is a completely customizable PowerPoint theme that can be put to use immediately. So, download it and address the topic impactfully.

Customer Decline Of Sales Analysis Dashboard Rules PDF
The following slide presents a key performance indicating dashboards that can be used by managers in order to analyse customer-lost sales. Major key performance indicators are lost deals rate, lost sales rate, customer data analytics, etc. Pitch your topic with ease and precision using this Customer Decline Of Sales Analysis Dashboard Rules PDF. This layout presents information on Customer Data Analytics. It is also available for immediate download and adjustment. So, changes can be made in the color, design, graphics or any other component to create a unique layout.

Capital Kpis To Track Effectiveness Of Marketing Project Communication Plan Mockup PDF
This slide presents major key performing indicators that need to be monitored by managers to monitor the effectiveness of the marketing project communication plan and take the required action. Major key performance indicators are reach, engagement, conversion rate, etc.Showcasing this set of slides titled Capital Kpis To Track Effectiveness Of Marketing Project Communication Plan Mockup PDF The topics addressed in these templates are Engagement, Conversion Rate. All the content presented in this PPT design is completely editable. Download it and make adjustments in color, background, font etc. as per your unique business setting.

Research And Development Engineering Software Performance Metrics Slides PDF
Presenting Research And Development Engineering Software Performance Metrics Slides PDF to dispense important information. This template comprises Six stages. It also presents valuable insights into the topics including Schedule Performance Indicator, Cost Performance Indicator, Outsourcing Rate. This is a completely customizable PowerPoint theme that can be put to use immediately. So, download it and address the topic impactfully.

Automotive Tools With Dial Gauge And Gear Knob Ppt PowerPoint Presentation Gallery Background Image PDF
Presenting this set of slides with name automotive tools with dial gauge and gear knob ppt powerpoint presentation gallery background image pdf. The topics discussed in these slide is automotive tools with dial gauge and gear knob. This is a completely editable PowerPoint presentation and is available for immediate download. Download now and impress your audience.
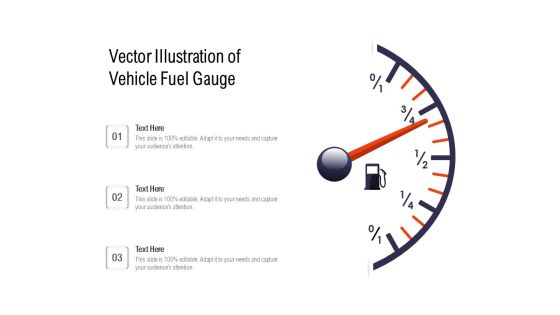
Vector Illustration Of Vehicle Fuel Gauge Ppt PowerPoint Presentation Gallery Introduction PDF
Showcasing this set of slides titled vector illustration of vehicle fuel gauge ppt powerpoint presentation gallery introduction pdf. The topics addressed in these templates are vector illustration of vehicle fuel gauge. All the content presented in this PPT design is completely editable. Download it and make adjustments in color, background, font etc. as per your unique business setting.
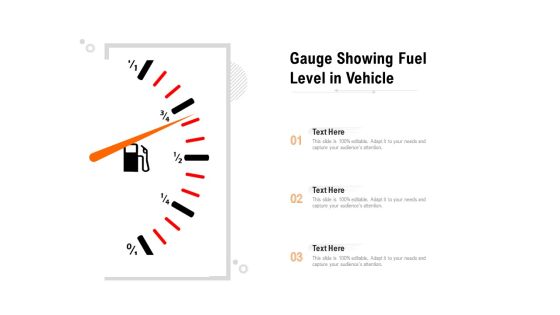
Gauge Showing Fuel Level In Vehicle Ppt PowerPoint Presentation Portfolio Picture PDF
Presenting gauge showing fuel level in vehicle ppt powerpoint presentation portfolio picture pdf to dispense important information. This template comprises three stages. It also presents valuable insights into the topics including gauge showing fuel level in vehicle. This is a completely customizable PowerPoint theme that can be put to use immediately. So, download it and address the topic impactfully.
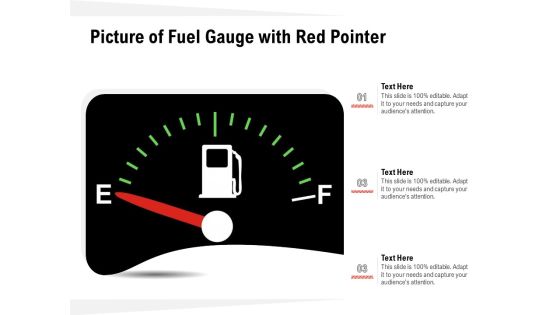
Picture Of Fuel Gauge With Red Pointer Ppt PowerPoint Presentation Show Samples PDF
Presenting picture of fuel gauge with red pointer ppt powerpoint presentation show samples pdf to dispense important information. This template comprises three stages. It also presents valuable insights into the topics including picture of fuel gauge with red pointer. This is a completely customizable PowerPoint theme that can be put to use immediately. So, download it and address the topic impactfully.
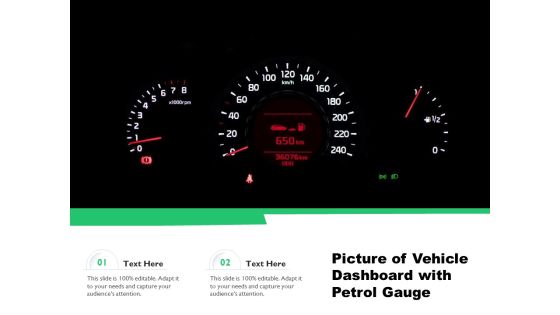
Picture Of Vehicle Dashboard With Petrol Gauge Ppt PowerPoint Presentation Portfolio Ideas PDF
Presenting picture of vehicle dashboard with petrol gauge ppt powerpoint presentation portfolio ideas pdf to dispense important information. This template comprises two stages. It also presents valuable insights into the topics including picture of vehicle dashboard with petrol gauge. This is a completely customizable PowerPoint theme that can be put to use immediately. So, download it and address the topic impactfully.
Vector Illustration Of Fuel Gauge Icon Ppt PowerPoint Presentation Layouts Graphics Design PDF
Presenting vector illustration of fuel gauge icon ppt powerpoint presentation layouts graphics design pdf to dispense important information. This template comprises three stages. It also presents valuable insights into the topics including vector illustration of fuel gauge icon. This is a completely customizable PowerPoint theme that can be put to use immediately. So, download it and address the topic impactfully.

Performance Gauge For Assessing Business Reliability On Technology Ppt PowerPoint Presentation Gallery Pictures PDF
Persuade your audience using this performance gauge for assessing business reliability on technology ppt powerpoint presentation gallery pictures pdf. This PPT design covers three stages, thus making it a great tool to use. It also caters to a variety of topics including performance gauge for assessing business reliability on technology. Download this PPT design now to present a convincing pitch that not only emphasizes the topic but also showcases your presentation skills.
Self Performance Assessment Gauge Vector Icon Ppt PowerPoint Presentation Gallery Slide PDF
Persuade your audience using this self performance assessment gauge vector icon ppt powerpoint presentation gallery slide pdf. This PPT design covers three stages, thus making it a great tool to use. It also caters to a variety of topics including self performance assessment gauge vector icon. Download this PPT design now to present a convincing pitch that not only emphasizes the topic but also showcases your presentation skills.

Picture Of Fuel Gauge With Pointing Level Ppt PowerPoint Presentation Infographic Template Graphics PDF
Persuade your audience using this picture of fuel gauge with pointing level ppt powerpoint presentation infographic template graphics pdf. This PPT design covers two stages, thus making it a great tool to use. It also caters to a variety of topics including picture of fuel gauge with pointing level. Download this PPT design now to present a convincing pitch that not only emphasizes the topic but also showcases your presentation skills.
Picture Of Scooter Dashboard With Fuel Gauge Ppt PowerPoint Presentation File Icon PDF
Persuade your audience using this picture of scooter dashboard with fuel gauge ppt powerpoint presentation file icon pdf. This PPT design covers four stages, thus making it a great tool to use. It also caters to a variety of topics including picture of scooter dashboard with fuel gauge. Download this PPT design now to present a convincing pitch that not only emphasizes the topic but also showcases your presentation skills.
Software Integration WBS System Integration Template Gauge Ppt PowerPoint Presentation Icon Clipart PDF
This is a software integration wbs system integration template gauge ppt powerpoint presentation icon clipart pdf template with various stages. Focus and dispense information on five stages using this creative set, that comes with editable features. It contains large content boxes to add your information on topics like gauge your readiness, understand business context, create a governance system, identify supporting applications, identify required infrastructure. You can also showcase facts, figures, and other relevant content using this PPT layout. Grab it now.
Time Gauge For Work In Progress Vector Icon Ppt Professional Graphic Tips PDF
Persuade your audience using this time gauge for work in progress vector icon ppt professional graphic tips pdf. This PPT design covers three stages, thus making it a great tool to use. It also caters to a variety of topics including time gauge for work in progress vector icon. Download this PPT design now to present a convincing pitch that not only emphasizes the topic but also showcases your presentation skills.
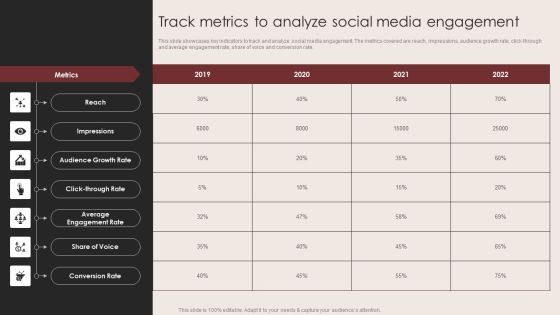
E Commerce Clothing Business Strategy Track Metrics To Analyze Social Media Engagement Background PDF
This slide showcases key indicators to track and analyze social media engagement. The metrics covered are reach, impressions, audience growth rate, click-through and average engagement rate, share of voice and conversion rate.Slidegeeks is one of the best resources for PowerPoint templates. You can download easily and regulate E Commerce Clothing Business Strategy Track Metrics To Analyze Social Media Engagement Background PDF for your personal presentations from our wonderful collection. A few clicks is all it takes to discover and get the most relevant and appropriate templates. Use our Templates to add a unique zing and appeal to your presentation and meetings. All the slides are easy to edit and you can use them even for advertisement purposes.
Online Fashion Firm Summary Track Metrics To Analyze Social Media Engagement Topics PDF
This slide showcases key indicators to track and analyze social media engagement. The metrics covered are reach, impressions, audience growth rate, click-through and average engagement rate, share of voice and conversion rate. Find highly impressive Online Fashion Firm Summary Track Metrics To Analyze Social Media Engagement Topics PDF on Slidegeeks to deliver a meaningful presentation. You can save an ample amount of time using these presentation templates. No need to worry to prepare everything from scratch because Slidegeeks experts have already done a huge research and work for you. You need to download Online Fashion Firm Summary Track Metrics To Analyze Social Media Engagement Topics PDF for your upcoming presentation. All the presentation templates are 100 percent editable and you can change the color and personalize the content accordingly. Download now.
Effective Workforce Participation Action Planning Track Employee Engagement Metrics Score Background PDF
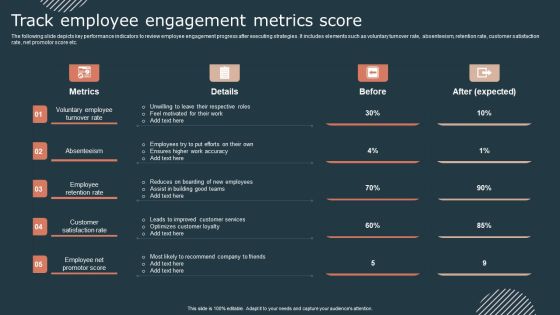
The following slide depicts key performance indicators to review employee engagement progress after executing strategies. It includes elements such as voluntary turnover rate, absenteeism, retention rate, customer satisfaction rate, net promotor score etc. Find highly impressive Effective Workforce Participation Action Planning Track Employee Engagement Metrics Score Background PDF on Slidegeeks to deliver a meaningful presentation. You can save an ample amount of time using these presentation templates. No need to worry to prepare everything from scratch because Slidegeeks experts have already done a huge research and work for you. You need to download Effective Workforce Participation Action Planning Track Employee Engagement Metrics Score Background PDF for your upcoming presentation. All the presentation templates are 100 percent editable and you can change the color and personalize the content accordingly. Download now.

Marketing Tactics To Increase Retail Merchandising Kpis To Measure Marketing Strategy Demonstration PDF
The following slide outline different merchandising key performance indicators that can assist retailers to analyze the marketing campaign performance. The key metrics are sales per employee, customer conversion rate, inventory shrinkage rate, customer retention rate, foot traffic and net profit ratio. Get a simple yet stunning designed Marketing Tactics To Increase Retail Merchandising Kpis To Measure Marketing Strategy Demonstration PDF. It is the best one to establish the tone in your meetings. It is an excellent way to make your presentations highly effective. So, download this PPT today from Slidegeeks and see the positive impacts. Our easy-to-edit Marketing Tactics To Increase Retail Merchandising Kpis To Measure Marketing Strategy Demonstration PDF can be your go-to option for all upcoming conferences and meetings. So, what are you waiting for Grab this template today.

E Commerce Business Track Metrics To Analyze Social Media Engagement Professional PDF
This slide showcases key indicators to track and analyze social media engagement. The metrics covered are reach, impressions, audience growth rate, click-through and average engagement rate, share of voice and conversion rate. This modern and well-arranged E Commerce Business Track Metrics To Analyze Social Media Engagement Professional PDF provides lots of creative possibilities. It is very simple to customize and edit with the Powerpoint Software. Just drag and drop your pictures into the shapes. All facets of this template can be edited with Powerpoint, no extra software is necessary. Add your own material, put your images in the places assigned for them, adjust the colors, and then you can show your slides to the world, with an animated slide included.

Streamlining Operations Through Clothing Business Strategy Track Metrics To Analyze Social Media Pictures PDF
This slide showcases key indicators to track and analyze social media engagement. The metrics covered are reach, impressions, audience growth rate, click-through and average engagement rate, share of voice and conversion rate. Slidegeeks is here to make your presentations a breeze with Streamlining Operations Through Clothing Business Strategy Track Metrics To Analyze Social Media Pictures PDF With our easy to use and customizable templates, you can focus on delivering your ideas rather than worrying about formatting. With a variety of designs to choose from, you are sure to find one that suits your needs. And with animations and unique photos, illustrations, and fonts, you can make your presentation pop. So whether you are giving a sales pitch or presenting to the board, make sure to check out Slidegeeks first.

Tactical Employee Engagement Action Planning Track Employee Engagement Metrics Score Themes PDF
The following slide depicts key performance indicators to review employee engagement progress after executing strategies. It includes elements such as voluntary turnover rate, absenteeism, retention rate, customer satisfaction rate, net promotor score etc. If you are looking for a format to display your unique thoughts, then the professionally designed Tactical Employee Engagement Action Planning Track Employee Engagement Metrics Score Themes PDF is the one for you. You can use it as a Google Slides template or a PowerPoint template. Incorporate impressive visuals, symbols, images, and other charts. Modify or reorganize the text boxes as you desire. Experiment with shade schemes and font pairings. Alter, share or cooperate with other people on your work. Download Tactical Employee Engagement Action Planning Track Employee Engagement Metrics Score Themes PDF and find out how to give a successful presentation. Present a perfect display to your team and make your presentation unforgettable.

Evaluating Financial Position Of E Commerce Company Track Metrics To Analyze Social Media Engagement Brochure PDF
This slide showcases key indicators to track and analyze social media engagement. The metrics covered are reach, impressions, audience growth rate, click through and average engagement rate, share of voice and conversion rate. Do you have an important presentation coming up Are you looking for something that will make your presentation stand out from the rest Look no further than Evaluating Financial Position Of E Commerce Company Track Metrics To Analyze Social Media Engagement Brochure PDF. With our professional designs, you can trust that your presentation will pop and make delivering it a smooth process. And with Slidegeeks, you can trust that your presentation will be unique and memorable. So why wait Grab Evaluating Financial Position Of E Commerce Company Track Metrics To Analyze Social Media Engagement Brochure PDF today and make your presentation stand out from the rest.

Customer Retention With Email Advertising Campaign Plan Forecasted Impact Of Email Marketing On Business Designs PDF
Following slide demonstrates predicted impact of email marketing strategy on organisation performance which can be used to improve business profitability. It includes key performance indicators such as website traffic, customer engagement rate, customer conversion rate, retention rate, and per-customer acquisition cost. Crafting an eye catching presentation has never been more straightforward. Let your presentation shine with this tasteful yet straightforward Customer Retention With Email Advertising Campaign Plan Forecasted Impact Of Email Marketing On Business Designs PDF template. It offers a minimalistic and classy look that is great for making a statement. The colors have been employed intelligently to add a bit of playfulness while still remaining professional. Construct the ideal Customer Retention With Email Advertising Campaign Plan Forecasted Impact Of Email Marketing On Business Designs PDF that effortlessly grabs the attention of your audience. Begin now and be certain to wow your customers.

Analyzing And Improving Staff Work Satisfaction Track Employee Engagement Metrics Score Portrait PDF
The following slide depicts key performance indicators to review employee engagement progress after executing strategies. It includes elements such as voluntary turnover rate, absenteeism, retention rate, customer satisfaction rate, net promotor score etc. Do you have an important presentation coming up Are you looking for something that will make your presentation stand out from the rest Look no further than Analyzing And Improving Staff Work Satisfaction Track Employee Engagement Metrics Score Portrait PDF. With our professional designs, you can trust that your presentation will pop and make delivering it a smooth process. And with Slidegeeks, you can trust that your presentation will be unique and memorable. So why wait Grab Analyzing And Improving Staff Work Satisfaction Track Employee Engagement Metrics Score Portrait PDF today and make your presentation stand out from the rest.

Apparel Ecommerce Business Strategy Track Metrics To Analyze Social Media Engagement Portrait PDF
This slide showcases key indicators to track and analyze social media engagement. The metrics covered are reach, impressions, audience growth rate, click through and average engagement rate, share of voice and conversion rate. Slidegeeks is here to make your presentations a breeze with Apparel Ecommerce Business Strategy Track Metrics To Analyze Social Media Engagement Portrait PDF With our easy to use and customizable templates, you can focus on delivering your ideas rather than worrying about formatting. With a variety of designs to choose from, you are sure to find one that suits your needs. And with animations and unique photos, illustrations, and fonts, you can make your presentation pop. So whether you are giving a sales pitch or presenting to the board, make sure to check out Slidegeeks first.
QA Modification For Product Quality Development And Consumer Satisfaction Estimated QA Key Performance Summary PDF
This slide shows the Estimated QA Quality Assurance Key Performance Indicators after Strategy Implementation. These stats are related to Active Defect Rate, Automated Testing Rate, Product Quality, Overall Team Effectiveness, Average Product Delivery Time etc. from the years 2021 to 2023 along with key takeaways. Deliver and pitch your topic in the best possible manner with this qa modification for product quality development and consumer satisfaction estimated qa key performance summary pdf. Use them to share invaluable insights on parameters, team effectiveness, product quality, performance and impress your audience. This template can be altered and modified as per your expectations. So, grab it now.
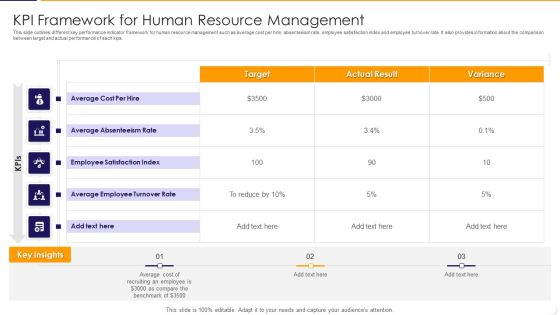
KPI Framework For Human Resource Management Ppt PowerPoint Presentation Gallery Portrait PDF
This slide outlines different key performance indicator framework for human resource management such as average cost per hire, absenteeism rate, employee satisfaction index and employee turnover rate. It also provides information about the comparison between target and actual performance of each kips. Pitch your topic with ease and precision using this kpi framework for human resource management ppt powerpoint presentation gallery portrait pdf This layout presents information on average, cost, target It is also available for immediate download and adjustment. So, changes can be made in the color, design, graphics or any other component to create a unique layout.
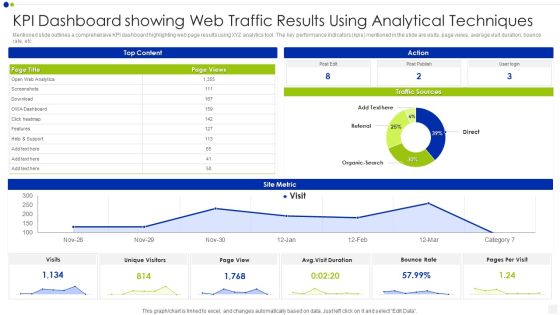
KPI Dashboard Showing Web Traffic Results Using Analytical Techniques Inspiration PDF
Mentioned slide outlines a comprehensive KPI dashboard highlighting web page results using XYZ analytics tool. The key performance indicators kpis mentioned in the slide are visits, page views, average visit duration, bounce rate, etc. Pitch your topic with ease and precision using this kpi dashboard showing web traffic results using analytical techniques inspiration pdf. This layout presents information on bounce rate, traffic sources, analytics. It is also available for immediate download and adjustment. So, changes can be made in the color, design, graphics or any other component to create a unique layout.

Continuous Enhancement Strategy Kpis To Measure The Growth Of Operational Strategy Inspiration PDF
Purpose of the following slide is to show the KPIs or key performance indicators for measuring the progress of operational strategy. These KPIs can be customer satisfaction rate, net promoter score, Downtime etc. This is a Continuous Enhancement Strategy Kpis To Measure The Growth Of Operational Strategy Inspiration PDF template with various stages. Focus and dispense information on four stages using this creative set, that comes with editable features. It contains large content boxes to add your information on topics like Customer KPIs, Employee KPIs, Production KPIs, Customer Satisfaction rate. You can also showcase facts, figures, and other relevant content using this PPT layout. Grab it now.

KPI Dashboard To Measure Performance Post Implementing Video Promotion Techniques Ideas PDF
This slide signifies the key performance indicator dashboard to measure performance post implementing video promotion techniques. It covers information regarding to the engagement rate, audience retention, views and click through rate. Pitch your topic with ease and precision using this KPI Dashboard To Measure Performance Post Implementing Video Promotion Techniques Ideas PDF. This layout presents information on Engagement, Audience Retention, Watch Time. It is also available for immediate download and adjustment. So, changes can be made in the color, design, graphics or any other component to create a unique layout.
 Home
Home