Rating Meter

Customer Satisfaction Rating Meter Feedback Rating Scale Sale Services Excellent Ppt PowerPoint Presentation Complete Deck
Presenting this set of slides with name customer satisfaction rating meter feedback rating scale sale services excellent ppt powerpoint presentation complete deck. The topics discussed in these slides are feedback rating scale, sale services, excellent, product, services. This is a completely editable PowerPoint presentation and is available for immediate download. Download now and impress your audience.
Good Better Best Rating Meter With Icons Ppt Powerpoint Presentation Outline Vector
This is a good better best rating meter with icons ppt powerpoint presentation outline vector. This is a three stage process. The stages in this process are good better best, good great superb, good great excellent.
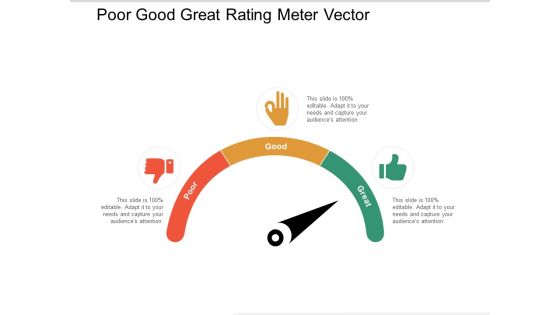
Poor Good Great Rating Meter Vector Ppt PowerPoint Presentation Show Slide Download
Presenting this set of slides with name poor good great rating meter vector ppt powerpoint presentation show slide download. This is a three stage process. The stages in this process are product quality, product improvement, rating scale. This is a completely editable PowerPoint presentation and is available for immediate download. Download now and impress your audience.
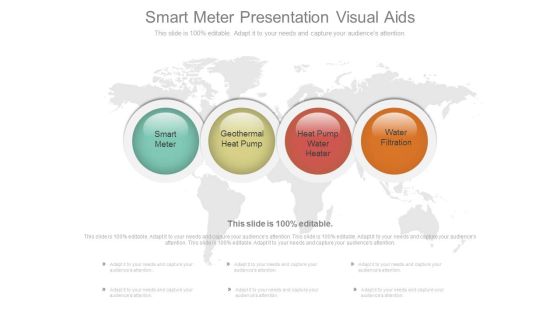
Smart Meter Presentation Visual Aids
This is a smart meter presentation visual aids. This is a four stage process. The stages in this process are smart meter, geothermal heat pump, heat pump water heater, water filtration.

Risk Tolerance Analysis Meter Ppt Slides
This is a risk tolerance analysis meter ppt slides. This is a two stage process. The stages in this process are business, communication, technology.

Product Quality Check Meter Presentation Layouts
This is a product quality check meter presentation layouts. This is a five stage process. The stages in this process are bad, poor, average, good, excellent.
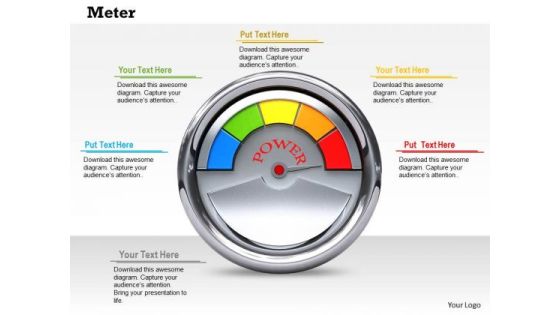
Stock Photo Meter Power PowerPoint Slide
This image contains graphics of 3d power meter . This image is an excellent tool to give an ideal presentation. Special effects of this image will surely interest the audience.
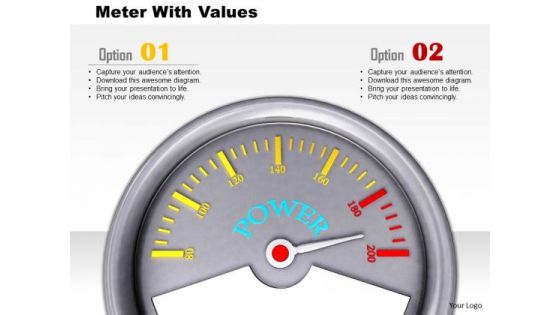
Stock Photo Meter With Values PowerPoint Slide
This image contains graphics of 3d power meter . This image is an excellent tool to give an ideal presentation. Special effects of this image will surely interest the audience.
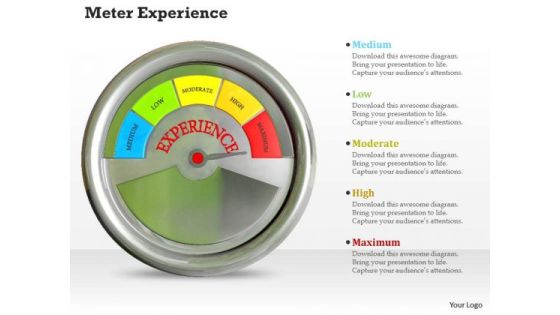
Stock Photo Meter Experience PowerPoint Slide
This image contains graphics of 3d meter indicating maximum level of experience. This image is an excellent tool to give an ideal presentation. Special effects of this image will surely interest the audience.

Meter For Competitive Advantage Presentation Template
This pre-designed diagram of meter signifies the concept of competitive advantage. This template is carefully designed to look interesting and informative. Use this theme to give unified look to your presentations.
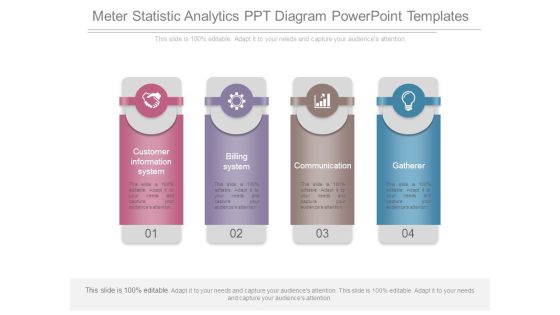
Meter Statistic Analytics Ppt Diagram Powerpoint Templates
This is a meter statistic analytics ppt diagram powerpoint templates. This is a four stage process. The stages in this process are customer information system, billing system, communication, gatherer.

Alarm Clock With Speed Meter Powerpoint Templates
Our above PPT slide contains graphics of alarm clock with speed meter. This PowerPoint template helps to display concept of deadlines and performance. Use this diagram to create more sound impact on viewers.
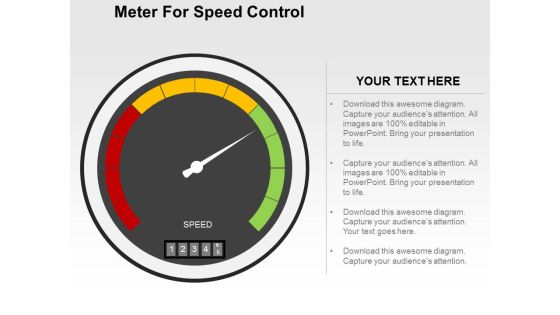
Meter For Speed Control Powerpoint Templates
Our professionally designed business diagram is as an effective tool for communicating business ideas and strategies for corporate planning. It contains graphics of speed control meter. Above slide is suitable to display business options with technology.

World Gasoline Meter Geographical PowerPoint Template 0810
We are running on empty and encreasing our dependency on oil.
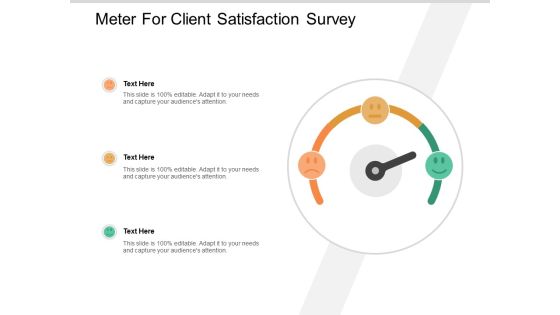
Meter For Client Satisfaction Survey Ppt PowerPoint Presentation Portfolio Outline
Presenting this set of slides with name meter for client satisfaction survey ppt powerpoint presentation portfolio outline. This is a three stage process. The stages in this process are product quality, product improvement, rating scale. This is a completely editable PowerPoint presentation and is available for immediate download. Download now and impress your audience.
Risk Meter Indicating Extreme Level Ppt PowerPoint Presentation Icon Template
This is a risk meter indicating extreme level ppt powerpoint presentation icon template. This is a five stage process. The stages in this process are risk meter, risk speedometer, hazard meter.

Risk Meter Indicating Medium Risk Ppt PowerPoint Presentation Ideas Graphics
This is a risk meter indicating medium risk ppt powerpoint presentation ideas graphics. This is a three stage process. The stages in this process are risk meter, risk speedometer, hazard meter.

Three Levels Risk Assessment Meter Ppt PowerPoint Presentation Infographics Themes
This is a three levels risk assessment meter ppt powerpoint presentation infographics themes. This is a three stage process. The stages in this process are risk meter, risk speedometer, hazard meter.

Sales Team Performance Meter Ppt PowerPoint Presentation Diagrams
This is a sales team performance meter ppt powerpoint presentation diagrams. This is a five stage process. The stages in this process are business, meter, speed, time, sales.

Glauco Meter Medical PowerPoint Background And Template 1210
Microsoft PowerPoint Template and Background with Digital illustration of glucose meter in color background.

Business Diagram Meter Pointing On Poor Word Presentation Template
Graphic of meter has been used to design this power point template. This diagram contains the graphic of meter to display performance levels. Use this business diagram to make attractive presentations.

Stock Photo 3d Meter With Maximum Value PowerPoint Slide
This image of 3d meter is very useful for presentations about growth and success. This high quality image has graphics of 3d meter pointing at maximum value. Create eye-catching presentation using this image.
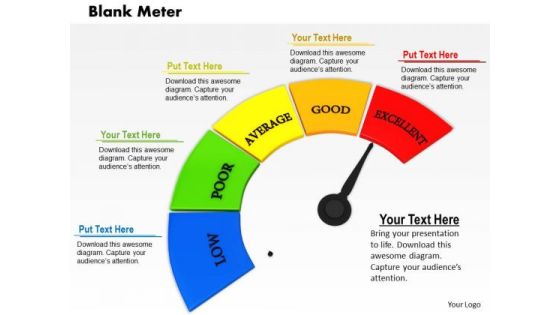
Stock Photo Meter With Red Maximum Value PowerPoint Slide
This image of 3d meter is very useful for presentations about growth and success. This high quality image has graphics of 3d meter pointing at maximum value. Create eye-catching presentation using this image.
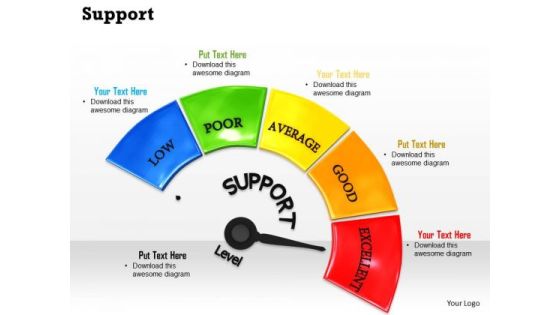
Stock Photo Support Meter With Excellent Level Pwerpoint Slide
This graphic image has been crafted with graphic of meter which have text support. This image shows the excellent level on the meter. Judge the quality of support for any business and display it in your presentation.

Strategy Diagram Meter Design For Business Progress Sales Diagram
Our Strategy Diagram Meter Design For Business Progress Sales Diagram Powerpoint Templates Abhor Doodling. They Never Let The Interest Flag.

Consulting Diagram Business Dashboard Progress Meter Business Diagram
Be The Doer With Our Consulting Diagram Business Dashboard Progress Meter Business Diagram Powerpoint Templates. Put Your Thoughts Into Practice.

Meter Gauge Icon For Energy Consumption Statistics Diagrams PDF
Presenting Meter Gauge Icon For Energy Consumption Statistics Diagrams PDF to dispense important information. This template comprises three stages. It also presents valuable insights into the topics including Meter Gauge, Icon For Energy, Consumption Statistics. This is a completely customizable PowerPoint theme that can be put to use immediately. So, download it and address the topic impactfully.
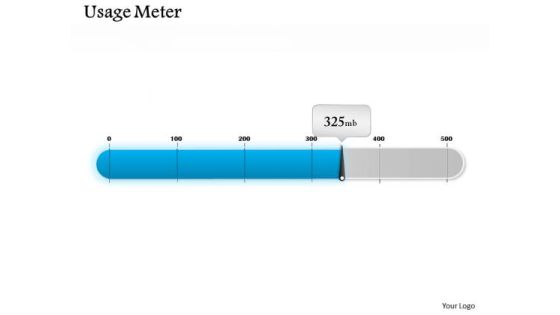
Mba Models And Frameworks Usage Meter Dashboard Design Consulting Diagram
Doll Up Your Thoughts With Our MBA Models And Frameworks Usage Meter Dashboard Design Consulting Diagram Powerpoint Templates. They Will Make A Pretty Picture.

Strategic Management Progress Meter Dashboard Design Marketing Diagram
Be A Donor Of Great Ideas. Display Your Charity On Our Strategic Management Progress Meter Dashboard Design Marketing Diagram Powerpoint Templates.

Business Framework Model Dashboard Business Meter Design Sales Diagram
Our Business Framework Model Dashboard Business Meter Design Sales Diagram Powerpoint Templates Team Are A Dogged Lot. They Keep At It Till They Get It Right.

Sales Diagram Dashboard Meter For Business Information Business Diagram
Our Sales Diagram Dashboard Meter For Business Information Business Diagram Powerpoint Templates Deliver At Your Doorstep. Let Them In For A Wonderful Experience.

Stock Photo Business Meter Displaying Maximum Value PowerPoint Slide
This PowerPoint slide displays business meter displaying maximum value. This image slide has been crafted with graphic of business meter with values. This image depicts business progress. Use this image slide to express views on success and achievements in your presentations. This image slide may also be used to display successful business model. Enhance the quality of your presentations using this image.

Dashboard Meter On Excel Ppt PowerPoint Presentation Icon Slides PDF
Showcasing this set of slides titled dashboard meter on excel ppt powerpoint presentation icon slides pdf. The topics addressed in these templates are dashboard meter on excel. All the content presented in this PPT design is completely editable. Download it and make adjustments in color, background, font etc. as per your unique business setting.
Fuel Meter Vector Icon Ppt PowerPoint Presentation Professional Examples PDF
Persuade your audience using this fuel meter vector icon ppt powerpoint presentation professional examples pdf. This PPT design covers four stages, thus making it a great tool to use. It also caters to a variety of topics including fuel meter vector icon. Download this PPT design now to present a convincing pitch that not only emphasizes the topic but also showcases your presentation skills.

Workforce Performance Measurement Meter Icon Ppt Portfolio Layouts PDF
Presenting Workforce Performance Measurement Meter Icon Ppt Portfolio Layouts PDF to dispense important information. This template comprises one stages. It also presents valuable insights into the topics including Workforce, Performance Measurement, Meter Icon. This is a completely customizable PowerPoint theme that can be put to use immediately. So, download it and address the topic impactfully.
Employee Work Performance Monitoring Meter Icon Background PDF
Showcasing this set of slides titled Employee Work Performance Monitoring Meter Icon Background PDF. The topics addressed in these templates are Monitoring Meter Icon, Employee Work Performance. All the content presented in this PPT design is completely editable. Download it and make adjustments in color, background, font etc. as per your unique business setting.
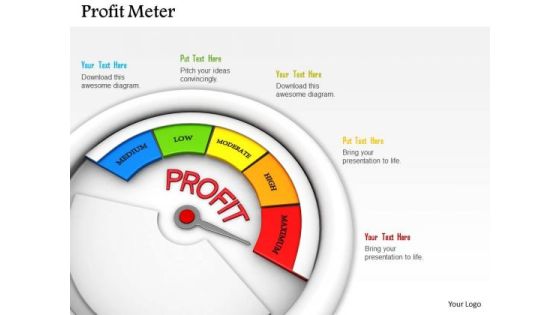
Stock Photo Meter Indicating Maximum Level Of Profit PowerPoint Slide
Display the concept of profit growth with this image. This image has been designed with graphics of meter indicating maximum level of profit. Use this image to make business presentations.

Stock Photo Meter Indicating Maximum Quality Level PowerPoint Slide
This image has been designed with graphics of meter indicating maximum level of quality. Concept of maintaining best quality can be explained with this image. Use this image to make business presentations.
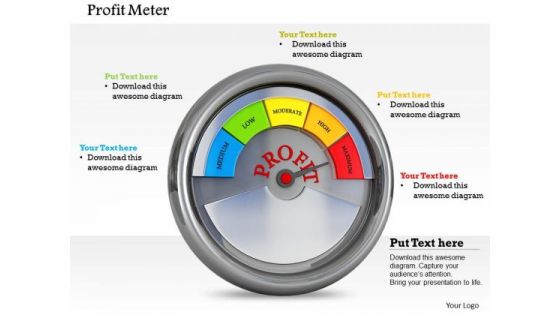
Stock Photo Profit Meter At Maximum Level PowerPoint Slide
Display the concept of profit growth with this image. This image has been designed with graphics of meter indicating maximum level of profit. Use this image to make business presentations.

Business Diagram Meter For Strategy Implementation Process Presentation Template
This business diagram has been designed with graphic of meter displaying YTD growth. Use this slide to exhibit strategy implementation process. Use this slide for your business and marketing related presentations.

Product Quality Assurance Meter Ppt PowerPoint Presentation Slide Download
This is a product quality assurance meter ppt powerpoint presentation slide download. This is a five stage process. The stages in this process are bad, poor, average, good, excellent.

Accelerator Meter Speed Icon Ppt Powerpoint Presentation Professional Good
This is a accelerator meter speed icon ppt powerpoint presentation professional good. This is a three stage process. The stages in this process are accelerator, seed accelerators, startup accelerator.

Accelerator Speed Meter Icon Ppt Powerpoint Presentation Outline Layout
This is a accelerator speed meter icon ppt powerpoint presentation outline layout. This is a four stage process. The stages in this process are accelerator, seed accelerators, startup accelerator.
Speed Level Meter Icon Ppt Powerpoint Presentation Inspiration Slides
This is a speed level meter icon ppt powerpoint presentation inspiration slides. This is a four stage process. The stages in this process are accelerator, seed accelerators, startup accelerator.
Speed Meter Vector Icon Ppt Powerpoint Presentation Model Inspiration
This is a speed meter vector icon ppt powerpoint presentation model inspiration. This is a four stage process. The stages in this process are accelerator, seed accelerators, startup accelerator.
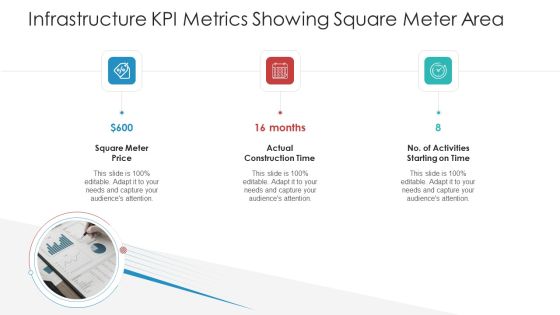
Infrastructure KPI Metrics Showing Square Meter Area Introduction PDF
This is a infrastructure kpi metrics showing square meter area introduction pdf template with various stages. Focus and dispense information on three stages using this creative set, that comes with editable features. It contains large content boxes to add your information on topics like square meter price actual, construction time, no of activities starting on time. You can also showcase facts, figures, and other relevant content using this PPT layout. Grab it now.

Stock Photo Meter Showing Excellent Level Of Quality PowerPoint Slide
This image is designed with 3d meter with business quality representation. Use this image in any business presentations to display various quality levels. This image is a powerful tool for business processes to exhibit quality and its levels along with its factors.

Current Detecting Meter Vector Icon Ppt PowerPoint Presentation Introduction
Presenting this set of slides with name current detecting meter vector icon ppt powerpoint presentation introduction. The topics discussed in these slides are Marketing, Business, Management, Planning, Strategy. This is a completely editable PowerPoint presentation and is available for immediate download. Download now and impress your audience.
Digits Meter Vector Icon Ppt Powerpoint Presentation Inspiration Portfolio
Presenting this set of slides with name digits meter vector icon ppt powerpoint presentation inspiration portfolio. The topics discussed in these slides are number icon, mathematical, number bar vector. This is a completely editable PowerPoint presentation and is available for immediate download. Download now and impress your audience.

Odograph Scrolling Meter Speed Ppt PowerPoint Presentation Complete Deck
Boost your confidence and team morale with this well-structured odograph scrolling meter speed ppt powerpoint presentation complete deck. This prefabricated set gives a voice to your presentation because of its well-researched content and graphics. Our experts have added all the components very carefully, thus helping you deliver great presentations with a single click. Not only that, it contains a set of twelven slides that are designed using the right visuals, graphics, etc. Various topics can be discussed, and effective brainstorming sessions can be conducted using the wide variety of slides added in this complete deck. Apart from this, our PPT design contains clear instructions to help you restructure your presentations and create multiple variations. The color, format, design anything can be modified as deemed fit by the user. Not only this, it is available for immediate download. So, grab it now.

Credit Score Meter Ppt PowerPoint Presentation Complete Deck With Slides
If designing a presentation takes a lot of your time and resources and you are looking for a better alternative, then this Credit Score Meter Ppt PowerPoint Presentation Complete Deck With Slides is the right fit for you. This is a prefabricated set that can help you deliver a great presentation on the topic. All the ten slides included in this sample template can be used to present a birds-eye view of the topic. These slides are also fully editable, giving you enough freedom to add specific details to make this layout more suited to your business setting. Apart from the content, all other elements like color, design, theme are also replaceable and editable. This helps in designing a variety of presentations with a single layout. Not only this, you can use this PPT design in formats like PDF, PNG, and JPG once downloaded. Therefore, without any further ado, download and utilize this sample presentation as per your liking.
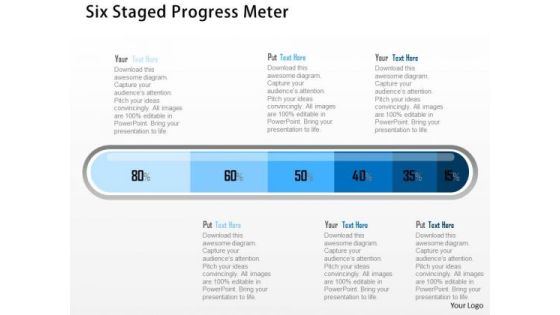
Business Diagram Six Staged Progress Meter Presentation Template
Our above business slide displays graphics of progress meter. This slide can be used as value chain example. This diagram provides an effective way of displaying information you can edit text, color, shade and style as per you need.
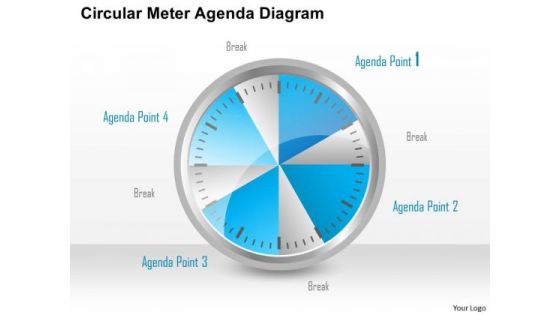
Consulting Slides Circular Meter Agenda Diagram Business Presentation
This circular process layout helps to describe the ordered set of steps required to complete a task. You can download this diagram to make awesome presentations in PowerPoint.

Key Requirements For Aviation Fuel Sustainability Rating System Formats PDF
This slide covers various requirements in the process of obtaining sustainable rating for aviation fuel. It includes elements such as stakeholders such as companies, trade association, government agencies, government regulations, international standards bureau resulting in supplier certification, suppliers declarations, etc. Showcasing this set of slides titled Key Requirements For Aviation Fuel Sustainability Rating System Formats PDF. The topics addressed in these templates are Criteria Indicator, Inputs, Rating System Operator. All the content presented in this PPT design is completely editable. Download it and make adjustments in color, background, font etc. as per your unique business setting.

Supplier Audit And Assessment Rating Summary Background PDF
This slide represents supplier audit and assessment scorecard report illustrating areas such as cost, customer service and quality, key performance indicators, performance target etc. Showcasing this set of slides titled Supplier Audit And Assessment Rating Summary Background PDF. The topics addressed in these templates are Customer Service, Quality, Cost. All the content presented in this PPT design is completely editable. Download it and make adjustments in color, background, font etc. as per your unique business setting.
Red Yellow Green Meter With Emoticons For Feedback Ppt PowerPoint Presentation Ideas Template
Presenting this set of slides with name red yellow green meter with emoticons for feedback ppt powerpoint presentation ideas template. This is a three stage process. The stages in this process are product quality, product improvement, rating scale. This is a completely editable PowerPoint presentation and is available for immediate download. Download now and impress your audience.

Meter Gauge Showing Three Levels Of Risk Ppt PowerPoint Presentation Pictures Graphics
This is a meter gauge showing three levels of risk ppt powerpoint presentation pictures graphics. This is a four stage process. The stages in this process are risk meter, risk speedometer, hazard meter.

Hazard Meter Showing Three Danger Levels Ppt PowerPoint Presentation Infographic Template Examples
This is a hazard meter showing three danger levels ppt powerpoint presentation infographic template examples. This is a five stage process. The stages in this process are risk meter, risk speedometer, hazard meter.

Meter Showing Moderate Level Of Risk Ppt PowerPoint Presentation Model Summary
This is a meter showing moderate level of risk ppt powerpoint presentation model summary. This is a four stage process. The stages in this process are risk meter, risk speedometer, hazard meter.

Risk Meter With Pointer In Center Showing Medium Level Ppt PowerPoint Presentation Portfolio Templates
This is a risk meter with pointer in center showing medium level ppt powerpoint presentation portfolio templates. This is a three stage process. The stages in this process are risk meter, risk speedometer, hazard meter.

Stock Photo 3d Unique Meter With Low Medium And High Value PowerPoint Slide
This professional image displays graphics of conceptual meter. This meter depicts various levels. You can download this image to make presentations on team performance. Above image provides the ideal backdrop to make interactive presentations.

Amount Of Energy Consumed Shown In Electricity Meter Ppt PowerPoint Presentation File Graphic Tips PDF
Showcasing this set of slides titled amount of energy consumed shown in electricity meter ppt powerpoint presentation file graphic tips pdf. The topics addressed in these templates are amount of energy consumed shown in electricity meter. All the content presented in this PPT design is completely editable. Download it and make adjustments in color, background, font etc. as per your unique business setting.
Electricity Meter With Gear Vector Icon Ppt PowerPoint Presentation File Icons PDF
Presenting this set of slides with name electricity meter with gear vector icon ppt powerpoint presentation file icons pdf. This is a three stage process. The stages in this process are electricity meter with gear vector icon. This is a completely editable PowerPoint presentation and is available for immediate download. Download now and impress your audience.

Digital Electricity Meter Hanging On Wall Ppt PowerPoint Presentation File Layouts PDF
Pitch your topic with ease and precision using this digital electricity meter hanging on wall ppt powerpoint presentation file layouts pdf. This layout presents information on digital electricity meter hanging on wall. It is also available for immediate download and adjustment. So, changes can be made in the color, design, graphics or any other component to create a unique layout.

Measuring Electricity Voltage On Multi Meter Device Ppt PowerPoint Presentation Gallery Pictures PDF
Pitch your topic with ease and precision using this measuring electricity voltage on multi meter device ppt powerpoint presentation gallery pictures pdf. This layout presents information on measuring electricity voltage on multi meter device. It is also available for immediate download and adjustment. So, changes can be made in the color, design, graphics or any other component to create a unique layout.

Technician Installing Electricity Meter At Construction Site Ppt PowerPoint Presentation File Slideshow PDF
Pitch your topic with ease and precision using this technician installing electricity meter at construction site ppt powerpoint presentation file slideshow pdf. This layout presents information on technician installing electricity meter at construction site. It is also available for immediate download and adjustment. So, changes can be made in the color, design, graphics or any other component to create a unique layout.
Electrician Checking Power Meter For Proper Functioning Ppt PowerPoint Presentation Icon Model PDF
Showcasing this set of slides titled electrician checking power meter for proper functioning ppt powerpoint presentation icon model pdf. The topics addressed in these templates are electrician checking power meter for proper functioning. All the content presented in this PPT design is completely editable. Download it and make adjustments in color, background, font etc. as per your unique business setting.

Person Checking Power Meter For Identifying Fault Ppt PowerPoint Presentation Gallery Mockup PDF
Pitch your topic with ease and precision using this person checking power meter for identifying fault ppt powerpoint presentation gallery mockup pdf. This layout presents information on person checking power meter for identifying fault. It is also available for immediate download and adjustment. So, changes can be made in the color, design, graphics or any other component to create a unique layout.
Picture Of Three Phase Power Meter Ppt PowerPoint Presentation Icon Outline PDF
Showcasing this set of slides titled picture of three phase power meter ppt powerpoint presentation icon outline pdf. The topics addressed in these templates are picture of three phase power meter. All the content presented in this PPT design is completely editable. Download it and make adjustments in color, background, font etc. as per your unique business setting.
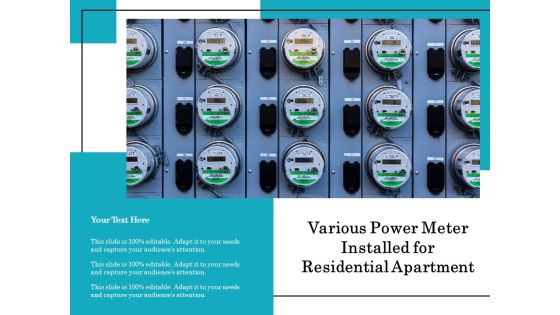
Various Power Meter Installed For Residential Apartment Ppt PowerPoint Presentation Gallery Layouts PDF
Showcasing this set of slides titled various power meter installed for residential apartment ppt powerpoint presentation gallery layouts pdf. The topics addressed in these templates are various power meter installed for residential apartment. All the content presented in this PPT design is completely editable. Download it and make adjustments in color, background, font etc. as per your unique business setting.

Various Power Meter Panel In Factory Control Room Ppt PowerPoint Presentation Gallery Smartart PDF
Pitch your topic with ease and precision using this various power meter panel in factory control room ppt powerpoint presentation gallery smartart pdf. This layout presents information on various power meter panel in factory control room. It is also available for immediate download and adjustment. So, changes can be made in the color, design, graphics or any other component to create a unique layout.

Half Yearly Marketing Scheme Diagram For Electric Meter Accuracy Ppt PowerPoint Presentation Gallery Maker PDF
Persuade your audience using this half yearly marketing scheme diagram for electric meter accuracy ppt powerpoint presentation gallery maker pdf. This PPT design covers six stages, thus making it a great tool to use. It also caters to a variety of topics including half yearly marketing scheme diagram for electric meter accuracy. Download this PPT design now to present a convincing pitch that not only emphasizes the topic but also showcases your presentation skills.
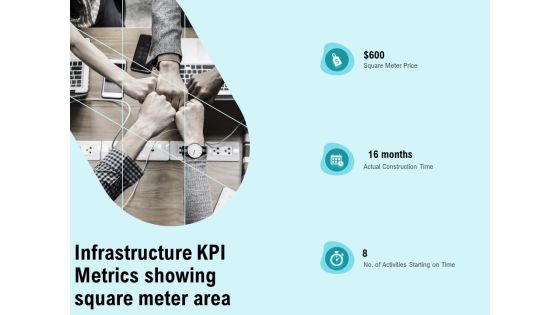
Facility Operations Contol Infrastructure Kpi Metrics Showing Square Meter Area Background PDF
Presenting this set of slides with name facility operations contol infrastructure kpi metrics showing square meter area background pdf. This is a three stage process. The stages in this process are square meter price, actual construction time, no. of activities starting on time . This is a completely editable PowerPoint presentation and is available for immediate download. Download now and impress your audience.

Construction Production Facilities Infrastructure KPI Metrics Showing Square Meter Area Rules PDF
Presenting this set of slides with name construction production facilities infrastructure kpi metrics showing square meter area rules pdf. This is a three stage process. The stages in this process are square meter price, actual construction time, no. of activities starting on time . This is a completely editable PowerPoint presentation and is available for immediate download. Download now and impress your audience.
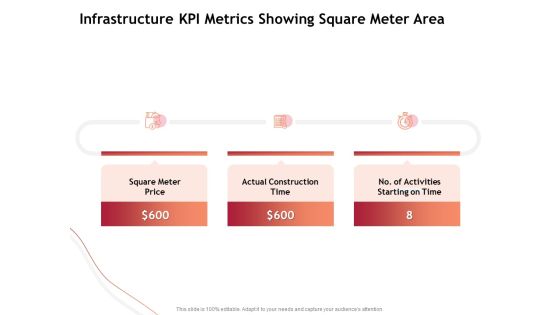
Performance Measuement Of Infrastructure Project Infrastructure KPI Metrics Showing Square Meter Area Download PDF
Presenting this set of slides with name performance measuement of infrastructure project infrastructure kpi metrics showing square meter area download pdf. This is a three stage process. The stages in this process are square meter price, actual construction time, number of activities starting on time. This is a completely editable PowerPoint presentation and is available for immediate download. Download now and impress your audience.

Functional Analysis Of Business Operations Infrastructure KPI Metrics Showing Square Meter Area Mockup PDF
Presenting this set of slides with name functional analysis of business operations infrastructure kpi metrics showing square meter area mockup pdf. This is a three stage process. The stages in this process are square meter price, construction time, activities starting. This is a completely editable PowerPoint presentation and is available for immediate download. Download now and impress your audience.
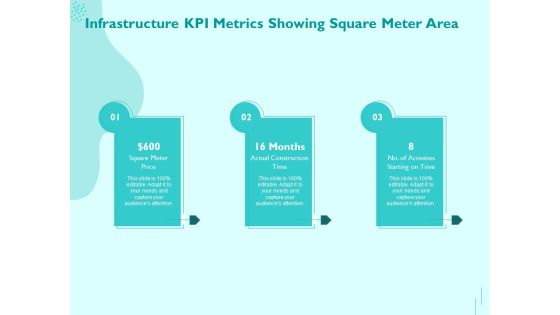
Managing IT Operating System Infrastructure KPI Metrics Showing Square Meter Area Infographics PDF
Presenting this set of slides with name managing it operating system infrastructure kpi metrics showing square meter area infographics pdf. This is a three stage process. The stages in this process are square meter price, actual construction time, no. of activities starting on time. This is a completely editable PowerPoint presentation and is available for immediate download. Download now and impress your audience.
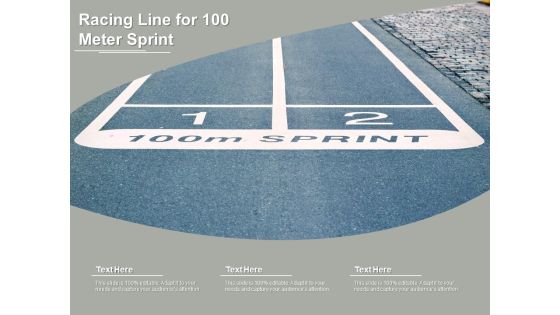
Racing Line For 100 Meter Sprint Ppt PowerPoint Presentation Gallery Picture PDF
Presenting this set of slides with name racing line for 100 meter sprint ppt powerpoint presentation gallery picture pdf. The topics discussed in these slide is racing line for 100 meter sprint. This is a completely editable PowerPoint presentation and is available for immediate download. Download now and impress your audience.

Client Satisfaction Level Meter Vector Icon Ppt PowerPoint Presentation Gallery Structure PDF
Presenting this set of slides with name client satisfaction level meter vector icon ppt powerpoint presentation gallery structure pdf. This is a three stage process. The stages in this process are client satisfaction level meter vector icon. This is a completely editable PowerPoint presentation and is available for immediate download. Download now and impress your audience.
Meter Showing High Risk Level Vector Icon Ppt PowerPoint Presentation Gallery Clipart PDF
Presenting this set of slides with name meter showing high risk level vector icon ppt powerpoint presentation gallery clipart pdf. This is a one stage process. The stage in this process is meter showing high risk level vector icon. This is a completely editable PowerPoint presentation and is available for immediate download. Download now and impress your audience.
Meter Performance Dashboard Vector Icon Ppt PowerPoint Presentation Gallery Backgrounds PDF
Presenting this set of slides with name meter performance dashboard vector icon ppt powerpoint presentation gallery backgrounds pdf. This is a three stage process. The stages in this process are meter performance dashboard vector icon. This is a completely editable PowerPoint presentation and is available for immediate download. Download now and impress your audience.

Business Deal Performance Meter Vector Icon Ppt PowerPoint Presentation Infographic Template Graphic Images PDF
Presenting business deal performance meter vector icon ppt powerpoint presentation infographic template graphic images pdf to dispense important information. This template comprises three stages. It also presents valuable insights into the topics including business deal performance meter vector icon. This is a completely customizable PowerPoint theme that can be put to use immediately. So, download it and address the topic impactfully.

Business Vendors Trust Meter Vector Icon Ppt PowerPoint Presentation Layouts Example PDF
Presenting business vendors trust meter vector icon ppt powerpoint presentation layouts example pdf to dispense important information. This template comprises three stages. It also presents valuable insights into the topics including business vendors trust meter vector icon. This is a completely customizable PowerPoint theme that can be put to use immediately. So, download it and address the topic impactfully.
Like Symbol With Meter Vector Icon Ppt PowerPoint Presentation Infographics Rules PDF
Presenting like symbol with meter vector icon ppt powerpoint presentation infographics rules pdf to dispense important information. This template comprises one stages. It also presents valuable insights into the topics including like symbol with meter vector icon. This is a completely customizable PowerPoint theme that can be put to use immediately. So, download it and address the topic impactfully.
Production Department Efficiency Overview Meter Icon Ppt PowerPoint Presentation Ideas PDF
Presenting production department efficiency overview meter icon ppt powerpoint presentation ideas pdf to dispense important information. This template comprises three stages. It also presents valuable insights into the topics including production department efficiency overview meter icon. This is a completely customizable PowerPoint theme that can be put to use immediately. So, download it and address the topic impactfully.
Water Meter With Arrow Vector Icon Ppt PowerPoint Presentation Summary PDF
Presenting water meter with arrow vector icon ppt powerpoint presentation summary pdf to dispense important information. This template comprises three stages. It also presents valuable insights into the topics including water meter with arrow vector icon. This is a completely customizable PowerPoint theme that can be put to use immediately. So, download it and address the topic impactfully.
Measurement Of Blood Glucose Levels With Hemoglobin Meter Ppt PowerPoint Presentation Icon Layouts PDF
Pitch your topic with ease and precision using this measurement of blood glucose levels with hemoglobin meter ppt powerpoint presentation icon layouts pdf. This layout presents information on measurement of blood glucose levels with hemoglobin meter. It is also available for immediate download and adjustment. So, changes can be made in the color, design, graphics or any other component to create a unique layout.

Circular Meter For Progress Status Vector Icon Ppt Inspiration Template PDF
Presenting circular meter for progress status vector icon ppt inspiration template pdf to dispense important information. This template comprises three stages. It also presents valuable insights into the topics including circular meter for progress status vector icon. This is a completely customizable PowerPoint theme that can be put to use immediately. So, download it and address the topic impactfully.
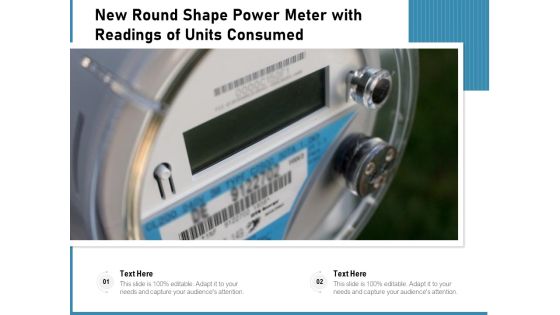
New Round Shape Power Meter With Readings Of Units Consumed Ppt PowerPoint Presentation File Show PDF
Showcasing this set of slides titled new round shape power meter with readings of units consumed ppt powerpoint presentation file show pdf. The topics addressed in these templates are new round shape power meter with readings of units consumed. All the content presented in this PPT design is completely editable. Download it and make adjustments in color, background, font etc. as per your unique business setting.

Smart Grid Technology Iot Based Electricity Energy Meter Reading Background PDF
This slide represents the introduction to smart grid technology that involves two infrastructures, such as electrical and communication infrastructure. It also includes the primary components of the system covering intelligent appliances, smart power meters, smart substations and so on. This modern and well arranged Smart Grid Technology Iot Based Electricity Energy Meter Reading Background PDF provides lots of creative possibilities. It is very simple to customize and edit with the Powerpoint Software. Just drag and drop your pictures into the shapes. All facets of this template can be edited with Powerpoint no extra software is necessary. Add your own material, put your images in the places assigned for them, adjust the colors, and then you can show your slides to the world, with an animated slide included.

Company Website Trust Meter Vector Icon Ppt PowerPoint Presentation Infographics Example PDF
Persuade your audience using this company website trust meter vector icon ppt powerpoint presentation infographics example pdf. This PPT design covers two stages, thus making it a great tool to use. It also caters to a variety of topics including company website trust meter vector icon. Download this PPT design now to present a convincing pitch that not only emphasizes the topic but also showcases your presentation skills.
Employee Trust Meter Vector Icon Ppt PowerPoint Presentation Infographics Good PDF
Persuade your audience using this employee trust meter vector icon ppt powerpoint presentation infographics good pdf. This PPT design covers three stages, thus making it a great tool to use. It also caters to a variety of topics including employee trust meter vector icon. Download this PPT design now to present a convincing pitch that not only emphasizes the topic but also showcases your presentation skills.
Security Shield And Meter Vector Icon Ppt PowerPoint Presentation Styles Summary PDF
Persuade your audience using this security shield and meter vector icon ppt powerpoint presentation styles summary pdf. This PPT design covers three stages, thus making it a great tool to use. It also caters to a variety of topics including security shield and meter vector icon. Download this PPT design now to present a convincing pitch that not only emphasizes the topic but also showcases your presentation skills.
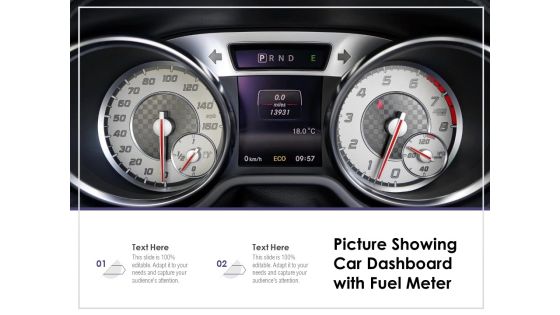
Picture Showing Car Dashboard With Fuel Meter Ppt PowerPoint Presentation Summary Grid PDF
Persuade your audience using this picture showing car dashboard with fuel meter ppt powerpoint presentation summary grid pdf. This PPT design covers two stages, thus making it a great tool to use. It also caters to a variety of topics including picture showing car dashboard with fuel meter. Download this PPT design now to present a convincing pitch that not only emphasizes the topic but also showcases your presentation skills.

IT And Cloud Facilities Management Infrastructure KPI Metrics Showing Square Meter Area Designs PDF
Presenting it and cloud facilities management infrastructure kpi metrics showing square meter area designs pdf to provide visual cues and insights. Share and navigate important information on three stages that need your due attention. This template can be used to pitch topics like square meter, price actual, construction time, activities starting time. In addition, this PPT design contains high-resolution images, graphics, etc, that are easily editable and available for immediate download.
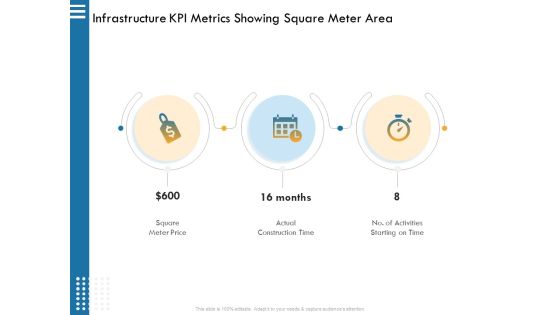
IT Infrastructure Governance Infrastructure KPI Metrics Showing Square Meter Area Ppt Infographics Guide PDF
Presenting it infrastructure governance infrastructure kpi metrics showing square meter area ppt infographics guide pdf. to provide visual cues and insights. Share and navigate important information on three stages that need your due attention. This template can be used to pitch topics like square meter price actual, construction time, no. activities starting time. In addtion, this PPT design contains high resolution images, graphics, etc, that are easily editable and available for immediate download.

Framework Administration Infrastructure KPI Metrics Showing Square Meter Area Elements PDF
Presenting framework administration infrastructure kpi metrics showing square meter area elements pdf to provide visual cues and insights. Share and navigate important information on three stages that need your due attention. This template can be used to pitch topics like square meter price, actual construction time, no. of activities starting on time. In addition, this PPT design contains high-resolution images, graphics, etc, that are easily editable and available for immediate download.

Substructure Segment Analysis Infrastructure KPI Metrics Showing Square Meter Area Diagrams PDF
This is a substructure segment analysis infrastructure kpi metrics showing square meter area diagrams pdf template with various stages. Focus and dispense information on three stages using this creative set, that comes with editable features. It contains large content boxes to add your information on topics like square meter price, actual construction time, activities starting on time. You can also showcase facts, figures, and other relevant content using this PPT layout. Grab it now.

Facility Management Infrastructure KPI Metrics Showing Square Meter Area Ppt Inspiration Example PDF
Presenting facility management infrastructure kpi metrics showing square meter area ppt inspiration example pdf to provide visual cues and insights. Share and navigate important information on three stages that need your due attention. This template can be used to pitch topics like square meter price, actual construction time, no of activities starting on time. In addtion, this PPT design contains high resolution images, graphics, etc, that are easily editable and available for immediate download.
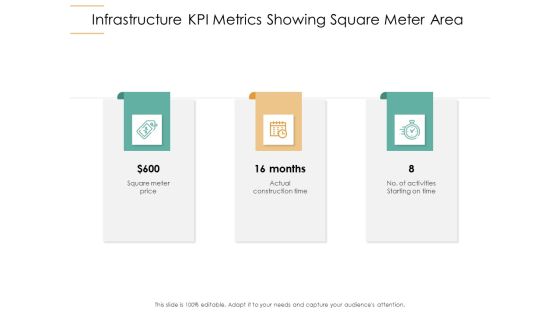
Infrastructure Strategies Infrastructure KPI Metrics Showing Square Meter Area Ppt Outline Graphics Pictures PDF
Presenting infrastructure strategies infrastructure kpi metrics showing square meter area ppt outline graphics pictures pdf to provide visual cues and insights. Share and navigate important information on three stages that need your due attention. This template can be used to pitch topics like square meter price, actual construction time, no of activities starting on time. In addtion, this PPT design contains high resolution images, graphics, etc, that are easily editable and available for immediate download.
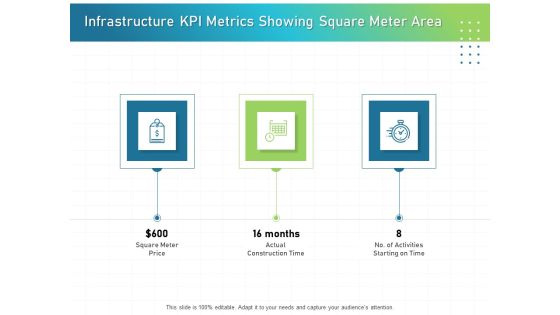
IT Infrastructure Administration Infrastructure KPI Metrics Showing Square Meter Area Guidelines PDF
Presenting it infrastructure administration infrastructure kpi metrics showing square meter area guidelines pdf to provide visual cues and insights. Share and navigate important information on three stages that need your due attention. This template can be used to pitch topics like square meter price, actual construction time, no of activities starting on time. In addtion, this PPT design contains high resolution images, graphics, etc, that are easily editable and available for immediate download.

Infrastructure Project Management In Construction Infrastructure KPI Metrics Showing Square Meter Area Portrait PDF
Presenting infrastructure project management in construction infrastructure kpi metrics showing square meter area portrait pdf. to provide visual cues and insights. Share and navigate important information on three stages that need your due attention. This template can be used to pitch topics like Square Meter Price, Actual Construction Time. In addtion, this PPT design contains high resolution images, graphics, etc, that are easily editable and available for immediate download.

Information Technology Functions Management Infrastructure KPI Metrics Showing Square Meter Area Summary PDF
Presenting information technology functions management infrastructure kpi metrics showing square meter area summary pdf to provide visual cues and insights. Share and navigate important information on three stages that need your due attention. This template can be used to pitch topics like square meter price, actual construction time, no activities starting time. In addition, this PPT design contains high-resolution images, graphics, etc, that are easily editable and available for immediate download.
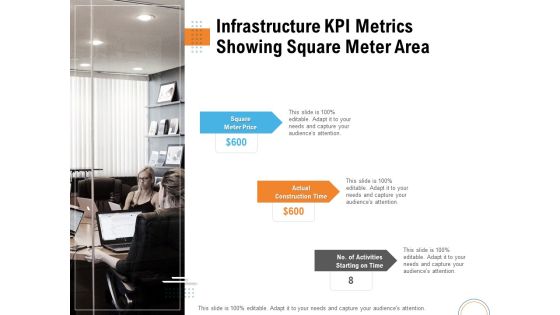
Utilizing Infrastructure Management Using Latest Methods Infrastructure KPI Metrics Showing Square Meter Area Summary PDF
Presenting utilizing infrastructure management using latest methods infrastructure kpi metrics showing square meter area summary pdf to provide visual cues and insights. Share and navigate important information on three stages that need your due attention. This template can be used to pitch topics like square meter price, actual construction time, no activities starting time. In addition, this PPT design contains high-resolution images, graphics, etc, that are easily editable and available for immediate download.

Civil Infrastructure Designing Services Management Infrastructure Kpi Metrics Showing Square Meter Area Slides PDF
Presenting civil infrastructure designing services management infrastructure kpi metrics showing square meter area slides pdf to provide visual cues and insights. Share and navigate important information on three stages that need your due attention. This template can be used to pitch topics like infrastructure kpi metrics showing square meter area. In addtion, this PPT design contains high resolution images, graphics, etc, that are easily editable and available for immediate download.

Business Activities Assessment Examples Infrastructure KPI Metrics Showing Square Meter Area Elements PDF
Presenting business activities assessment examples infrastructure kpi metrics showing square meter area elements pdf to provide visual cues and insights. Share and navigate important information on three stages that need your due attention. This template can be used to pitch topics like square meter price, actual construction time, activities starting on time. In addtion, this PPT design contains high resolution images, graphics, etc, that are easily editable and available for immediate download.
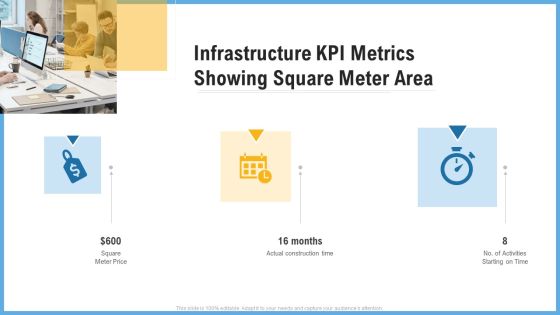
Improving Operational Activities Enterprise Infrastructure Kpi Metrics Showing Square Meter Area Portrait PDF
This is a improving operational activities enterprise infrastructure kpi metrics showing square meter area portrait pdf template with various stages. Focus and dispense information on three stages using this creative set, that comes with editable features. It contains large content boxes to add your information on topics like infrastructure kpi metrics showing square meter area. You can also showcase facts, figures, and other relevant content using this PPT layout. Grab it now.

Construction Management Services And Action Plan Infrastructure KPI Metrics Showing Square Meter Area Information PDF
Presenting construction management services and action plan infrastructure kpi metrics showing square meter area information pdf to provide visual cues and insights. Share and navigate important information on three stages that need your due attention. This template can be used to pitch topics like infrastructure kpi metrics showing square meter area. In addtion, this PPT design contains high resolution images, graphics, etc, that are easily editable and available for immediate download.

Construction Engineering And Industrial Facility Management Infrastructure KPI Metrics Showing Square Meter Area Ideas PDF
Presenting construction engineering and industrial facility management infrastructure kpi metrics showing square meter area ideas pdf to provide visual cues and insights. Share and navigate important information on three stages that need your due attention. This template can be used to pitch topics like square meter price, actual construction time, no of activities starting on time . In addtion, this PPT design contains high resolution images, graphics, etc, that are easily editable and available for immediate download.
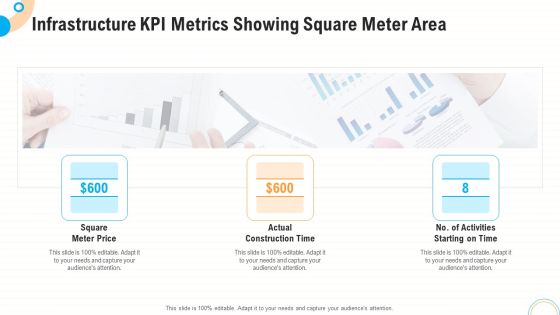
Fiscal And Operational Assessment Infrastructure KPI Metrics Showing Square Meter Area Guidelines PDF
Presenting fiscal and operational assessment infrastructure kpi metrics showing square meter area guidelines pdf to provide visual cues and insights. Share and navigate important information on three stages that need your due attention. This template can be used to pitch topics like square meter price, actual construction time, activities starting. In addtion, this PPT design contains high resolution images, graphics, etc, that are easily editable and available for immediate download.
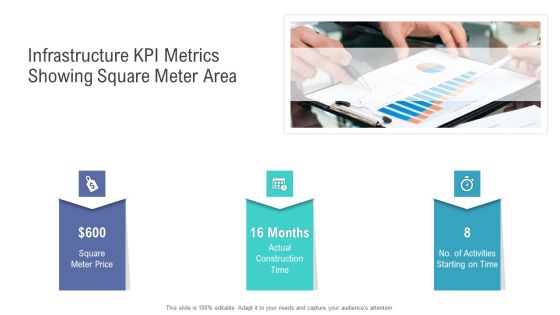
Financial Functional Assessment Infrastructure KPI Metrics Showing Square Meter Area Summary PDF
Presenting financial functional assessment infrastructure kpi metrics showing square meter area summary pdf to provide visual cues and insights. Share and navigate important information on three stages that need your due attention. This template can be used to pitch topics like square meter price, actual construction time, activities. In addition, this PPT design contains high-resolution images, graphics, etc, that are easily editable and available for immediate download.
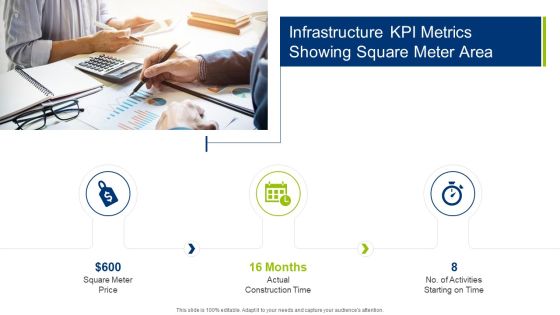
Infrastructure Building Administration Infrastructure KPI Metrics Showing Square Meter Area Portrait PDF
This is a infrastructure building administration infrastructure kpi metrics showing square meter area portrait pdf template with various stages. Focus and dispense information on three stages using this creative set, that comes with editable features. It contains large content boxes to add your information on topics like square meter price actual, construction time, activities starting on time. You can also showcase facts, figures, and other relevant content using this PPT layout. Grab it now.

Construction Management Services Infrastructure KPI Metrics Showing Square Meter Area Designs PDF
Presenting construction management services infrastructure kpi metrics showing square meter area designs pdf to provide visual cues and insights. Share and navigate important information on three stages that need your due attention. This template can be used to pitch topics like square meter price, actual construction time, activities. In addition, this PPT design contains high-resolution images, graphics, etc, that are easily editable and available for immediate download.
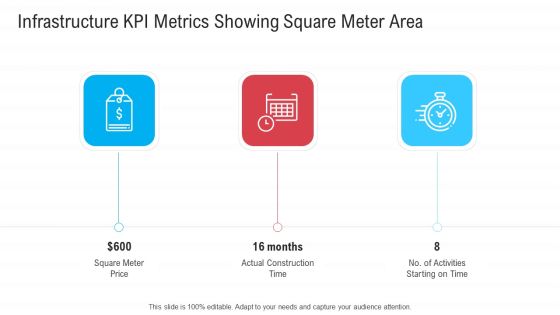
Infrastructure Designing And Administration Infrastructure KPI Metrics Showing Square Meter Area Guidelines PDF
Presenting infrastructure designing and administration infrastructure kpi metrics showing square meter area guidelines pdf to provide visual cues and insights. Share and navigate important information on three stages that need your due attention. This template can be used to pitch topics like square meter price, actual construction time, no of activities starting on time. In addtion, this PPT design contains high resolution images, graphics, etc, that are easily editable and available for immediate download.
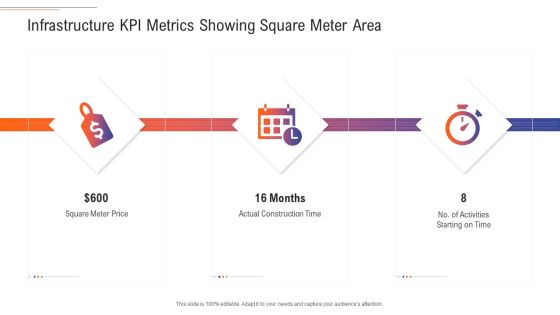
Support Services Management Infrastructure KPI Metrics Showing Square Meter Area Ideas PDF
Presenting support services management infrastructure kpi metrics showing square meter area ideas pdf to provide visual cues and insights. Share and navigate important information on three stages that need your due attention. This template can be used to pitch topics like square meter price, actual construction time, no of activities starting on time. In addtion, this PPT design contains high resolution images, graphics, etc, that are easily editable and available for immediate download.
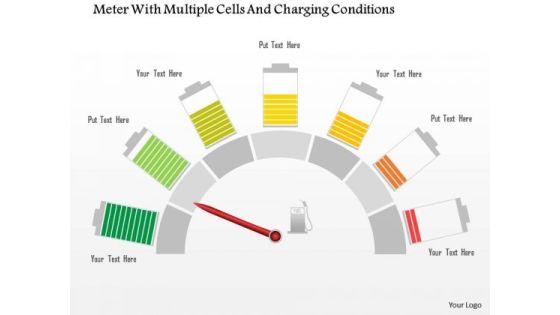
Business Diagram Meter With Multiple Cells And Charging Conditions Presentation Template
This Power Point template slide has been designed with graphic of meter and multiple cells. This PPT slide contains the concept of power consumption and charging. Use this PPT in your presentation and build an innovative presentation for power related topics.
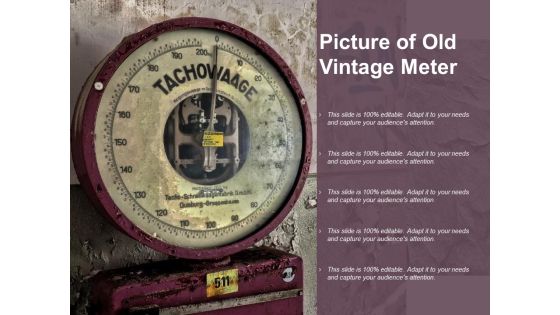
Picture Of Old Vintage Meter Ppt PowerPoint Presentation Infographic Template Sample
Presenting this set of slides with name picture of old vintage meter ppt powerpoint presentation infographic template sample. This is a one stage process. The stages in this process are weighing scale, measure, weighing machine. This is a completely editable PowerPoint presentation and is available for immediate download. Download now and impress your audience.

Customer Satisfaction Score Meter With Three Levels Ppt PowerPoint Presentation Gallery Smartart PDF
Presenting customer satisfaction score meter with three levels ppt powerpoint presentation gallery smartart pdf to dispense important information. This template comprises three stages. It also presents valuable insights into the topics including unsatisfied, neutral, satisfaction. This is a completely customizable PowerPoint theme that can be put to use immediately. So, download it and address the topic impactfully.

Meter Showing Business Risk Levels Ppt PowerPoint Presentation Show Slide PDF
Persuade your audience using this meter showing business risk levels ppt powerpoint presentation show slide pdf. This PPT design covers three stages, thus making it a great tool to use. It also caters to a variety of topics including low, medium, high. Download this PPT design now to present a convincing pitch that not only emphasizes the topic but also showcases your presentation skills.
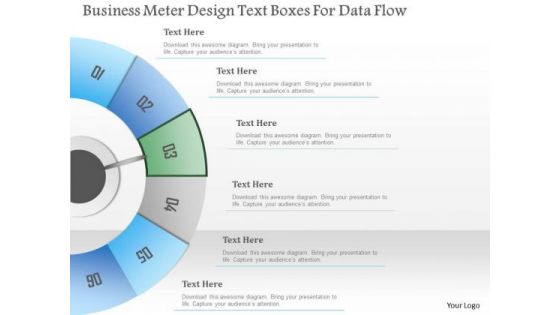
Busines Diagram Business Meter Design Text Boxes For Data Flow Presentation Template
Concept of data flow can be well defined with this exclusive business diagram. This slide contains the diagram of six steps in semi-circle. Use this professional diagram to impress your viewers.
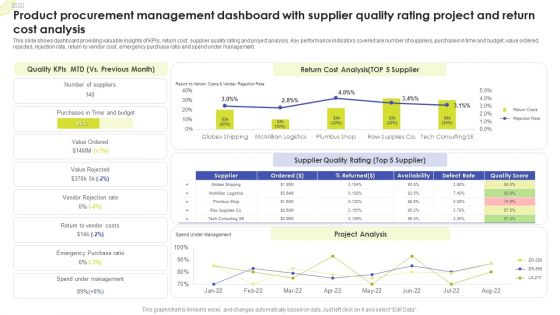
Product Procurement Management Dashboard With Supplier Quality Rating Project And Return Cost Analysis Sample PDF
This slide shows dashboard providing valuable insights of KPIs, return cost, supplier quality rating and project analysis. Key performance indicators covered are number of suppliers, purchases in time and budget, value ordered, rejected, rejection rate, return to vendor cost, emergency purchase ratio and spend under management. Pitch your topic with ease and precision using this Product Procurement Management Dashboard With Supplier Quality Rating Project And Return Cost Analysis Sample PDF. This layout presents information on Quality KPIs, Return Cost Analysis, Supplier Quality Rating. It is also available for immediate download and adjustment. So, changes can be made in the color, design, graphics or any other component to create a unique layout.

Customer NPS Metric Image Indicating Customer Giving Experience Rating On Device Icons PDF
Presenting Customer NPS Metric Image Indicating Customer Giving Experience Rating On Device Icons PDF to dispense important information. This template comprises five stages. It also presents valuable insights into the topics including Customers Retention, Enhance Customer Experience, Business Assessment. This is a completely customizable PowerPoint theme that can be put to use immediately. So, download it and address the topic impactfully.

Smart Metering Management Diagram Good Ppt Example
This is a smart metering management diagram good ppt example. This is a eight stage process. The stages in this process are reporting, customer information system, billing system, asset management, network information system, security manager, dc persistency, monitoring and control, meter data management.
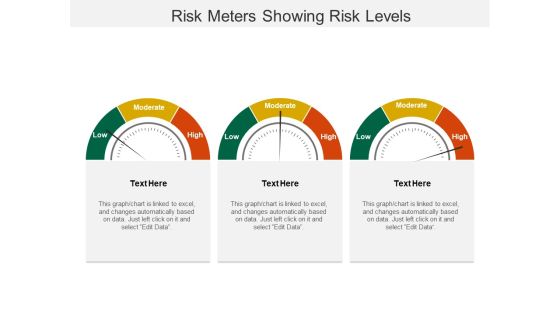
Risk Meters Showing Risk Levels Ppt PowerPoint Presentation Summary Example
This is a risk meters showing risk levels ppt powerpoint presentation summary example. This is a three stage process. The stages in this process are risk meter, risk speedometer, hazard meter.
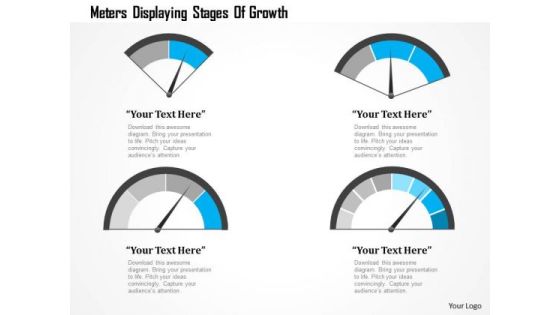
Business Diagram Meters Displaying Stages Of Growth Presentation Template
Graphic of four different meters has been used to craft this power point template. This PPT contains the concept of speed calculation. Use this PPT for your technology and mechanical topics in any presentations.
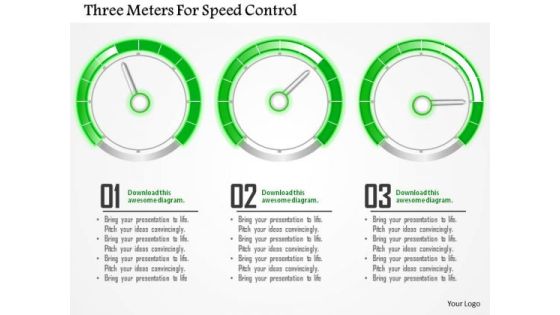
Business Diagram Three Meters For Speed Control Presentation Template
Graphic of three speedometers has been used to design this power point template. This diagram contains the concept of speed control. Amplify your thoughts via this appropriate business template.
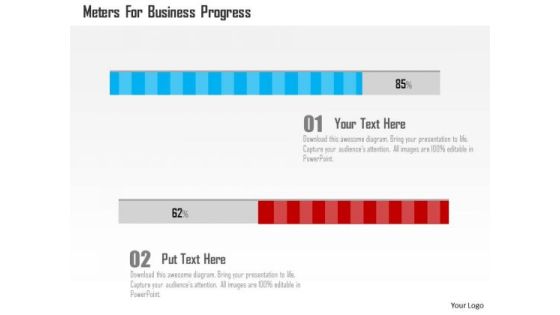
Business Diagram Meters For Business Progress Presentation Template
This business slide contains graphics of meter. You may use this slide to depict business progress. Download our above diagram to express information in a visual way.
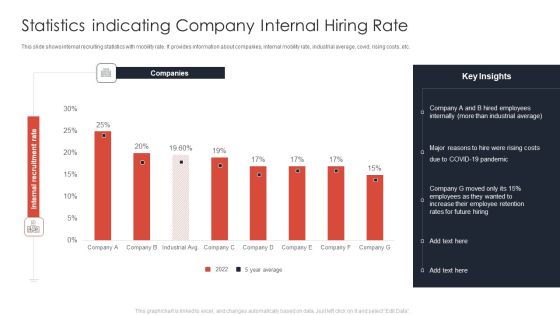
Statistics Indicating Company Internal Hiring Rate Ppt Ideas Templates PDF
This slide shows internal recruiting statistics with mobility rate. It provides information about companies, internal mobility rate, industrial average, covid, rising costs, etc. Showcasing this set of slides titled Statistics Indicating Company Internal Hiring Rate Ppt Ideas Templates PDF. The topics addressed in these templates are Companies, Employees Internally, COVID 19 Pandemic. All the content presented in this PPT design is completely editable. Download it and make adjustments in color, background, font etc. as per your unique business setting.

Small Company And Entrepreneurs Failture Rate Summary PDF
This slide exhibits yearly statistics indicating fail rates of business commenced after 2018. It contains percentage of business fail, yearly comparison rate of failure and average annual rate of business failure. Pitch your topic with ease and precision using this Small Company And Entrepreneurs Failture Rate Summary PDF. This layout presents information on Entrepreneurs Failture Rate, Business. It is also available for immediate download and adjustment. So, changes can be made in the color, design, graphics or any other component to create a unique layout.

Calculate Facebook Key Performance Indicator The Engagement Rate Background PDF
Persuade your audience using this calculate facebook key performance indicator the engagement rate background pdf. This PPT design covers four stages, thus making it a great tool to use. It also caters to a variety of topics including calculate facebook key performance indicator the engagement rate. Download this PPT design now to present a convincing pitch that not only emphasizes the topic but also showcases your presentation skills.
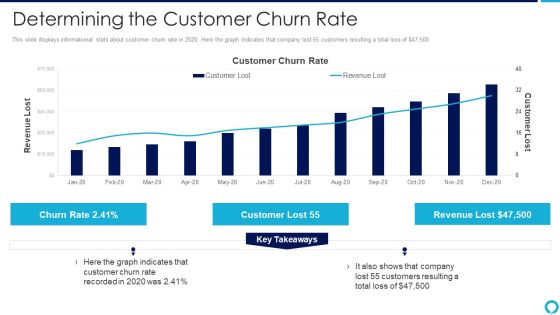
Partnership Management Strategies Determining The Customer Churn Rate Guidelines PDF
This slide displays informational stats about customer churn rate in 2020. Here the graph indicates that company lost 55 customers resulting a total loss of dollar47,500 Deliver and pitch your topic in the best possible manner with this partnership management strategies determining the customer churn rate guidelines pdf Use them to share invaluable insights on determining the customer churn rate and impress your audience. This template can be altered and modified as per your expectations. So, grab it now.
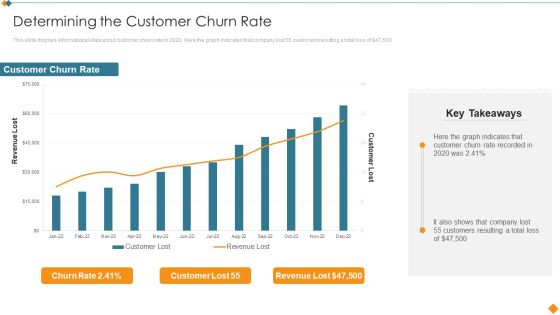
Maintaining Partner Relationships Determining The Customer Churn Rate Portrait PDF
This slide displays informational stats about customer churn rate in 2020. Here the graph indicates that company lost 55 customers resulting a total loss of dollar 47,500. Deliver and pitch your topic in the best possible manner with this Maintaining Partner Relationships Determining The Customer Churn Rate Portrait PDF. Use them to share invaluable insights on Customer Churn Rate, Revenue Lost and impress your audience. This template can be altered and modified as per your expectations. So, grab it now.
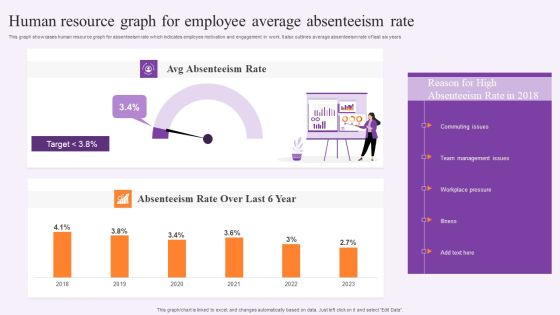
Human Resource Graph For Employee Average Absenteeism Rate Information PDF
This graph showcases human resource graph for absenteeism rate which indicates employee motivation and engagement in work. It also outlines average absenteeism rate of last six years. Showcasing this set of slides titled Human Resource Graph For Employee Average Absenteeism Rate Information PDF. The topics addressed in these templates are Team Management Issues, Workplace Pressure, Absenteeism Rate. All the content presented in this PPT design is completely editable. Download it and make adjustments in color, background, font etc. as per your unique business setting.
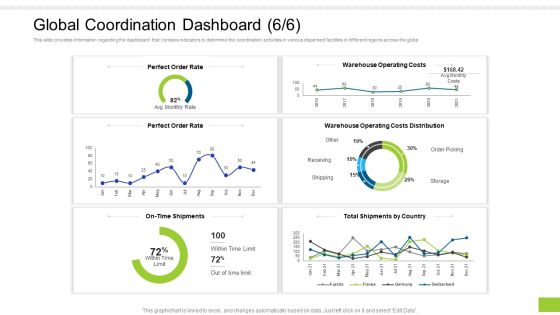
Enterprise Collaboration Global Scale Global Coordination Dashboard Rate Professional PDF
This slide provides information regarding the dashboard that contains indicators to determine the coordination activities in various dispersed facilities in different regions across the globe. Deliver and pitch your topic in the best possible manner with this enterprise collaboration global scale global coordination dashboard rate professional pdf. Use them to share invaluable insights on perfect order rate, warehouse operating costs, operating costs distribution and impress your audience. This template can be altered and modified as per your expectations. So, grab it now.
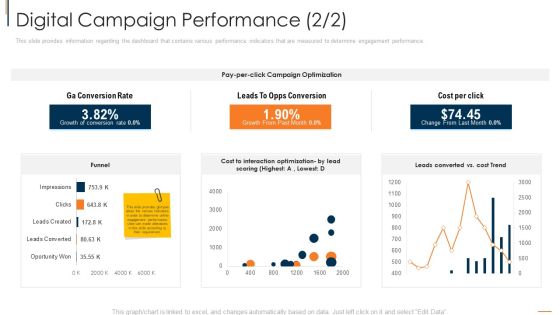
Online Consumer Engagement Digital Campaign Performance Rate Guidelines PDF
This slide provides information regarding the dashboard that contains various performance indicators that are measured to determine engagement performance. Deliver and pitch your topic in the best possible manner with this online consumer engagement digital campaign performance rate guidelines pdf. Use them to share invaluable insights on optimization, cost, rate and impress your audience. This template can be altered and modified as per your expectations. So, grab it now.

Customer Metrics Dashboard For Retention Management Rate Information PDF
This slide represents dashboard exhibiting customer retention management key performance indicators. It covers NPS, loyal customer rate, customer churn, revenue churn etc. Showcasing this set of slides titled customer metrics dashboard for retention management rate information pdf. The topics addressed in these templates are customer, premium users. All the content presented in this PPT design is completely editable. Download it and make adjustments in color, background, font etc. as per your unique business setting.

Customer Conversion Rate From Social Media Platforms Topics PDF
The following slide outlines customer conversion rate derived from different social media channels. The key channels highlighted in the slide are Facebook, Instagram, YouTube, Twitter and Snapchat. Deliver an awe inspiring pitch with this creative Customer Conversion Rate From Social Media Platforms Topics PDF bundle. Topics like Customer Conversion, Indicates Customers, Lowest Customer can be discussed with this completely editable template. It is available for immediate download depending on the needs and requirements of the user.

KPI Metrics Dashboard Highlighting Employee Retention Rate Structure PDF
The purpose of this slide is to exhibit a key performance indicator KPI dashboard through which managers can analyze the monthly employee retention rate. The metrics covered in the slide are active employees, new candidates hired, internal, exit, employee turnover rate, etc. Do you have to make sure that everyone on your team knows about any specific topic I yes, then you should give KPI Metrics Dashboard Highlighting Employee Retention Rate Structure PDF a try. Our experts have put a lot of knowledge and effort into creating this impeccable KPI Metrics Dashboard Highlighting Employee Retention Rate Structure PDF. You can use this template for your upcoming presentations, as the slides are perfect to represent even the tiniest detail. You can download these templates from the Slidegeeks website and these are easy to edit. So grab these today.

Corresponding Plans To Decrease Employee Turnover Rate Ideas PDF
This slide represents the parallel plans for increasing employees retention rate and their job satisfaction levels. It includes two plans such as training and development programs and work life balance. Persuade your audience using this Corresponding Plans To Decrease Employee Turnover Rate Ideas PDF. This PPT design covers two stages, thus making it a great tool to use. It also caters to a variety of topics including Development Programs, Encourage Employees, Performance Indicator. Download this PPT design now to present a convincing pitch that not only emphasizes the topic but also showcases your presentation skills.

Marketing Analytics Measurement Procedure With Success Rate Guidelines PDF
This slide showcases performance indicators of marketing required by organizations to analyze data to reach a end goals. Key metrics included are attributing social and content to revenue, aligning business goal and marketing, conversion of leads to revenue and data collection and analysis. Showcasing this set of slides titled Marketing Analytics Measurement Procedure With Success Rate Guidelines PDF. The topics addressed in these templates areMarketing Analytics Measurement, Procedure With Success Rate. All the content presented in this PPT design is completely editable. Download it and make adjustments in color, background, font etc. as per your unique business setting.

Employee Job Progression Matrix With Progression Rate Infographics PDF
This slide presents employee career matrix that helps to identify competencies and transformation over years, indicating professional development. It includes position, key tasks, skills, levels and progression rate that defines employee potential as beginner, advance and expert. Showcasing this set of slides titled Employee Job Progression Matrix With Progression Rate Infographics PDF. The topics addressed in these templates are Position, Skill, Level. All the content presented in this PPT design is completely editable. Download it and make adjustments in color, background, font etc. as per your unique business setting.
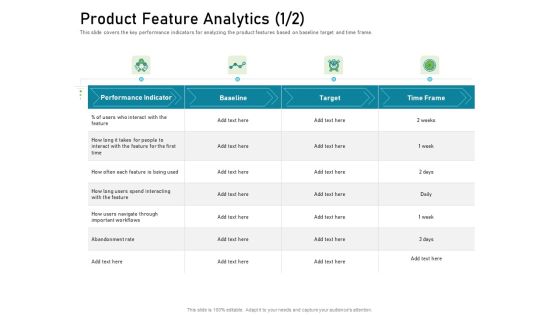
Requirements Governance Plan Product Feature Analytics Rate Microsoft PDF
This slide covers the key performance indicators for analyzing the product features based on baseline target and time frame. Deliver an awe-inspiring pitch with this creative requirements governance plan product feature analytics rate microsoft pdf bundle. Topics like performance indicator, target, time frame can be discussed with this completely editable template. It is available for immediate download depending on the needs and requirements of the user.
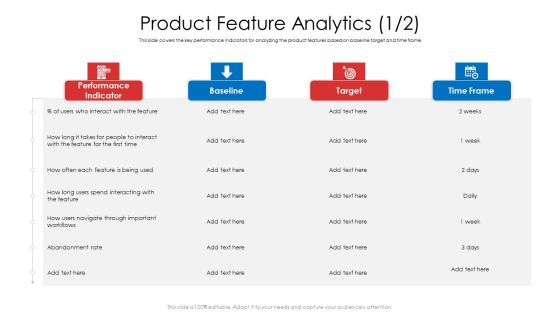
Product Demand Document Product Feature Analytics Rate Formats PDF
This slide covers the key performance indicators for analyzing the product features based on baseline target and time frame. Deliver an awe-inspiring pitch with this creative product demand document product feature analytics rate formats pdf bundle. Topics like performance indicator, baseline, target, time frame can be discussed with this completely editable template. It is available for immediate download depending on the needs and requirements of the user.
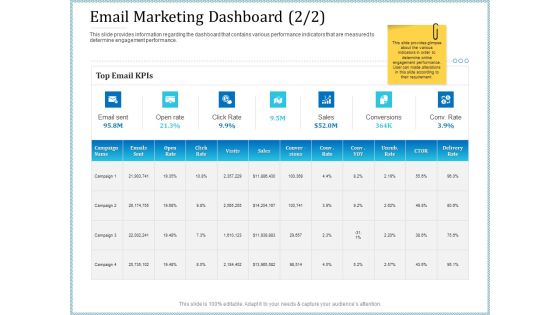
Leveraged Client Engagement Email Marketing Dashboard Rate Rules PDF
This slide provides information regarding the dashboard that contains various performance indicators that are measured to determine engagement performance. Deliver and pitch your topic in the best possible manner with this leveraged client engagement email marketing dashboard rate rules pdf. Use them to share invaluable insights on campaign, sales, conversions and impress your audience. This template can be altered and modified as per your expectations. So, grab it now.
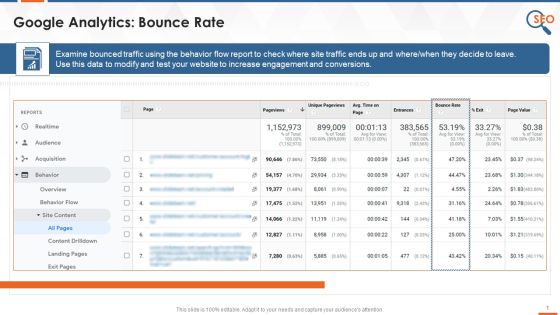
Google Analytics SEO Tool To Monitor Bounce Rate Training Ppt
This slide indicates how the Google Analytics tool is used in SEO to examine the bounced traffic to increase engagement and conversions.
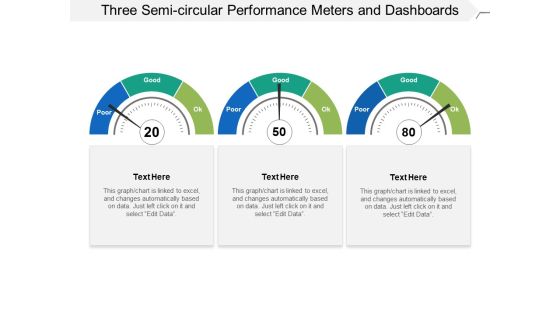
Three Semi Circular Performance Meters And Dashboards Ppt PowerPoint Presentation Slides Influencers
This is a three semi circular performance meters and dashboards ppt powerpoint presentation slides influencers. This is a three stage process. The stages in this process are fuel gauge, gas gauge, fuel containers.
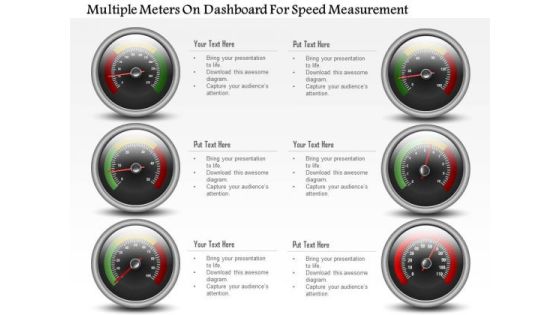
Business Diagram Multiple Meters On Dashboard For Speed Measurement PowerPoint Slide
This business diagram has been designed with multiple meters on dashboard. This slide can be used for business planning and progress. Use this diagram for your business and success milestones related presentations.

Basketball Teams Playing With Each Other At Tournament Ppt PowerPoint Presentation Visual Aids Ideas PDF
Presenting this set of slides with name customer satisfaction rating meter feedback rating scale sale services excellent ppt powerpoint presentation complete deck. The topics discussed in these slide is basketball teams playing with each other at tournament. This is a completely editable PowerPoint presentation and is available for immediate download. Download now and impress your audience.

Employee Risk Key Performance Indicator Dashboard With Case Incident Rate Ppt Professional Information PDF
The following slide highlights the employee safety key performance indicator dashboard with case incident rate illustrating total case occurrence rate, last reported case, days without reported, causing items, corrective actions, incident pyramid, incident by month and major causes. Pitch your topic with ease and precision using this Employee Risk Key Performance Indicator Dashboard With Case Incident Rate Ppt Professional Information PDF. This layout presents information on Total Case, Incident Rate, Last Incident Reported, Incident Causing Items. It is also available for immediate download and adjustment. So, changes can be made in the color, design, graphics or any other component to create a unique layout.
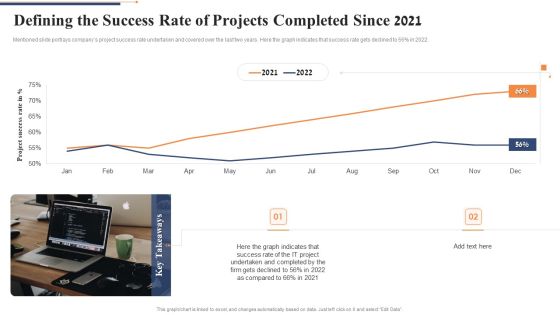
Defining The Success Rate Of Projects Completed Since 2021 Pictures PDF
Mentioned slide portrays companys project success rate undertaken and covered over the last two years. Here the graph indicates that success rate gets declined to 56percentsge in 2022. Deliver an awe inspiring pitch with this creative defining the success rate of projects completed since 2021 pictures pdf bundle. Topics like project success rate can be discussed with this completely editable template. It is available for immediate download depending on the needs and requirements of the user.
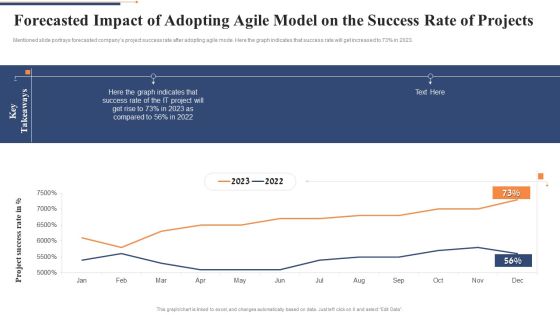
Forecasted Impact Of Adopting Agile Model On The Success Rate Of Projects Inspiration PDF
Mentioned slide portrays forecasted companys project success rate after adopting agile mode. Here the graph indicates that success rate will get increased to 73percentage in 2023. Deliver an awe inspiring pitch with this creative forecasted impact of adopting agile model on the success rate of projects inspiration pdf bundle. Topics like project success rate can be discussed with this completely editable template. It is available for immediate download depending on the needs and requirements of the user.

Manufacturing Operation Quality Improvement Practices Tools Templates Production Rate Key Performance Portrait PDF
The following slide displays the Kpis of manufacturing and operations these Kpis can be defect density, rate of production and rate of return etc. Deliver and pitch your topic in the best possible manner with this manufacturing operation quality improvement practices tools templates production rate key performance portrait pdf. Use them to share invaluable insights on production rate key performance indicators and impress your audience. This template can be altered and modified as per your expectations. So, grab it now.

Project QA Through Agile Methodology IT Defining The Success Rate Infographics PDF
Mentioned slide portrays companys project success rate undertaken and covered over the last two years. Here the graph indicates that success rate gets declined to 56percent in 2022.Deliver an awe inspiring pitch with this creative Project QA Through Agile Methodology IT Defining The Success Rate Infographics PDF bundle. Topics like Defining The Success Rate Of Projects Completed Since 2022 can be discussed with this completely editable template. It is available for immediate download depending on the needs and requirements of the user.

Implementing Agile Software Development Methodology For Cost Cutting IT Defining The Success Rate Introduction PDF
Mentioned slide portrays organizations success rate of project undertaken and completed over the last two years. Here the graph indicates that success rate gets declined to 58percent in 2022.Deliver an awe inspiring pitch with this creative Implementing Agile Software Development Methodology For Cost Cutting IT Defining The Success Rate Introduction PDF bundle. Topics like Defining Success, Rate Projects, Undertaken Completed can be discussed with this completely editable template. It is available for immediate download depending on the needs and requirements of the user.
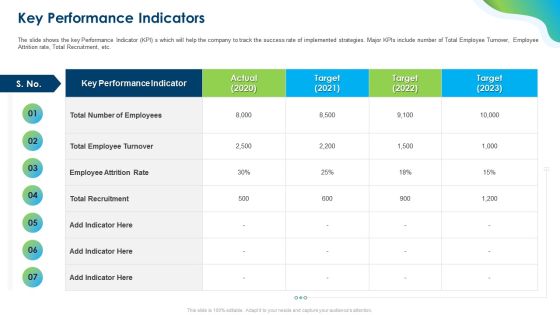
Growing Churn Rate In IT Organization Key Performance Indicators Summary PDF
Deliver an awe-inspiring pitch with this creative growing churn rate in it organization key performance indicators summary pdf bundle. Topics like total number of employees, total employee turnover, employee attrition rate can be discussed with this completely editable template. It is available for immediate download depending on the needs and requirements of the user.
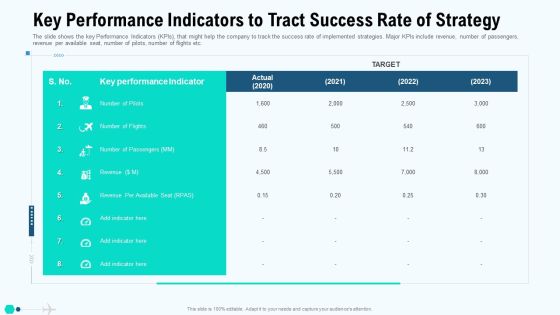
Key Performance Indicators To Tract Success Rate Of Strategy Designs PDF
The slide shows the key Performance Indicators KPIs, that might help the company to track the success rate of implemented strategies. Major KPIs include revenue, number of passengers, revenue per available seat, number of pilots, number of flights etc. Deliver an awe inspiring pitch with this creative key performance indicators to tract success rate of strategy designs pdf bundle. Topics like key performance indicators to tract success rate of strategy can be discussed with this completely editable template. It is available for immediate download depending on the needs and requirements of the user.
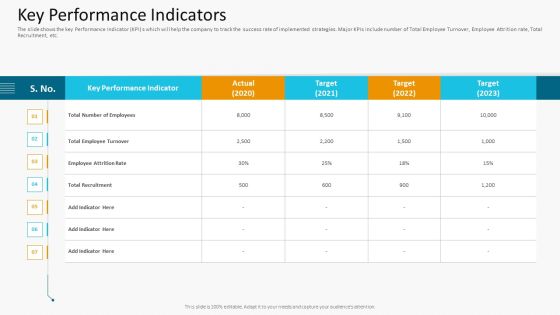
High Employee Attrition Rate In IT Firm Case Competition Key Performance Indicators Sample PDF
The slide shows the key Performance Indicator KPI s which will help the company to track the success rate of implemented strategies. Major KPIs include number of Total Employee Turnover, Employee Attrition rate, Total Recruitment, etc. Deliver an awe inspiring pitch with this creative high employee attrition rate in it firm case competition key performance indicators sample pdf bundle. Topics like key performance indicators can be discussed with this completely editable template. It is available for immediate download depending on the needs and requirements of the user.

Key Performance Indicators To Tract Success Rate Of Strategy Structure PDF
The slide shows the key Performance Indicators KPIs, that might help the company to track the success rate of implemented strategies. Major KPIs include revenue, number of passengers, revenue per available seat, number of pilots, number of flights etc. Deliver an awe inspiring pitch with this creative key performance indicators to tract success rate of strategy structure pdf bundle. Topics like key performance indicators to tract success rate of strategy can be discussed with this completely editable template. It is available for immediate download depending on the needs and requirements of the user.
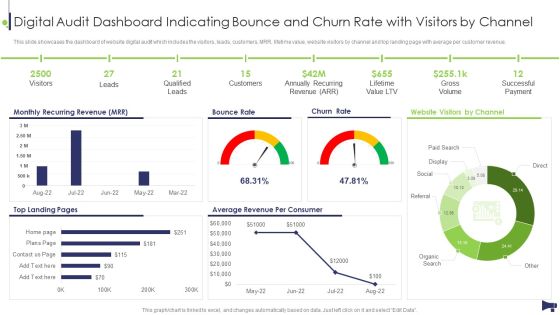
Website And Social Media Digital Audit Dashboard Indicating Bounce And Churn Rate Template PDF
This slide showcases the dashboard of website digital audit which includes the visitors, leads, customers, MRR, lifetime value, website visitors by channel and top landing page with average per customer revenue. Deliver and pitch your topic in the best possible manner with this Website And Social Media Digital Audit Dashboard Indicating Bounce And Churn Rate Template PDF. Use them to share invaluable insights on Monthly Recurring Revenue, Bounce Rate, Churn Rate and impress your audience. This template can be altered and modified as per your expectations. So, grab it now.

Digital Audit Dashboard Indicating Bounce And Churn Rate With Visitors By Channel Information PDF
This slide showcases the dashboard of website digital audit which includes the visitors, leads, customers, MRR, lifetime value, website visitors by channel and top landing page with average per customer revenue. Deliver an awe inspiring pitch with this creative Digital Audit Dashboard Indicating Bounce And Churn Rate With Visitors By Channel Information PDF bundle. Topics like Monthly Recurring Revenue, Bounce Rate, Churn Rate can be discussed with this completely editable template. It is available for immediate download depending on the needs and requirements of the user.

Downturn Graph Indicating Growth Rate In Various Countries Ppt PowerPoint Presentation Layouts Design Templates PDF
Pitch your topic with ease and precision using this downturn graph indicating growth rate in various countries ppt powerpoint presentation layouts design templates pdf. This layout presents information on downturn graph indicating growth rate in various countries. It is also available for immediate download and adjustment. So, changes can be made in the color, design, graphics or any other component to create a unique layout.

Chart Indicating United States Marine Corps Yearly Attrition Rate Ppt PowerPoint Presentation File Background Images PDF
Pitch your topic with ease and precision using this chart indicating united states marine corps yearly attrition rate ppt powerpoint presentation file background images pdf. This layout presents information on hart indicating united states marine corps yearly attrition rate. It is also available for immediate download and adjustment. So, changes can be made in the color, design, graphics or any other component to create a unique layout.
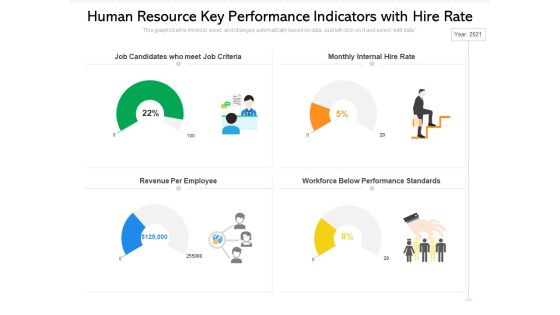
Human Resource Key Performance Indicators With Hire Rate Ppt PowerPoint Presentation Summary Examples PDF
Pitch your topic with ease and precision using this human resource key performance indicators with hire rate ppt powerpoint presentation summary examples pdf. This layout presents information on job candidates who meet job criteria, monthly internal hire rate, revenue per employee. It is also available for immediate download and adjustment. So, changes can be made in the color, design, graphics or any other component to create a unique layout.

Brand Building Techniques Enhance Customer Engagement Loyalty Kpis To Measure The Success Rate Rules PDF
The following slide outlines multiple key performance indicators used by the marketer to evaluate the effectiveness of an online advertisement campaign. The KPIs are likes, comments, shares, clickthrough rate CTR, open rate, bounce rate, article views, audience engagement rate and subscriber growth. Get a simple yet stunning designed Brand Building Techniques Enhance Customer Engagement Loyalty Kpis To Measure The Success Rate Rules PDF. It is the best one to establish the tone in your meetings. It is an excellent way to make your presentations highly effective. So, download this PPT today from Slidegeeks and see the positive impacts. Our easy to edit Brand Building Techniques Enhance Customer Engagement Loyalty Kpis To Measure The Success Rate Rules PDF can be your go to option for all upcoming conferences and meetings. So, what are you waiting for Grab this template today.

Cost Saving With Agile Methodology IT Defining The Success Rate Of Projects Graphics PDF
Mentioned slide portrays organizations success rate of project undertaken and completed over the last two years. Here the graph indicates that success rate gets declined to 58persent in 2020.Deliver an awe inspiring pitch with this creative cost saving with agile methodology it defining the success rate of projects graphics pdf bundle. Topics like defining the success rate of projects undertaken and completed can be discussed with this completely editable template. It is available for immediate download depending on the needs and requirements of the user.
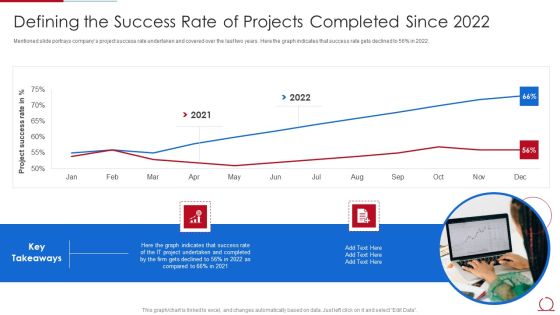
Quality Assurance Model For Agile IT Defining The Success Rate Of Projects Completed Themes PDF
Mentioned slide portrays companys project success rate undertaken and covered over the last two years. Here the graph indicates that success rate gets declined to 56 percent in 2022. Deliver an awe inspiring pitch with this creative quality assurance model for agile it defining the success rate of projects completed themes pdf bundle. Topics like success rate, it project, 2021 to 2022 can be discussed with this completely editable template. It is available for immediate download depending on the needs and requirements of the user.

Why Is Agile Cost Effective IT Defining The Success Rate Of Projects Undertaken Mockup PDF
Mentioned slide portrays organizations success rate of project undertaken and completed over the last two years. Here the graph indicates that success rate gets declined to 58 percent in 2022. Deliver an awe inspiring pitch with this creative Why Is Agile Cost Effective IT Defining The Success Rate Of Projects Undertaken Mockup PDF bundle. Topics like Project Success Rate, IT Projects, 2020 To 2022 can be discussed with this completely editable template. It is available for immediate download depending on the needs and requirements of the user.
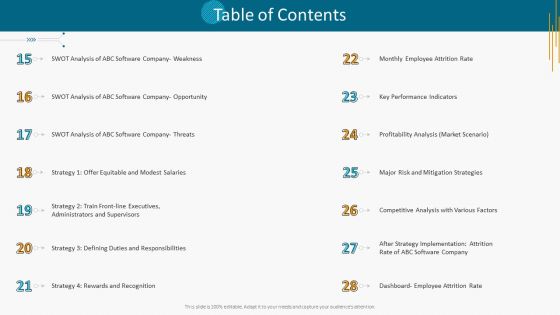
High Employee Attrition Rate In IT Firm Case Competition Table Of Contents Weakness Formats PDF
Deliver an awe inspiring pitch with this creative high employee attrition rate in it firm case competition table of contents weakness formats pdf bundle. Topics like monthly employee attrition rate, key performance indicators, major risk and mitigation strategies can be discussed with this completely editable template. It is available for immediate download depending on the needs and requirements of the user.

Retail Business Optimization Through Operational Excellence Strategy Determining Back Order Rate Slides PDF
Following slide illustrates information stats about back order rate and rate of return in the year 2020. Here the graph indicates that back order rate get exceeded to 4.8 percent from the target value in 2020. Do you have an important presentation coming up Are you looking for something that will make your presentation stand out from the rest Look no further than Retail Business Optimization Through Operational Excellence Strategy Determining Back Order Rate Slides PDF. With our professional designs, you can trust that your presentation will pop and make delivering it a smooth process. And with Slidegeeks, you can trust that your presentation will be unique and memorable. So why wait Grab Retail Business Optimization Through Operational Excellence Strategy Determining Back Order Rate Slides PDF today and make your presentation stand out from the rest.

Retail Business Operation Management To Optimize Customer Experience Determining Back Order Rate Rules PDF
Following slide illustrates information stats about back order rate and rate of return in the year 2023. Here the graph indicates that back order rate get exceeded to 4.8percent from the target value in 2023. Do you have an important presentation coming up Are you looking for something that will make your presentation stand out from the rest Look no further than Retail Business Operation Management To Optimize Customer Experience Determining Back Order Rate Rules PDF. With our professional designs, you can trust that your presentation will pop and make delivering it a smooth process. And with Slidegeeks, you can trust that your presentation will be unique and memorable. So why wait Grab Retail Business Operation Management To Optimize Customer Experience Determining Back Order Rate Rules PDF today and make your presentation stand out from the rest.

Key Performance Indicators To Tract Success Rate Of Strategy Brochure PDF
The slide shows the key Performance Indicators KPIs, that might help the company to track the success rate of implemented strategies. Major KPIs include revenue, number of passengers, revenue per available seat, number of pilots, number of flights etc. Deliver an awe-inspiring pitch with this creative key performance indicators to tract success rate of strategy brochure pdf bundle. Topics like key performance indicator, target can be discussed with this completely editable template. It is available for immediate download depending on the needs and requirements of the user.

Key Performance Indicators To Tract Success Rate Of Strategy Summary PDF
The slide shows the key Performance Indicators KPIs, that might help the company to track the success rate of implemented strategies. Major KPIs include revenue, number of passengers, revenue per available seat, number of pilots, number of flights etc. Deliver and pitch your topic in the best possible manner with this key performance indicators to tract success rate of strategy summary pdf. Use them to share invaluable insights on revenue per available seat, target and impress your audience. This template can be altered and modified as per your expectations. So, grab it now.

Cost Saving With Agile Methodology IT Analyzing Current OTD Rate Of Projects Graphics PDF
Following slide provides information about the on time delivery rate of the projects completed by the organization. Here the stats indicates that OTD rate of projects completed in H1 of 2020 was 75persent.Deliver an awe inspiring pitch with this creative cost saving with agile methodology it analyzing current otd rate of projects graphics pdf bundle. Topics like delivery date promised, actual delivery date, projects undertaken can be discussed with this completely editable template. It is available for immediate download depending on the needs and requirements of the user.
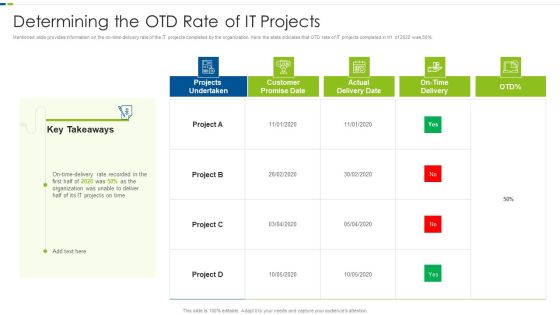
Utilizing Agile Methodology In Data Transformation Project IT Determining The OTD Rate Rules PDF
Mentioned slide provides information on the on time delivery rate of the IT projects completed by the organization. Here the stats indicates that OTD rate of IT projects completed in H1 of 2020 was 50 percentage. Deliver an awe inspiring pitch with this creative utilizing agile methodology in data transformation project it determining the otd rate rules pdf bundle. Topics like projects, organization, customer can be discussed with this completely editable template. It is available for immediate download depending on the needs and requirements of the user.
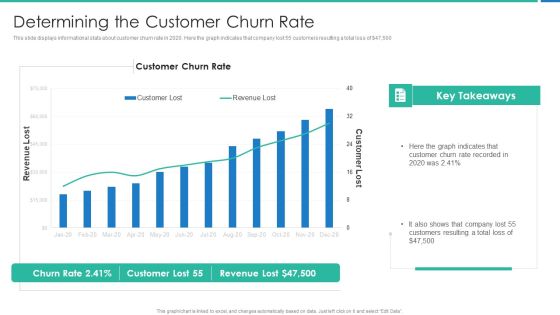
Strong Business Partnership To Ensure Company Success Determining The Customer Churn Rate Elements PDF
This slide displays informational stats about customer churn rate in 2020. Here the graph indicates that company lost 55 customers resulting a total loss of dollar 47,500 Deliver and pitch your topic in the best possible manner with this strong business partnership to ensure company success determining the customer churn rate elements pdf Use them to share invaluable insights on determining the customer churn rate and impress your audience. This template can be altered and modified as per your expectations. So, grab it now.
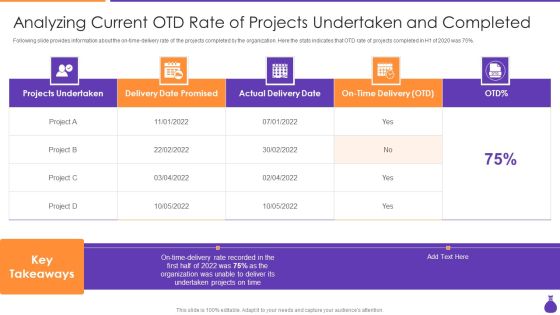
Why Is Agile Cost Effective IT Analyzing Current Otd Rate Of Projects Undertaken Brochure PDF
Following slide provides information about the on-time-delivery rate of the projects completed by the organization. Here the stats indicates that OTD rate of projects completed in H1 of 2020 was 75 Percent. Deliver and pitch your topic in the best possible manner with this Why Is Agile Cost Effective IT Analyzing Current Otd Rate Of Projects Undertaken Brochure PDF. Use them to share invaluable insights on Projects Undertaken, Delivery Date Promised, Actual Delivery Date and impress your audience. This template can be altered and modified as per your expectations. So, grab it now.

Advertising KPI Dashboard To Measure Cost Per Conversion Rate Themes PDF
This slide signifies the key performance indicator dashboard to track and evaluate cost per conversion. It includes KPI such as advertisement budget, clicks, ads impressions line chart and rate Showcasing this set of slides titled Advertising KPI Dashboard To Measure Cost Per Conversion Rate Themes PDF The topics addressed in these templates are Advertising Kpi Dashboard To Measure Cost Per Conversion Rate All the content presented in this PPT design is completely editable. Download it and make adjustments in color, background, font etc. as per your unique business setting.

Agile Techniques For Data Migration Determining The Otd Rate Of IT Projects Slides PDF
Mentioned slide provides information on the on-time-delivery rate of the IT projects completed by the organization. Here the stats indicates that OTD rate of IT projects completed in H1 of 2022 was 50 percent. Deliver and pitch your topic in the best possible manner with this Agile Techniques For Data Migration Determining The Otd Rate Of IT Projects Slides PDF. Use them to share invaluable insights on Projects Undertaken, Customer Promise Date, Projects Time and impress your audience. This template can be altered and modified as per your expectations. So, grab it now.

Successful Staff Retention Techniques KPI Metrics Dashboard Highlighting Employee Retention Rate Pictures PDF
The purpose of this slide is to exhibit a key performance indicator KPI dashboard through which managers can analyze the monthly employee retention rate. The metrics covered in the slide are active employees, new candidates hired, internal, exit, employee turnover rate, etc. Make sure to capture your audiences attention in your business displays with our gratis customizable Successful Staff Retention Techniques KPI Metrics Dashboard Highlighting Employee Retention Rate Pictures PDF. These are great for business strategies, office conferences, capital raising or task suggestions. If you desire to acquire more customers for your tech business and ensure they stay satisfied, create your own sales presentation with these plain slides.
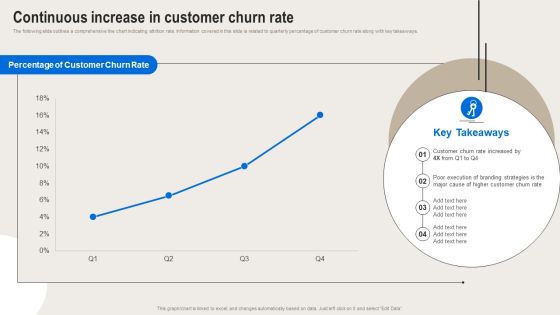
Formulating Branding Strategy To Enhance Revenue And Sales Continuous Increase In Customer Churn Rate Themes PDF
The following slide outlines a comprehensive line chart indicating attrition rate. Information covered in this slide is related to quarterly percentage of customer churn rate along with key takeaways. Boost your pitch with our creative Formulating Branding Strategy To Enhance Revenue And Sales Continuous Increase In Customer Churn Rate Themes PDF. Deliver an awe-inspiring pitch that will mesmerize everyone. Using these presentation templates you will surely catch everyones attention. You can browse the ppts collection on our website. We have researchers who are experts at creating the right content for the templates. So you do not have to invest time in any additional work. Just grab the template now and use them.

 Home
Home