Rating Meter

KPI Metrics Dashboard Highlighting Employee Retention Rate Developing Employee Retention Techniques Sample PDF
The purpose of this slide is to exhibit a key performance indicator KPI dashboard through which managers can analyze the monthly employee retention rate. The metrics covered in the slide are active employees, new candidates hired, internal, exit, employee turnover rate, etc.Do you have to make sure that everyone on your team knows about any specific topic I yes, then you should give KPI Metrics Dashboard Highlighting Employee Retention Rate Developing Employee Retention Techniques Sample PDF a try. Our experts have put a lot of knowledge and effort into creating this impeccable KPI Metrics Dashboard Highlighting Employee Retention Rate Developing Employee Retention Techniques Sample PDF. You can use this template for your upcoming presentations, as the slides are perfect to represent even the tiniest detail. You can download these templates from the Slidegeeks website and these are easy to edit. So grab these today.
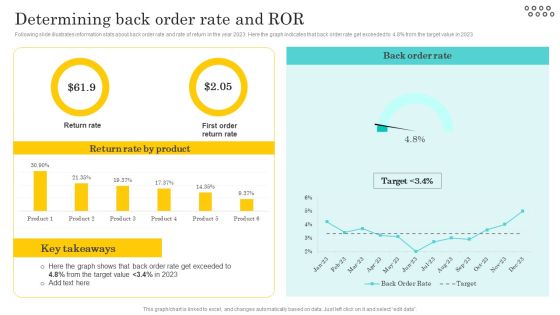
Optimizing And Managing Retail Determining Back Order Rate And Ror Information PDF
Following slide illustrates information stats about back order rate and rate of return in the year 2023. Here the graph indicates that back order rate get exceeded to 4.8 percent from the target value in 2023 . Slidegeeks is here to make your presentations a breeze with Optimizing And Managing Retail Determining Back Order Rate And Ror Information PDF With our easy-to-use and customizable templates, you can focus on delivering your ideas rather than worrying about formatting. With a variety of designs to choose from, youre sure to find one that suits your needs. And with animations and unique photos, illustrations, and fonts, you can make your presentation pop. So whether youre giving a sales pitch or presenting to the board, make sure to check out Slidegeeks first.

Implementation Of An Efficient Credit Card Promotion Plan Rise In Customer Churn Rate Leading Diagrams PDF
This slide represents challenges credit card companies face, i.e., an increase in customer churn rate. It includes key performance indicators such as customer engagement rate, customer dissatisfaction and product usage. Explore a selection of the finest Implementation Of An Efficient Credit Card Promotion Plan Rise In Customer Churn Rate Leading Diagrams PDF here. With a plethora of professionally designed and pre made slide templates, you can quickly and easily find the right one for your upcoming presentation. You can use our Implementation Of An Efficient Credit Card Promotion Plan Rise In Customer Churn Rate Leading Diagrams PDF to effectively convey your message to a wider audience. Slidegeeks has done a lot of research before preparing these presentation templates. The content can be personalized and the slides are highly editable. Grab templates today from Slidegeeks.

Enhancing Retail Process By Effective Inventory Management Determining Back Order Rate And ROR Information PDF
Following slide illustrates information stats about back order rate and rate of return in the year 2023. Here the graph indicates that back order rate get exceeded to 4.8percent from the target value in 2023 Slidegeeks is here to make your presentations a breeze with Enhancing Retail Process By Effective Inventory Management Determining Back Order Rate And ROR Information PDF With our easy to use and customizable templates, you can focus on delivering your ideas rather than worrying about formatting. With a variety of designs to choose from, you are sure to find one that suits your needs. And with animations and unique photos, illustrations, and fonts, you can make your presentation pop. So whether you are giving a sales pitch or presenting to the board, make sure to check out Slidegeeks first.

Decreasing Insurance Rate In Countryside Communities Case Competition Key Performance Indicators Total Icons PDF
Presenting decreasing insurance rate in countryside communities case competition key performance indicators total icons pdf to provide visual cues and insights. Share and navigate important information on two stages that need your due attention. This template can be used to pitch topics like total numbers of customers, customer satisfaction level, insurance policies sold. In addtion, this PPT design contains high resolution images, graphics, etc, that are easily editable and available for immediate download.

Effective Strategies For Retaining Healthcare Staff KPI Metrics Dashboard Highlighting Employee Retention Rate Summary PDF
The purpose of this slide is to exhibit a key performance indicator KPI dashboard through which managers can analyze the monthly employee retention rate. The metrics covered in the slide are active employees, new candidates hired, internal, exit, employee turnover rate, etc. Welcome to our selection of the Effective Strategies For Retaining Healthcare Staff KPI Metrics Dashboard Highlighting Employee Retention Rate Summary PDF. These are designed to help you showcase your creativity and bring your sphere to life. Planning and Innovation are essential for any business that is just starting out. This collection contains the designs that you need for your everyday presentations. All of our PowerPoints are 100 percent editable, so you can customize them to suit your needs. This multi purpose template can be used in various situations. Grab these presentation templates today.

SEO Kpis To Measure Traffic Management Conversion Rate On Website Infographics PDF
This slide showcases SEO key performance indicators such as organic clicks, referral traffic, search engine visibility, average session time, bounce rate, leads generated from SEO, goal completions, etc. Persuade your audience using this SEO Kpis To Measure Traffic Management Conversion Rate On Website Infographics PDF. This PPT design covers four stages, thus making it a great tool to use. It also caters to a variety of topics including Awareness, Engagement, Acquisition. Download this PPT design now to present a convincing pitch that not only emphasizes the topic but also showcases your presentation skills.

Dashboard For Tracking Employee Satisfaction Rate Ppt PowerPoint Presentation File Backgrounds PDF
This slide covers KPI dashboard to measure employee satisfaction due to effective internal communication. It includes indicators such as net promoter score, retention rate, absenteeism etc. From laying roadmaps to briefing everything in detail, our templates are perfect for you. You can set the stage with your presentation slides. All you have to do is download these easy to edit and customizable templates. Dashboard For Tracking Employee Satisfaction Rate Ppt PowerPoint Presentation File Backgrounds PDF will help you deliver an outstanding performance that everyone would remember and praise you for. Do download this presentation today.

Decreasing Insurance Rate In Countryside Communities Case Competition Key Performance Indicators Target Demonstration PDF
This slide shows the key performance indicators which includes number of insurance policies sold, number of households, total number of private companies etc.Deliver and pitch your topic in the best possible manner with this decreasing insurance rate in countryside communities case competition key performance indicators target demonstration pdf. Use them to share invaluable insights on policies sold in rural areas, premium collected, key performance indicator and impress your audience. This template can be altered and modified as per your expectations. So, grab it now.
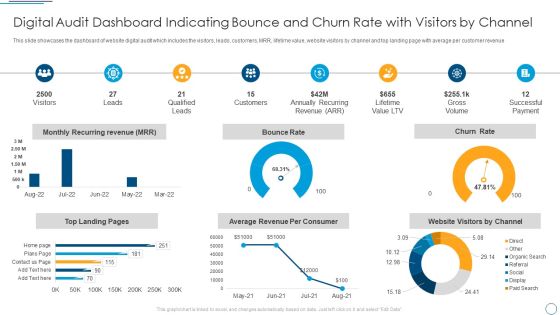
Digital Audit Dashboard Indicating Bounce And Churn Rate With Visitors By Channel Demonstration PDF
This slide showcases the dashboard of website digital audit which includes the visitors, leads, customers, MRR, lifetime value, website visitors by channel and top landing page with average per customer revenue.Deliver and pitch your topic in the best possible manner with this Digital Audit Dashboard Indicating Bounce And Churn Rate With Visitors By Channel Demonstration PDF. Use them to share invaluable insights on Qualified Leads, Annually Recurring, Successful Payment and impress your audience. This template can be altered and modified as per your expectations. So, grab it now.
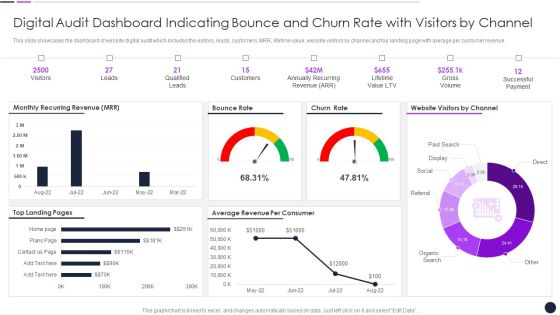
Digital Audit Dashboard Indicating Bounce And Churn Rate With Visitors By Channel Inspiration PDF
This slide showcases the dashboard of website digital audit which includes the visitors, leads, customers, MRR, lifetime value, website visitors by channel and top landing page with average per customer revenue.Deliver and pitch your topic in the best possible manner with this Digital Audit Dashboard Indicating Bounce And Churn Rate With Visitors By Channel Inspiration PDF. Use them to share invaluable insights on Qualified Leads, Annually Recurring, Lifetime Value and impress your audience. This template can be altered and modified as per your expectations. So, grab it now.
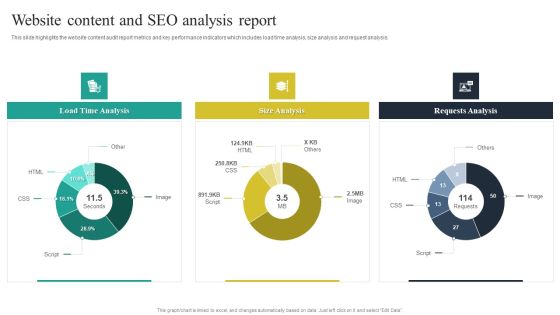
Website Audit To Increase Conversion Rate Website Content And SEO Analysis Report Microsoft PDF
This slide highlights the website content audit report metrics and key performance indicators which includes load time analysis, size analysis and request analysis. Make sure to capture your audiences attention in your business displays with our gratis customizable Website Audit To Increase Conversion Rate Website Content And SEO Analysis Report Microsoft PDF. These are great for business strategies, office conferences, capital raising or task suggestions. If you desire to acquire more customers for your tech business and ensure they stay satisfied, create your own sales presentation with these plain slides.

Formulating Branding Strategy To Enhance Revenue And Sales Kpis To Measure The Success Rate Of Advertising Icons PDF
The following slide outlines multiple key performance indicators used by the marketer to evaluate the effectiveness of an online advertisement campaign. The KPIs are likes, comments, shares, clickthrough rate CTR, open rate, bounce rate, article views, audience engagement rate and subscriber growth. Do you have to make sure that everyone on your team knows about any specific topic I yes, then you should give Formulating Branding Strategy To Enhance Revenue And Sales Kpis To Measure The Success Rate Of Advertising Icons PDF a try. Our experts have put a lot of knowledge and effort into creating this impeccable Formulating Branding Strategy To Enhance Revenue And Sales Kpis To Measure The Success Rate Of Advertising Icons PDF. You can use this template for your upcoming presentations, as the slides are perfect to represent even the tiniest detail. You can download these templates from the Slidegeeks website and these are easy to edit. So grab these today.

Business Product Feedback Survey Form Slides PDF
This slide covers business product feedback form for survey which includes rating meter for demonstrator presenting the product.Presenting Business Product Feedback Survey Form Slides PDF to dispense important information. This template comprises one stage. It also presents valuable insights into the topics including Purchased Product, Purchased Competitors, unsatisfactory This is a completely customizable PowerPoint theme that can be put to use immediately. So, download it and address the topic impactfully.
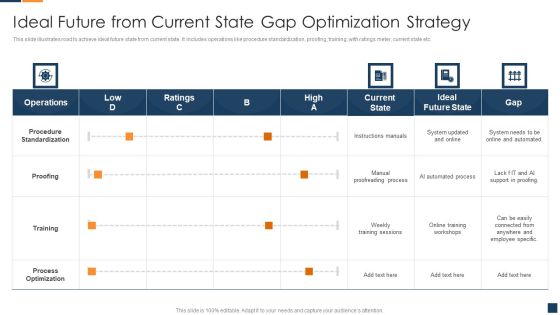
Ideal Future From Current State Gap Optimization Strategy Brochure PDF
This slide illustrates road to achieve ideal future state from current state. It includes operations like procedure standardization, proofing, training, with ratings meter, current state etc. Showcasing this set of slides titled Ideal Future From Current State Gap Optimization Strategy Brochure PDF. The topics addressed in these templates are Procedure Standardization, Process Optimization, Proofreading Process. All the content presented in this PPT design is completely editable. Download it and make adjustments in color, background, font etc. as per your unique business setting

Current State Optimization Procedure To Create Desired Results Portrait PDF
This slide illustrates road to achieve ideal future state from current state. It includes operations like procedure standardization, proofing, training, with ratings meter, current state etc.Showcasing this set of slides titled Current State Optimization Procedure To Create Desired Results Portrait PDF. The topics addressed in these templates are Procedure Standardization, Proofreading Process, Process Optimization. All the content presented in this PPT design is completely editable. Download it and make adjustments in color, background, font etc. as per your unique business setting.
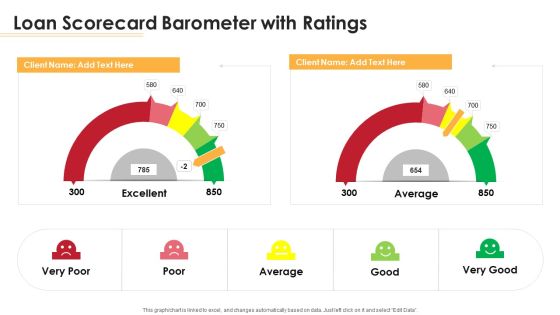
Loan Scorecard Barometer With Ratings Ppt Outline Information PDF
Deliver an awe inspiring pitch with this creative loan scorecard barometer with ratings ppt outline information pdf bundle. Topics like loan scorecard barometer with ratings can be discussed with this completely editable template. It is available for immediate download depending on the needs and requirements of the user.

Staff Development Strategy To Increase Employee Retention Rates Impact Of Workforce Development Post Implementation Template PDF
This slide represents effect of workforce development post implementation on key performance indicators. It includes job satisfaction rate, employee turnover rate, productivity rate etc. Do you have to make sure that everyone on your team knows about any specific topic I yes, then you should give Staff Development Strategy To Increase Employee Retention Rates Impact Of Workforce Development Post Implementation Template PDF a try. Our experts have put a lot of knowledge and effort into creating this impeccable Staff Development Strategy To Increase Employee Retention Rates Impact Of Workforce Development Post Implementation Template PDF. You can use this template for your upcoming presentations, as the slides are perfect to represent even the tiniest detail. You can download these templates from the Slidegeeks website and these are easy to edit. So grab these today.

Agile Software Development Lifecycle IT Agile Vs Waterfall Success Rates By Project Size Information PDF
Following slide illustrates informational stats on the overall success rate of both agile and waterfall methodologies. Here the slide also provides the details on success rate by project size.Deliver and pitch your topic in the best possible manner with this agile software development lifecycle it agile vs waterfall success rates by project size information pdf Use them to share invaluable insights on statistics indicates, succeed as compared, projects succeed and impress your audience. This template can be altered and modified as per your expectations. So, grab it now.
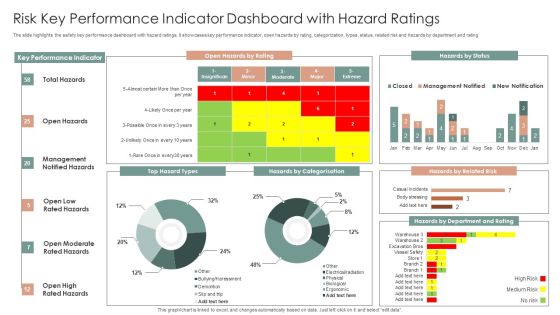
Risk Key Performance Indicator Dashboard With Hazard Ratings Ppt Layouts Slideshow PDF
The slide highlights the safety key performance dashboard with hazard ratings. It showcases key performance indicator, open hazards by rating, categorization, types, status, related risk and hazards by department and rating. Showcasing this set of slides titled Risk Key Performance Indicator Dashboard With Hazard Ratings Ppt Layouts Slideshow PDF. The topics addressed in these templates are Key Performance Indicator, Open Hazards, Hazards By Status. All the content presented in this PPT design is completely editable. Download it and make adjustments in color, background, font etc. as per your unique business setting.

Best Practices For Increasing Lead Conversion Rates Sales Operations Strategy Scorecard Ppt Model Rules PDF
Presenting this set of slides with name best practices for increasing lead conversion rates sales operations strategy scorecard ppt model rules pdf. The topics discussed in these slides are objective, programs, initiatives, actions, key performance indicators and metrics, target timeframe to achieve goals. This is a completely editable PowerPoint presentation and is available for immediate download. Download now and impress your audience.

Business Framework Performance Optimization PowerPoint Presentation
Explain the concept of performance optimization with this exclusive template slide. This PPT diagram slide contains the graphic of two meters with maximum ratings. Use this PPT diagram slide and build exclusive presentation for your viewers.

Profit Business PowerPoint Template 0910
beautiful woman posing near profit loss meter
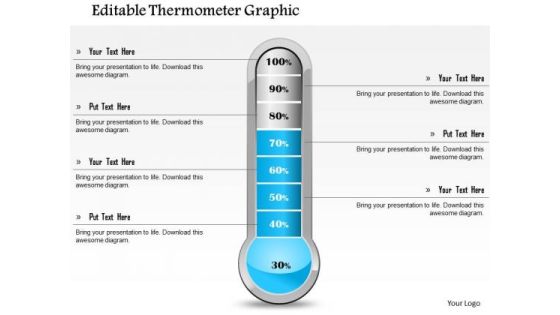
Business Framework Editable Thermometer Graphic PowerPoint Presentation
This Power Point template slide has been crafted with graphic of meter. This meter contains the max and min value. Use this PPt for your technical presentation and display your technical specifications in a graphical way.

Save Electricity Powerpoint Templates Microsoft
This is a save electricity powerpoint templates microsoft. This is a five stage process. The stages in this process are meter measures, save electricity, electricity production and consumption, excess power is exported, office solar photovoltaic array.

Business Framework Fuel Gauge Indicator PowerPoint Presentation
This diagram displays framework of fuel gauge indicator. It contains graphic of black meter indicating the fuel gauge. Use this editable diagram for your business and technology related presentations.

Business Framework Smiley Dashboard PowerPoint Presentation
This Power Point template slide has been designed with graphic of dashboard with meter diagram. This PPT slide contains the concept of maximum achievement. Use this PPT slide in your business presentations.
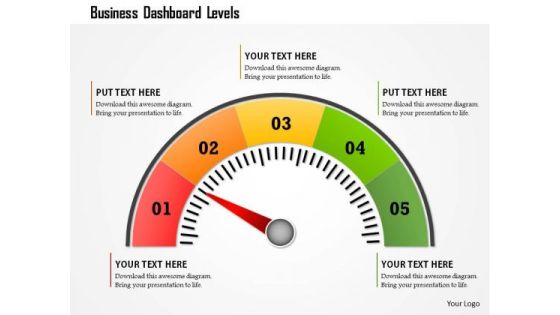
Business Framework Business Dashboard Levels PowerPoint Presentation
This business diagram displays colored meter with multiple levels. Use this diagram to display business process. This diagram can be used to indicate performance measures. This is an excellent diagram to impress your audiences.
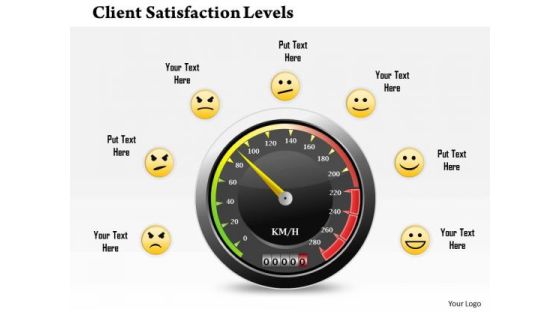
Business Framework Client Satisfaction Levels PowerPoint Presentation
Graphic of black meter has been used to design this business diagram. This business slide displays the concept of client satisfaction with different levels. Use this editable diagram for customer and business related presentations.

Dashboard Performance Analysis Chart Powerpoint Slides
This PowerPoint template graphics of meter chart. Download this PPT chart for business performance analysis. This PowerPoint slide is of great help in the business sector to make realistic presentations and provides effective way of presenting your newer thoughts.

Dashboard To Impact The Performance Powerpoint Slides
This PowerPoint template graphics of meter chart. Download this PPT chart for business performance analysis. This PowerPoint slide is of great help in the business sector to make realistic presentations and provides effective way of presenting your newer thoughts.

Dashboard To Simplify Business Data Analysis Powerpoint Slides
This PowerPoint template graphics of meter chart. Download this PPT chart to simplify business data analysis. This PowerPoint slide is of great help in the business sector to make realistic presentations and provides effective way of presenting your newer thoughts.

Dashboard For Employee Skill Assessment Powerpoint Slides
This innovative, stunningly beautiful dashboard has been designed for employee skill assessment. It contains graphics of meter with employee pictures. This PowerPoint template helps to display your information in a useful, simple and uncluttered way.

Condition Monitoring Powerpoint Presentation Templates
This is a condition monitoring powerpoint presentation templates. This is a six stage process. The stages in this process are asset templates, visual control, condition monitoring, repair facilities, failure codes, meter groups.

Repair Facilities Powerpoint Slide Presentation Sample
This is a repair facilities powerpoint slide presentation sample. This is a six stage process. The stages in this process are meter groups, condition monitoring, visual control, failure codes, asset templates, repair facilities.

Capital Investment Options Performance Based Vendor Classification Introduction PDF
Following slide portrays informational stats about vendor classification and selection. It indicates that vendor 2 will fall in group A and vendor 1 in group B. Deliver and pitch your topic in the best possible manner with this Capital Investment Options Performance Based Vendor Classification Introduction PDF. Use them to share invaluable insights on Reliability Performance Rating, Quality Rating, Delivery Rating and impress your audience. This template can be altered and modified as per your expectations. So, grab it now.

Business Projects Dashboard Template With Risk Status Report Template Topics PDF
The slide showcases a multi-project status report of a construction company. It highlights the project financials, resource allocation, portfolio risk meter and other key project parameters. Pitch your topic with ease and precision using this Business Projects Dashboard Template With Risk Status Report Template Topics PDF. This layout presents information on Portfolio Risk Meter, Project Financials, Project Parameters, Resource Allocation. It is also available for immediate download and adjustment. So, changes can be made in the color, design, graphics or any other component to create a unique layout.

Mobile SEO Tool For Driving Traffic Management To Website Demonstration PDF
This slide showcases SEO tools for mobile phones for attracting customers to visit company website. Key tools included here are mobile planet tool, mobile meter and page speed insights. Presenting Mobile SEO Tool For Driving Traffic Management To Website Demonstration PDF to dispense important information. This template comprises three stages. It also presents valuable insights into the topics including Mobile Planet, Mobile Meter, Pagespeed Insights . This is a completely customizable PowerPoint theme that can be put to use immediately. So, download it and address the topic impactfully.

Short Track Sports PowerPoint Templates And PowerPoint Backgrounds 0611
Microsoft PowerPoint Template and Background with 1500 meters short track speed skating heats

Dashboard With Business Icons Powerpoint Slides
This PowerPoint template graphics of meter chart with business icons. Download this PPT chart to simplify business data analysis. This PowerPoint slide is of great help in the business sector to make realistic presentations and provides effective way of presenting your newer thoughts.
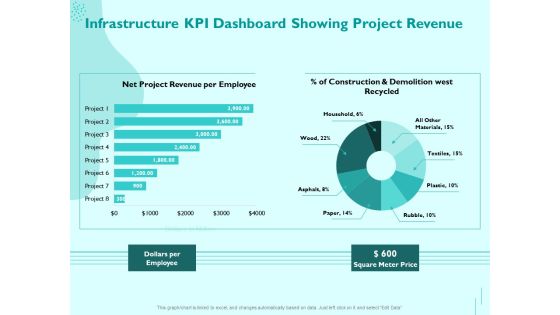
Managing IT Operating System Infrastructure KPI Dashboard Showing Project Revenue Diagrams PDF
Presenting this set of slides with name managing it operating system infrastructure kpi dashboard showing project revenue diagrams pdf. The topics discussed in these slides are dollars per employee, square meter price. This is a completely editable PowerPoint presentation and is available for immediate download. Download now and impress your audience.

Client Billing Work Flow In Service Sector Ppt PowerPoint Presentation Layouts Slideshow PDF
Presenting this set of slides with name client billing work flow in service sector ppt powerpoint presentation layouts slideshow pdf. This is a six stage process. The stages in this process are account creation, field services, meter data management, billing payment processing, bill collection. This is a completely editable PowerPoint presentation and is available for immediate download. Download now and impress your audience.
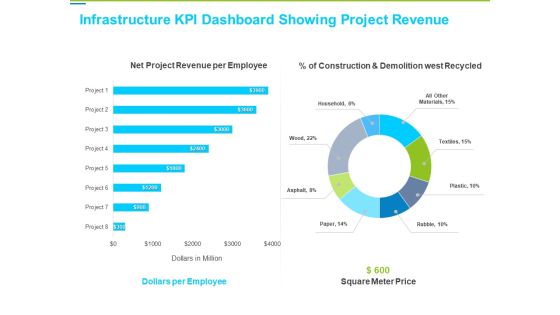
Framework Administration Infrastructure KPI Dashboard Showing Project Revenue Background PDF
Deliver an awe-inspiring pitch with this creative framework administration infrastructure kpi dashboard showing project revenue background pdf bundle. Topics like net project revenue per employee, dollars per employee, square meter price can be discussed with this completely editable template. It is available for immediate download depending on the needs and requirements of the user.

Substructure Segment Analysis Infrastructure KPI Dashboard Showing Project Revenue Summary PDF
Deliver and pitch your topic in the best possible manner with this substructure segment analysis infrastructure kpi dashboard showing project revenue summary pdf. Use them to share invaluable insights on square meter price, dollars per employee, net project revenue per employee and impress your audience. This template can be altered and modified as per your expectations. So, grab it now.
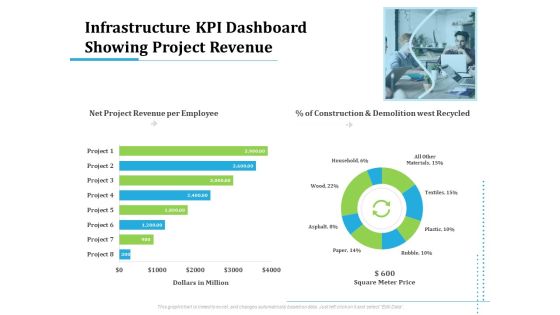
Information Technology Functions Management Infrastructure KPI Dashboard Showing Project Revenue Ppt Show Information PDF
Deliver an awe-inspiring pitch with this creative information technology functions management infrastructure kpi dashboard showing project revenue ppt show information pdf bundle. Topics like net project revenue per employee, construction and demolition west recycled, dollars million, square meter price, project can be discussed with this completely editable template. It is available for immediate download depending on the needs and requirements of the user.

Utilizing Infrastructure Management Using Latest Methods Infrastructure KPI Dashboard Showing Project Revenue Background PDF
Deliver an awe-inspiring pitch with this creative utilizing infrastructure management using latest methods infrastructure kpi dashboard showing project revenue background pdf bundle. Topics like net project revenue per employee, construction and demolition west recycled, dollars million, square meter price, project can be discussed with this completely editable template. It is available for immediate download depending on the needs and requirements of the user.

Improving Operational Activities Enterprise Infrastructure Kpi Dashboard Showing Project Revenue Professional PDF
Deliver an awe inspiring pitch with this creative improving operational activities enterprise infrastructure kpi dashboard showing project revenue professional pdf bundle. Topics like square meter price, dollars per employee can be discussed with this completely editable template. It is available for immediate download depending on the needs and requirements of the user.

Infrastructure Building Administration Infrastructure KPI Dashboard Showing Project Revenue Clipart PDF
Deliver an awe inspiring pitch with this creative infrastructure building administration infrastructure kpi dashboard showing project revenue clipart pdf bundle. Topics like square meter price, net project revenue per employee, dollars per employee can be discussed with this completely editable template. It is available for immediate download depending on the needs and requirements of the user.
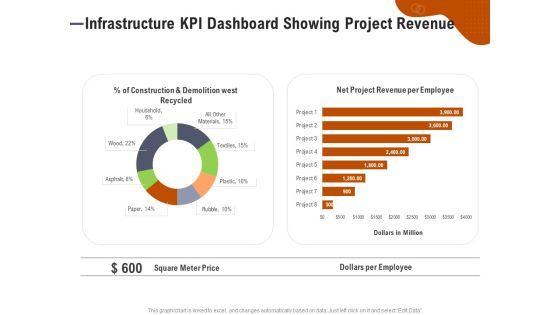
Key Features For Effective Business Management Infrastructure KPI Dashboard Showing Project Revenue Ppt Ideas File Formats PDF
Presenting this set of slides with name key features for effective business management infrastructure kpi dashboard showing project revenue ppt ideas file formats pdf. The topics discussed in these slides are construction and demolition west recycled, net project revenue per employee, square meter price, dollars per employee. This is a completely editable PowerPoint presentation and is available for immediate download. Download now and impress your audience.

Inventory Management Internal Corporate Audit Schedule Plan Scorecard Topics PDF
This slide covers audit scorecard for different inventory process. It includes machinery details along with audit score meter as per report and findings. Showcasing this set of slides titled Inventory Management Internal Corporate Audit Schedule Plan Scorecard Topics PDF. The topics addressed in these templates are Equipment, Inventory, Materials. All the content presented in this PPT design is completely editable. Download it and make adjustments in color, background, font etc. as per your unique business setting.

Solar Energy Business And Actual Power Generation With Electricity Use Structure PDF
This slide showcases post solar panel installation data. It includes start and end of power generation, electricity use, cumulative net meter credit, power billed, production etc. Pitch your topic with ease and precision using this Solar Energy Business And Actual Power Generation With Electricity Use Structure PDF. This layout presents information on Solar Energy Business, Actual Power Generation, Electricity Use. It is also available for immediate download and adjustment. So, changes can be made in the color, design, graphics or any other component to create a unique layout.
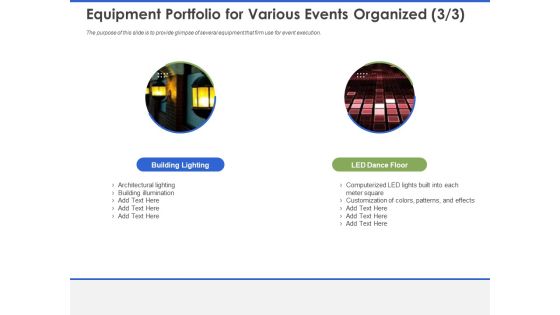
Event Management Services Equipment Portfolio For Various Events Organized Building Ppt PowerPoint Presentation Professional Show PDF
The purpose of this slide is to provide glimpse of several equipment that firm use for event execution. Deliver an awe-inspiring pitch with this creative event management services equipment portfolio for various events organized building ppt powerpoint presentation professional show pdf bundle. Topics like building lighting, led dance floor, architectural lighting, building illumination, computerized led lights built into each meter square, customization of colors, patterns, and effects can be discussed with this completely editable template. It is available for immediate download depending on the needs and requirements of the user.
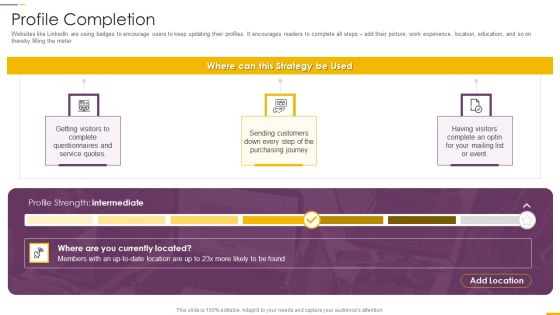
How Build Gamification Advertising Plan Profile Completion Ppt Gallery Structure PDF
Websites like LinkedIn are using badges to encourage users to keep updating their profiles. It encourages readers to complete all steps add their picture, work experience, location, education, and so on thereby filling the meter This is a how build gamification advertising plan profile completion ppt gallery structure pdf template with various stages. Focus and dispense information on three stages using this creative set, that comes with editable features. It contains large content boxes to add your information on topics like profile completion. You can also showcase facts, figures, and other relevant content using this PPT layout. Grab it now.

Budget Vs Actual Cost Comparison Dashboard Ppt PowerPoint Presentation Professional Format Ideas PDF
This slide illustrates fact and figures relating to various project budgets of a company. It includes monthly budget graph, project budget meter and budget vs. Actual costs chart.Pitch your topic with ease and precision using this Budget Vs Actual Cost Comparison Dashboard Ppt PowerPoint Presentation Professional Format Ideas PDF. This layout presents information on Milestones, Budget Graph, Manager. It is also available for immediate download and adjustment. So, changes can be made in the color, design, graphics or any other component to create a unique layout.

Virtual Assets Investment Guide Dashboard To Effectively Track Bitcoin Performance Rules PDF
The following dashboard highlights key parameters that can be used by the organization to track the performance of their Bitcoin investment, it enlists major KPIs such as price of Bitcoin, transaction chart and its historical performance. Deliver an awe inspiring pitch with this creative Virtual Assets Investment Guide Dashboard To Effectively Track Bitcoin Performance Rules PDF bundle. Topics like Bitcoin Chart, Transaction Chart, Prediction Meter can be discussed with this completely editable template. It is available for immediate download depending on the needs and requirements of the user.

New General Adaption Playbook For Organizations Physical Distancing Protocol Guideline For Workplace Summary PDF
This template covers physical distancing protocols for workplace such as keep 2 meter 6 feet distance between workers and between workers and the public, avoid hand contact with surfaces touched by others as much as reasonably possible etc. Deliver and pitch your topic in the best possible manner with this New General Adaption Playbook For Organizations Physical Distancing Protocol Guideline For Workplace Summary PDF. Use them to share invaluable insights on Potential, General Measures and impress your audience. This template can be altered and modified as per your expectations. So, grab it now.

Physical Distancing Protocols Guidelines During Shift Changes Mockup PDF
This template covers physical distancing protocols during shift change at workplace such as 2 meter 6 feet distance between workers and between workers and the public, avoid hand contact with surfaces touched by others as much as reasonably possible etc. This is a Physical Distancing Protocols Guidelines During Shift Changes Mockup PDF template with various stages. Focus and dispense information on two stages using this creative set, that comes with editable features. It contains large content boxes to add your information on topics like Locations, Implement, Physical Distancing Protocols. You can also showcase facts, figures, and other relevant content using this PPT layout. Grab it now.

Strategic Playbook Sustaining Business During Pandemic Physical Distancing Protocol Demonstration PDF
This template covers physical distancing protocols for workplace such as keep 2 meter 6 feet distance between workers and between workers and the public, avoid hand contact with surfaces touched by others as much as reasonably possible etc. Presenting Strategic Playbook Sustaining Business During Pandemic Physical Distancing Protocol Demonstration PDF to provide visual cues and insights. Share and navigate important information on three stages that need your due attention. This template can be used to pitch topics like Physical Distancing Protocol, Guideline For Workplace. In addtion, this PPT design contains high resolution images, graphics, etc, that are easily editable and available for immediate download.
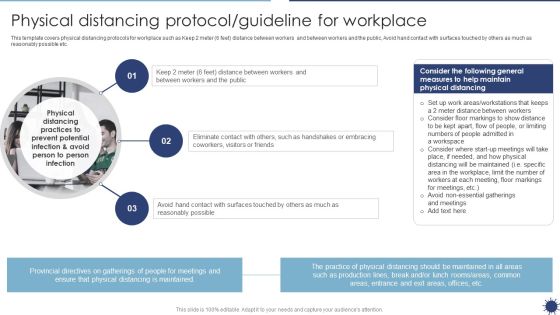
Physical Distancing Protocol Guideline For Workplace Organization Transformation Instructions Topics PDF
This template covers physical distancing protocols for workplace such as Keep 2 meter 6 feet distance between workers and between workers and the public, Avoid hand contact with surfaces touched by others as much as reasonably possible etc. There are so many reasons you need a Physical Distancing Protocol Guideline For Workplace Organization Transformation Instructions Topics PDF. The first reason is you can not spend time making everything from scratch, Thus, Slidegeeks has made presentation templates for you too. You can easily download these templates from our website easily.

Core Operational Competencies Risk Analysis Software Tool Graphics PDF
This slide covers the risk assessment meter with different operational and core objectives. It also includes the list and activity status of initiatives along with the status report. Pitch your topic with ease and precision using this Core Operational Competencies Risk Analysis Software Tool Graphics PDF. This layout presents information on Strategic Partnership, Market Value, Shareholder Investment. It is also available for immediate download and adjustment. So, changes can be made in the color, design, graphics or any other component to create a unique layout.

 Home
Home