Rating Meter
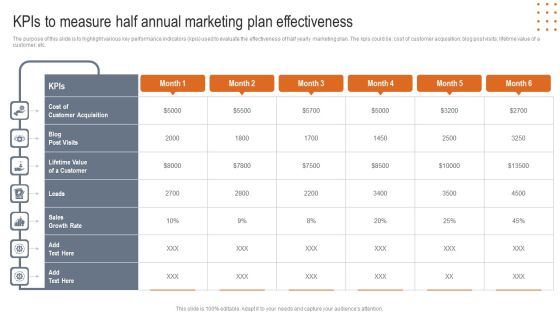
Kpis To Measure Half Annual Marketing Plan Effectiveness Designs PDF
The purpose of this slide is to highlight various key performance indicators kpis used to evaluate the effectiveness of half yearly marketing plan. The kpis could be cost of customer acquisition blog post visits lifetime value of a customer etc. Pitch your topic with ease and precision using this Kpis To Measure Half Annual Marketing Plan Effectiveness Designs PDF. This layout presents information on Customer Acquisition, Lifetime Value Customer, Growth Rate. It is also available for immediate download and adjustment. So, changes can be made in the color, design, graphics or any other component to create a unique layout.
Logistics Management Strategy Effectiveness Tracking Sheet Introduction PDF
This slide covers the key performance indicator for tracking impact of new logistics management strategy. It includes metrics such as shipping time, order accuracy, lead time, capacity utilization, customer backorder rate, inventory turnover, etc. If your project calls for a presentation, then Slidegeeks is your go-to partner because we have professionally designed, easy-to-edit templates that are perfect for any presentation. After downloading, you can easily edit Logistics Management Strategy Effectiveness Tracking Sheet Introduction PDF and make the changes accordingly. You can rearrange slides or fill them with different images. Check out all the handy templates

Key Metrics To Measure Current Performance Of Ecommerce Website Clipart PDF
This slide represents the key performance indicators to track and monitor the performance of ecommerce website to draw effective strategies to tackle the problems. It includes key metrics for ecommerce website performance measurement such as average order value and shopping cart abandonment rate.The best PPT templates are a great way to save time, energy, and resources. Slidegeeks have 100precent editable powerpoint slides making them incredibly versatile. With these quality presentation templates, you can create a captivating and memorable presentation by combining visually appealing slides and effectively communicating your message. Download Key Metrics To Measure Current Performance Of Ecommerce Website Clipart PDF from Slidegeeks and deliver a wonderful presentation.

Dashboard To Analyze Flexible Working Strategies Impact On Employees Performance Rules PDF
The following slide delineates a key performance indicator KPI dashboard through which managers can evaluate the success of a flexible working policy on workforce performance. The major KPIs are absenteeism rate, overall labor effectiveness etc.If your project calls for a presentation, then Slidegeeks is your go-to partner because we have professionally designed, easy to edit templates that are perfect for any presentation. After downloading, you can easily edit Dashboard To Analyze Flexible Working Strategies Impact On Employees Performance Rules PDF and make the changes accordingly. You can rearrange slides or fill them with different images. Check out all the handy templates

Advertising New Commodities Through Affect Of Extension Strategies On Brands Icons PDF
This slide showcases affect of key extension strategies on major key performance indicators KPI and market insights. It provides details about lifetime value, audience share, customer retention rate, customer engagement, online promotion, etc. Find a pre-designed and impeccable Advertising New Commodities Through Affect Of Extension Strategies On Brands Icons PDF. The templates can ace your presentation without additional effort. You can download these easy-to-edit presentation templates to make your presentation stand out from others. So, what are you waiting for Download the template from Slidegeeks today and give a unique touch to your presentation.

Metrics Dashboard Depicting Call Center Performance Pictures PDF
Mentioned slide outlines key performance indicator KPI dashboard which can be used by call center to optimize the agents performance. The major metrics covered in the template are total calls, average speed of answer, abandon rate, service level agreement SLA limit etc. Pitch your topic with ease and precision using this Metrics Dashboard Depicting Call Center Performance Pictures PDF. This layout presents information on Overall Satisfaction Score, Satisfaction Score, Performance. It is also available for immediate download and adjustment. So, changes can be made in the color, design, graphics or any other component to create a unique layout.

Key Tips To Improve E Commerce Website Management Ppt Icon Show PDF
This slide illustrates key tips which can be used by online business to increase website traffic and conversion rate. It includes tips such as website backup, loading time, perform keyword analysis and key performance indicators review. Persuade your audience using this Key Tips To Improve E Commerce Website Management Ppt Icon Show PDF. This PPT design covers four stages, thus making it a great tool to use. It also caters to a variety of topics including Website Backup, Loading Time, Perform Keyword Analysis, KPI Review . Download this PPT design now to present a convincing pitch that not only emphasizes the topic but also showcases your presentation skills.

Strategies To Enhance Call Center Management Evaluate Performance By Monitoring Call Rules PDF
This slide highlights call center key performance indicators which can be used to evaluate organization and employee performance which includes service level, response time, abandonment rate, Quality monitoring scores, customer satisfaction and first call resolution. Find a pre-designed and impeccable Strategies To Enhance Call Center Management Evaluate Performance By Monitoring Call Rules PDF. The templates can ace your presentation without additional effort. You can download these easy-to-edit presentation templates to make your presentation stand out from others. So, what are you waiting for Download the template from Slidegeeks today and give a unique touch to your presentation.

KPI Dashboard To Measure Sales Divisional Strategy Performance Microsoft PDF
This slide signifies the key performance indicator dashboard to evaluate sales department strategy. It covers information regarding to the leads generated, conversion rate, top product in revenue. Pitch your topic with ease and precision using this KPI Dashboard To Measure Sales Divisional Strategy Performance Microsoft PDF. This layout presents information on Sales Rations, Lead Generation, Customer Conversion. It is also available for immediate download and adjustment. So, changes can be made in the color, design, graphics or any other component to create a unique layout.

Public Relations Guide To Enhance Brand Credibility Annual Goals Of Public Relations Marketing Graphics PDF
This slide shows various key performance indicators which can be used by organizations to set PR goals. It includes metrics such as media coverage, brand mentions, share of voice , social media engagement rate, etc. There are so many reasons you need a Public Relations Guide To Enhance Brand Credibility Annual Goals Of Public Relations Marketing Graphics PDF. The first reason is you cannot spend time making everything from scratch, Thus, Slidegeeks has made presentation templates for you too. You can easily download these templates from our website easily.

Kpis To Track Before Raising Capital Portrait PDF
This slide presents various key performance metrics which a company should track in order to raise capital for equity. The major key performance indicators are revenue growth, gross margin, customer acquisition costs, net promoter score and burn rate. Pitch your topic with ease and precision using this Kpis To Track Before Raising Capital Portrait PDF. This layout presents information on Net Promoter Score, Customer Acquisition Costs, Gross Margin. It is also available for immediate download and adjustment. So, changes can be made in the color, design, graphics or any other component to create a unique layout.

Optimizing Human Capital Alignment Assessing Workforce Performance Evaluation Kpis Download PDF
This slide provides glimpse about multiple key performance indicators that will help our company to evaluate workforce performance. It includes performance standards, description, ratings, etc. Take your projects to the next level with our ultimate collection of Optimizing Human Capital Alignment Assessing Workforce Performance Evaluation Kpis Download PDF. Slidegeeks has designed a range of layouts that are perfect for representing task or activity duration, keeping track of all your deadlines at a glance. Tailor these designs to your exact needs and give them a truly corporate look with your own brand colors theyll make your projects stand out from the rest.

Step 8 Event Management Performance Evaluation Metrics Themes PDF
This slide showcases the key metrics that are tracked to measure event success. The indicators covered are registration trends, post survey responses, cost per attendee, NPS and conversion rate. Take your projects to the next level with our ultimate collection of Step 8 Event Management Performance Evaluation Metrics Themes PDF. Slidegeeks has designed a range of layouts that are perfect for representing task or activity duration, keeping track of all your deadlines at a glance. Tailor these designs to your exact needs and give them a truly corporate look with your own brand colors they will make your projects stand out from the rest
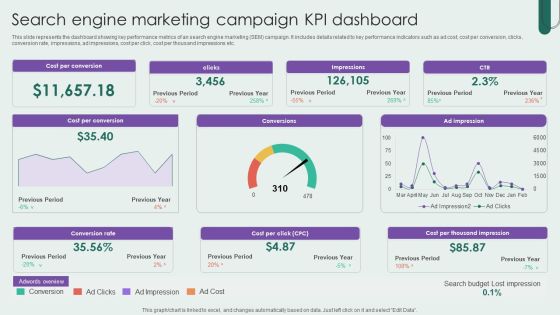
Search Engine Marketing Campaign KPI Dashboard Inspiration PDF
This slide represents the dashboard showing key performance metrics of an search engine marketing SEM campaign. It includes details related to key performance indicators such as ad cost, cost per conversion, clicks, conversion rate, impressions, ad impressions, cost per click, cost per thousand impressions etc. Showcasing this set of slides titled Search Engine Marketing Campaign KPI Dashboard Inspiration PDF. The topics addressed in these templates are Search Engine Marketing, Campaign KPI Dashboard. All the content presented in this PPT design is completely editable. Download it and make adjustments in color, background, font etc. as per your unique business setting.
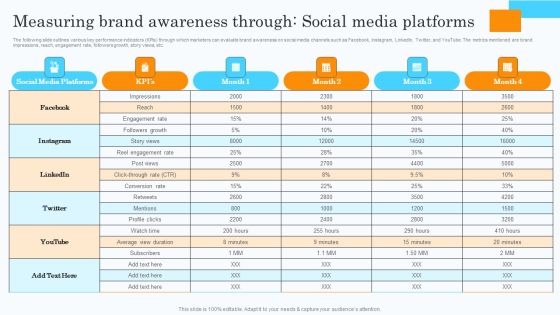
Market Research Assessment Of Target Market Requirements Measuring Brand Awareness Through Social Media Download PDF
The following slide outlines various key performance indicators KPIs through which marketers can evaluate brand awareness on social media channels such as Facebook, Instagram, LinkedIn, Twitter, and YouTube. The metrics mentioned are brand impressions, reach, engagement rate, followers growth, story views, etc. Find a pre designed and impeccable Market Research Assessment Of Target Market Requirements Measuring Brand Awareness Through Social Media Download PDF. The templates can ace your presentation without additional effort. You can download these easy to edit presentation templates to make your presentation stand out from others. So, what are you waiting for Download the template from Slidegeeks today and give a unique touch to your presentation.
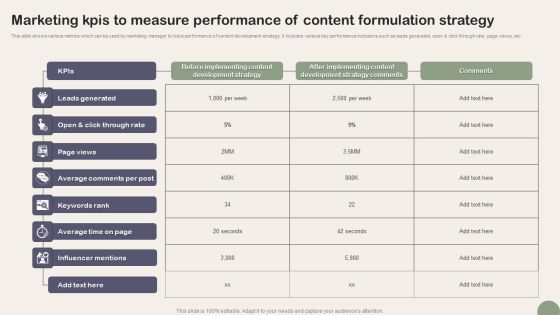
Marketing Kpis To Measure Performance Of Content Formulation Strategy Download PDF
This slide shows various metrics which can be used by marketing manager to track performance of content development strategy. It includes various key performance indicators such as leads generated, open and click through rate, page views, etc. Showcasing this set of slides titled Marketing Kpis To Measure Performance Of Content Formulation Strategy Download PDF. The topics addressed in these templates are Leads Generated, Page Views, Average Comments Per Post. All the content presented in this PPT design is completely editable. Download it and make adjustments in color, background, font etc. as per your unique business setting.
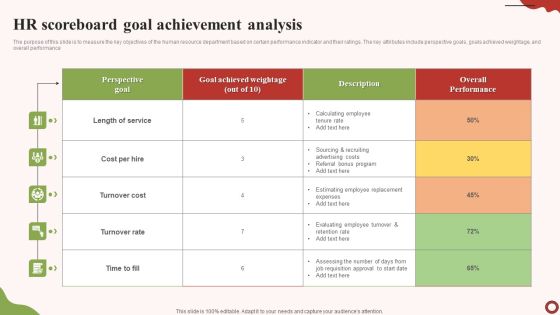
HR Scoreboard Goal Achievement Analysis Structure PDF
The purpose of this slide is to measure the key objectives of the human resource department based on certain performance indicator and their ratings. The key attributes include perspective goals, goals achieved weightage, and overall performance. Showcasing this set of slides titled HR Scoreboard Goal Achievement Analysis Structure PDF. The topics addressed in these templates are Length Service, Cost Per Hire, Turnover Cost. All the content presented in this PPT design is completely editable. Download it and make adjustments in color, background, font etc. as per your unique business setting.

Measuring Brand Awareness Through Social Media Platforms Ppt PowerPoint Presentation Diagram Graph Charts PDF
The following slide outlines various key performance indicators KPIs through which marketers can evaluate brand awareness on social media channels such as Facebook, Instagram, LinkedIn, Twitter, and YouTube. The metrics mentioned are brand impressions, reach, engagement rate, followers growth, story views, etc. The best PPT templates are a great way to save time, energy, and resources. Slidegeeks have 100 percent editable powerpoint slides making them incredibly versatile. With these quality presentation templates, you can create a captivating and memorable presentation by combining visually appealing slides and effectively communicating your message. Download Measuring Brand Awareness Through Social Media Platforms Ppt PowerPoint Presentation Diagram Graph Charts PDF from Slidegeeks and deliver a wonderful presentation.

Business Sales Optimization Advertisement Campaign Kpis To Track Success Of Content Marketing Campaign Download PDF
This slide showcases the expected increase in content marketing performance indicators after conducting effective campaigns. The KPIs covered are lead and revenue generation, engagement rate, page views and backlinks. Want to ace your presentation in front of a live audience Our Business Sales Optimization Advertisement Campaign Kpis To Track Success Of Content Marketing Campaign Download PDF can help you do that by engaging all the users towards you. Slidegeeks experts have put their efforts and expertise into creating these impeccable powerpoint presentations so that you can communicate your ideas clearly. Moreover, all the templates are customizable, and easy to edit and downloadable. Use these for both personal and commercial use.
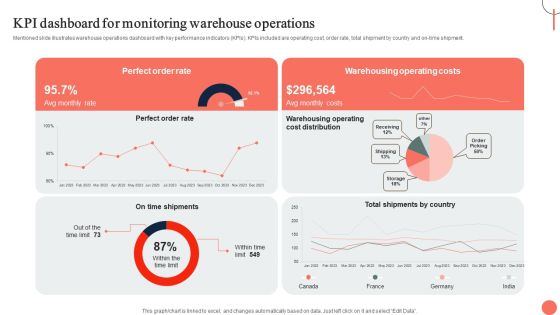
Strategies For Dynamic Supply Chain Agility KPI Dashboard For Monitoring Warehouse Operations Download PDF
Mentioned slide illustrates warehouse operations dashboard with key performance indicators KPIs. KPIs included are operating cost, order rate, total shipment by country and on-time shipment. Slidegeeks is one of the best resources for PowerPoint templates. You can download easily and regulate Strategies For Dynamic Supply Chain Agility KPI Dashboard For Monitoring Warehouse Operations Download PDF for your personal presentations from our wonderful collection. A few clicks is all it takes to discover and get the most relevant and appropriate templates. Use our Templates to add a unique zing and appeal to your presentation and meetings. All the slides are easy to edit and you can use them even for advertisement purposes.
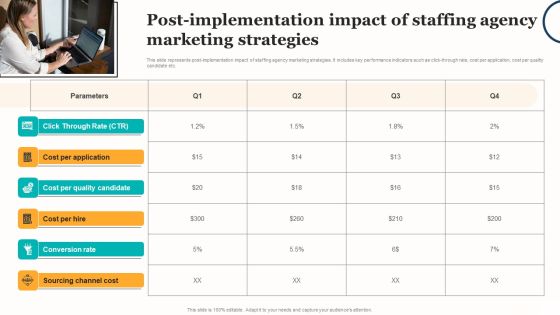
Marketing Strategy For A Recruitment Company Post Implementation Impact Of Staffing Agency Marketing Introduction PDF
This slide represents post-implementation impact of staffing agency marketing strategies. It includes key performance indicators such as click-through rate, cost per application, cost per quality candidate etc. The best PPT templates are a great way to save time, energy, and resources. Slidegeeks have 100 percent editable powerpoint slides making them incredibly versatile. With these quality presentation templates, you can create a captivating and memorable presentation by combining visually appealing slides and effectively communicating your message. Download Marketing Strategy For A Recruitment Company Post Implementation Impact Of Staffing Agency Marketing Introduction PDF from Slidegeeks and deliver a wonderful presentation.
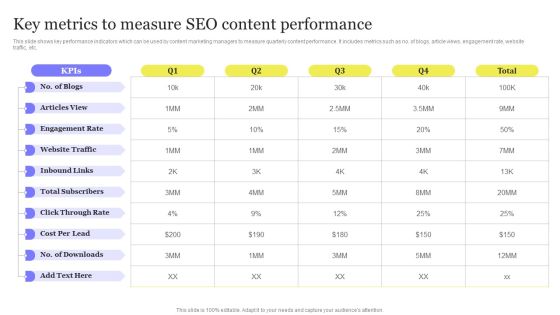
Enhancing Digital Visibility Using SEO Content Strategy Key Metrics To Measure SEO Content Performance Guidelines PDF
This slide shows key performance indicators which can be used by content marketing managers to measure quarterly content performance. It includes metrics such as no. of blogs, article views, engagement rate, website traffic, etc. Make sure to capture your audiences attention in your business displays with our gratis customizable Enhancing Digital Visibility Using SEO Content Strategy Key Metrics To Measure SEO Content Performance Guidelines PDF. These are great for business strategies, office conferences, capital raising or task suggestions. If you desire to acquire more customers for your tech business and ensure they stay satisfied, create your own sales presentation with these plain slides.

Advertising Programs Management Techniques Kpis To Track Success Of Email Marketing Campaign Download PDF
This slide showcases improvement in performance indicators post advertising campaign. The metrics covered are email ROI, open, clickthrough, bounce and unsubscribe rate. Slidegeeks is one of the best resources for PowerPoint templates. You can download easily and regulate Advertising Programs Management Techniques Kpis To Track Success Of Email Marketing Campaign Download PDF for your personal presentations from our wonderful collection. A few clicks is all it takes to discover and get the most relevant and appropriate templates. Use our Templates to add a unique zing and appeal to your presentation and meetings. All the slides are easy to edit and you can use them even for advertisement purposes.
Steps To Effectively Conduct Market Research Measuring Brand Awareness Through Social Media Platforms Icons PDF
The following slide outlines various key performance indicators KPIs through which marketers can evaluate brand awareness on social media channels such as Facebook, Instagram, LinkedIn, Twitter, and YouTube. The metrics mentioned are brand impressions, reach, engagement rate, followers growth, story views, etc. Find a pre designed and impeccable Steps To Effectively Conduct Market Research Measuring Brand Awareness Through Social Media Platforms Icons PDF. The templates can ace your presentation without additional effort. You can download these easy to edit presentation templates to make your presentation stand out from others. So, what are you waiting for Download the template from Slidegeeks today and give a unique touch to your presentation.
Techniques For Effective Supply Chain Management Logistics Management Strategy Effectiveness Tracking Sheet Demonstration PDF
This slide covers the key performance indicator for tracking impact of new logistics management strategy. It includes metrics such as shipping time, order accuracy, lead time, capacity utilization, customer backorder rate, inventory turnover, etc. There are so many reasons you need a Techniques For Effective Supply Chain Management Logistics Management Strategy Effectiveness Tracking Sheet Demonstration PDF. The first reason is you cannot spend time making everything from scratch, Thus, Slidegeeks has made presentation templates for you too. You can easily download these templates from our website easily.
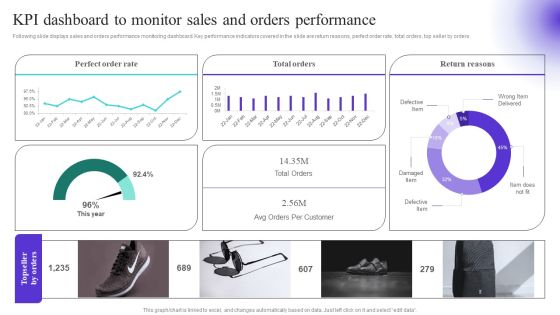
KPI Dashboard To Monitor Sales And Orders Performance Diagrams PDF
Following slide displays sales and orders performance monitoring dashboard. Key performance indicators covered in the slide are return reasons, perfect order rate, total orders, top seller by orders. Create an editable KPI Dashboard To Monitor Sales And Orders Performance Diagrams PDF that communicates your idea and engages your audience. Whether you are presenting a business or an educational presentation, pre designed presentation templates help save time. KPI Dashboard To Monitor Sales And Orders Performance Diagrams PDF is highly customizable and very easy to edit, covering many different styles from creative to business presentations. Slidegeeks has creative team members who have crafted amazing templates. So, go and get them without any delay.
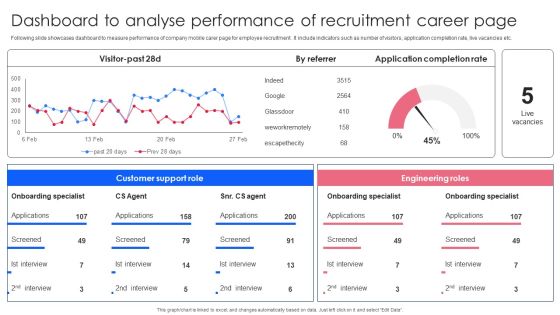
Effective Guide To Build Strong Online Hiring Strategy Dashboard To Analyse Performance Of Recruitment Download PDF
Following slide showcases dashboard to measure performance of company mobile carer page for employee recruitment . It include indicators such as number of visitors, application completion rate, live vacancies etc. Boost your pitch with our creative Effective Guide To Build Strong Online Hiring Strategy Dashboard To Analyse Performance Of Recruitment Download PDF. Deliver an awe-inspiring pitch that will mesmerize everyone. Using these presentation templates you will surely catch everyones attention. You can browse the ppts collection on our website. We have researchers who are experts at creating the right content for the templates. So you do not have to invest time in any additional work. Just grab the template now and use them.

Effective Guide To Build Strong Online Hiring Strategy KPI Dashboard To Track Performance Of Digital Slides PDF
Following slide exhibits dashboard to measure performance efficiency of using digital technology in recruitment strategy. It include indicators such as acceptance rate, days to fill, current hiring pipeline, top hiring sources etc. There are so many reasons you need a Effective Guide To Build Strong Online Hiring Strategy KPI Dashboard To Track Performance Of Digital Slides PDF. The first reason is you cannot spend time making everything from scratch, Thus, Slidegeeks has made presentation templates for you too. You can easily download these templates from our website easily.
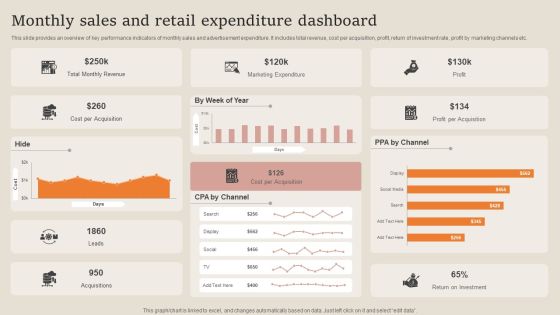
Monthly Sales And Retail Expenditure Dashboard Summary PDF
This slide provides an overview of key performance indicators of monthly sales and advertisement expenditure. It includes total revenue, cost per acquisition, profit, return of investment rate, profit by marketing channels etc. Pitch your topic with ease and precision using this Monthly Sales And Retail Expenditure Dashboard Summary PDF. This layout presents information on Marketing Expenditure, Revenue, Cost Per Acquisition. It is also available for immediate download and adjustment. So, changes can be made in the color, design, graphics or any other component to create a unique layout.
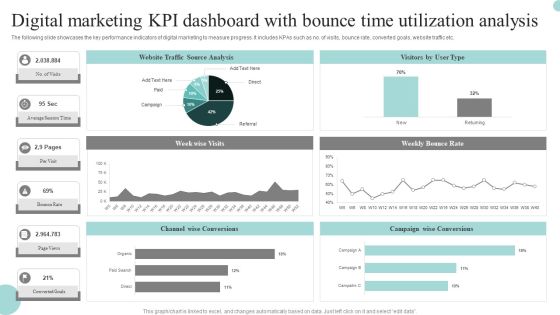
Digital Marketing Kpi Dashboard With Bounce Time Utilization Analysis Graphics PDF
The following slide showcases the key performance indicators of digital marketing to measure progress. It includes KPAs such as no. of visits, bounce rate, converted goals, website traffic etc. Pitch your topic with ease and precision using this Digital Marketing Kpi Dashboard With Bounce Time Utilization Analysis Graphics PDF. This layout presents information on Digital Marketing, KPI Dashboard, Bounce Time Utilization Analysis. It is also available for immediate download and adjustment. So, changes can be made in the color, design, graphics or any other component to create a unique layout.
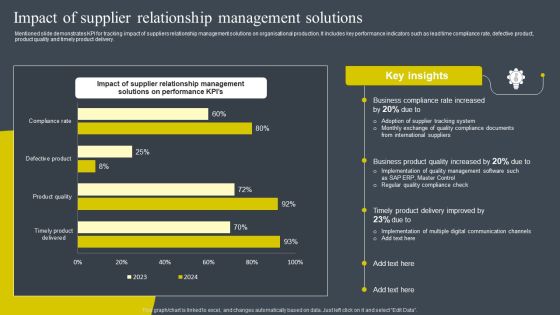
Impact Of Supplier Relationship Management Solutions Rules PDF
Mentioned slide demonstrates KPI for tracking impact of suppliers relationship management solutions on organisational production. It includes key performance indicators such as lead time compliance rate, defective product, product quality and timely product delivery. The best PPT templates are a great way to save time, energy, and resources. Slidegeeks have 100 percent editable powerpoint slides making them incredibly versatile. With these quality presentation templates, you can create a captivating and memorable presentation by combining visually appealing slides and effectively communicating your message. Download Impact Of Supplier Relationship Management Solutions Rules PDF from Slidegeeks and deliver a wonderful presentation.

Client Acquisition Through Marketing Campaign Kpis To Track Success Of Content Marketing Campaign Template PDF
This slide showcases the expected increase in content marketing performance indicators after conducting effective campaigns. The KPIs covered are lead and revenue generation, engagement rate, page views and backlinks. Want to ace your presentation in front of a live audience Our Client Acquisition Through Marketing Campaign Kpis To Track Success Of Content Marketing Campaign Template PDF can help you do that by engaging all the users towards you. Slidegeeks experts have put their efforts and expertise into creating these impeccable powerpoint presentations so that you can communicate your ideas clearly. Moreover, all the templates are customizable, and easy to edit and downloadable. Use these for both personal and commercial use.

Kpi Dashboard To Track Owned Media Metrics Rules PDF
This slide brings forth a dashboard to track the performance of earned media channels which can be used by brand managers to get a brief idea about the effectiveness of the marketing strategy. Key performing indicators include number of conversions, conversion rate, backlinks published etc. Pitch your topic with ease and precision using this Kpi Dashboard To Track Owned Media Metrics Rules PDF. This layout presents information on Conversions, Backlinks Published, Metrics. It is also available for immediate download and adjustment. So, changes can be made in the color, design, graphics or any other component to create a unique layout.

Corporate Financial KPI Dashboard To Statement Cash Flow Of Company Diagrams PDF
This slide presents a financial dashboard of an enterprise which is being used to report the total spending power of a company. Key performing indicators include cash burn rate, monthly expenses, solvency etc. Showcasing this set of slides titled Corporate Financial KPI Dashboard To Statement Cash Flow Of Company Diagrams PDF. The topics addressed in these templates are Solvency, Debtors, Monthly Expenses. All the content presented in this PPT design is completely editable. Download it and make adjustments in color, background, font etc. as per your unique business setting.

Procurement Plan Kpi To Monitor Business Performance Clipart PDF
Entire slide depicts the key performance indicator for procurement strategy which help in analyzing the variance lag behind the objectives. It includes the parameters like compliance rare, supplier rate, etc. Showcasing this set of slides titled Procurement Plan Kpi To Monitor Business Performance Clipart PDF. The topics addressed in these templates are Key Insights, Vendor Availability, Procurement ROI. All the content presented in this PPT design is completely editable. Download it and make adjustments in color, background, font etc. as per your unique business setting.
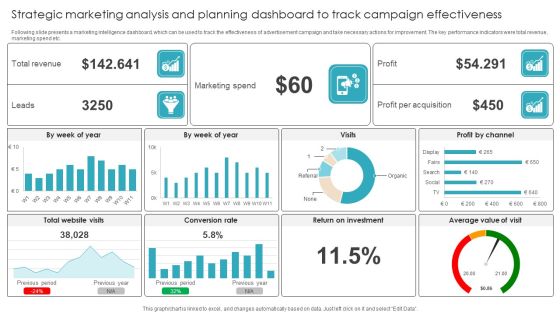
Strategic Marketing Analysis And Planning Dashboard To Track Campaign Effectiveness Summary PDF
Following slide presents a marketing intelligence dashboard, which can be used to track the effectiveness of advertisement campaign and take necessary actions for improvement. The key performance indicators were total revenue, marketing spend etc. Showcasing this set of slides titled Strategic Marketing Analysis And Planning Dashboard To Track Campaign Effectiveness Summary PDF. The topics addressed in these templates are Marketing Spend, Conversion Rate, Return Investment. All the content presented in this PPT design is completely editable. Download it and make adjustments in color, background, font etc. as per your unique business setting.

Company Success Strategy Powerpoint Ideas
This is a company success strategy powerpoint ideas. This is a five stage process. The stages in this process are business, marketing, success, strategy, target.

Mid Term Goals Set Up Powerpoint Slide Design Ideas
This is a mid term goals set up powerpoint slide design ideas. This is a four stage process. The stages in this process are arrows, business, marketing, planning, years.

10 Designs To An Amazing Pitch Example Of Ppt
This is a 10 designs to an amazing pitch example of ppt. This is a ten stage process. The stages in this process are business model, money, market size, the solution, team, marketing plan, competition, elevator pitch, proprietary tech, the problem.
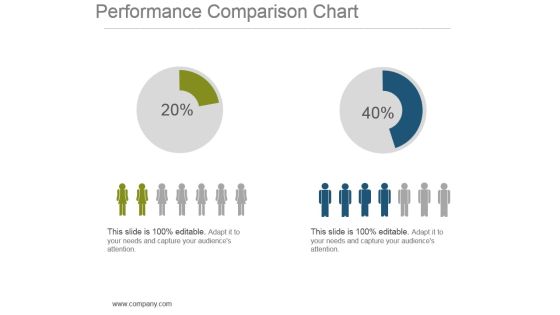
Performance Comparison Chart Powerpoint Show
This is a performance comparison chart powerpoint show. This is a two stage process. The stages in this process are finance, compare, strategy, management, planning.

5 Rules To Achieve Objectives Ppt PowerPoint Presentation Slide
This is a 5 rules to achieve objectives ppt powerpoint presentation slide. This is a one stage process. The stages in this process are business, arrows, target, strategy, success.

5 Arrow Goals And Objectives For Work Management Ppt PowerPoint Presentation Example File
This is a 5 arrow goals and objectives for work management ppt powerpoint presentation example file. This is a five stage process. The stages in this process are programmer for strategic objectives, systems and solutions, operation of solution, business plan, business marketing.

Key Solutions For Building A Successful Startup Ppt PowerPoint Presentation Infographics
This is a key solutions for building a successful startup ppt powerpoint presentation infographics. This is a six stage process. The stages in this process are key, arrows, security, business, marketing.

4 Means To Achieve Company Goal Ppt PowerPoint Presentation Clipart
This is a 4 means to achieve company goal ppt powerpoint presentation clipart. This is a four stage process. The stages in this process are arrows, targets, success, marketing, presentation.

Cause And Effect Relationship In Behavior With Pointers Ppt PowerPoint Presentation Shapes
This is a cause and effect relationship in behavior with pointers ppt powerpoint presentation shapes. This is a six stage process. The stages in this process are root cause materials, root cause methods, effects resultant problem, root cause people, root cause equipment.
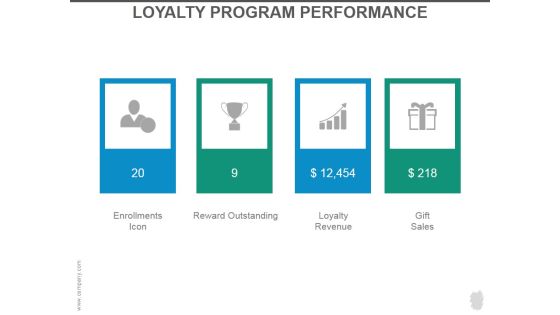
Loyalty Program Performance Ppt PowerPoint Presentation Slides
This is a loyalty program performance ppt powerpoint presentation slides. This is a four stage process. The stages in this process are enrollments icon, reward outstanding, loyalty revenue, gift sales.
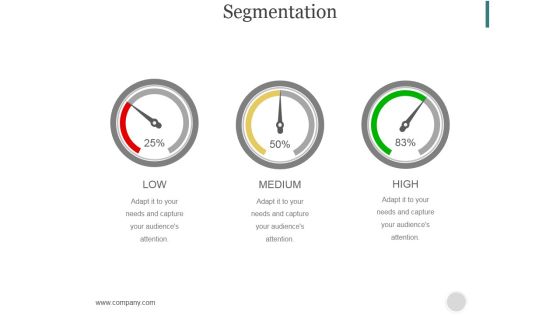
Segmentation Ppt PowerPoint Presentation Portfolio
This is a segmentation ppt powerpoint presentation portfolio. This is a three stage process. The stages in this process are low, medium, high.

Loyalty Program Performance Ppt PowerPoint Presentation Introduction
This is a loyalty program performance ppt powerpoint presentation introduction. This is a four stage process. The stages in this process are enrollments icon, reward outstanding, loyalty revenue, gift sales.
Key Financial Ratios Template 2 Ppt PowerPoint Presentation Icon Slide Download
This is a key financial ratios template 2 ppt powerpoint presentation icon slide download. This is a six stage process. The stages in this process are price to earnings, debt to equity ratio, current ratio, return on, equity, return on , assets, return on investment.
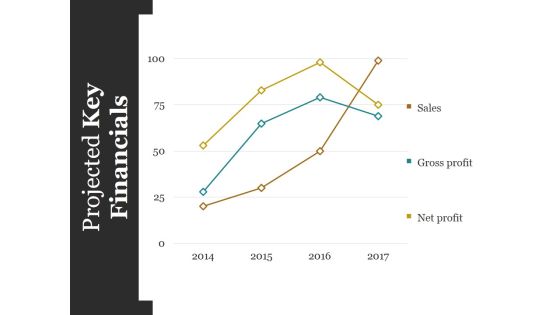
Projected Key Financials Template Ppt PowerPoint Presentation Styles Graphics Design
This is a projected key financials template ppt powerpoint presentation styles graphics design. This is a four stage process. The stages in this process are sales, gross profit, net profit.

Key Trends In The Industry Ppt PowerPoint Presentation Professional Backgrounds
This is a key trends in the industry ppt powerpoint presentation professional backgrounds. This is a six stage process. The stages in this process are focus, meet channels needs, differentiated capabilities, best cost, end customer centric.

Key Financial Ratios Ppt PowerPoint Presentation Outline Slide
This is a key financial ratios ppt powerpoint presentation outline slide. This is a eight stage process. The stages in this process are return on assets, return on equity, return on investment, current ratio, debt equity ratio.
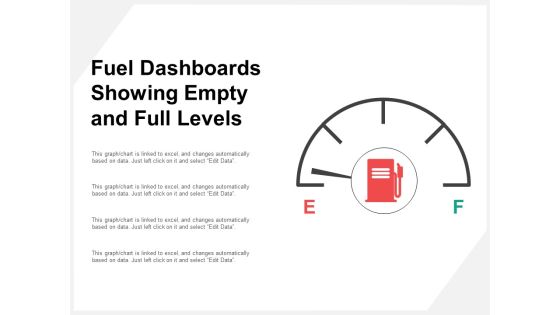
Fuel Dashboards Showing Empty And Full Levels Ppt PowerPoint Presentation Professional Slide Portrait
This is a fuel dashboards showing empty and full levels ppt powerpoint presentation professional slide portrait. This is a four stage process. The stages in this process are fuel gauge, gas gauge, fuel containers.
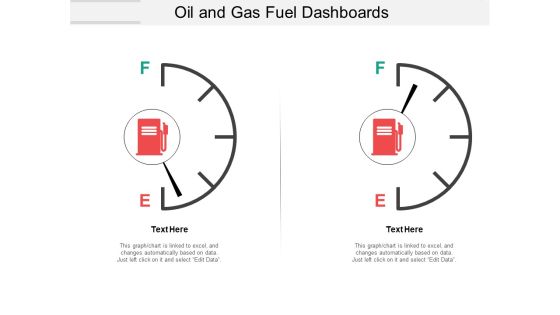
Oil And Gas Fuel Dashboards Ppt PowerPoint Presentation File Introduction
This is a oil and gas fuel dashboards ppt powerpoint presentation file introduction. This is a two stage process. The stages in this process are fuel gauge, gas gauge, fuel containers.
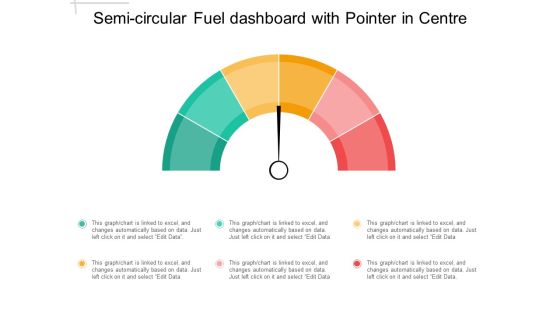
Semi Circular Fuel Dashboard With Pointer In Centre Ppt PowerPoint Presentation Outline Visuals
This is a semi circular fuel dashboard with pointer in centre ppt powerpoint presentation outline visuals. This is a three stage process. The stages in this process are fuel gauge, gas gauge, fuel containers.
Speed Dashboard With Arrows Percent Values And Icons Ppt PowerPoint Presentation Infographic Template Model
This is a speed dashboard with arrows percent values and icons ppt powerpoint presentation infographic template model. This is a two stage process. The stages in this process are fuel gauge, gas gauge, fuel containers.
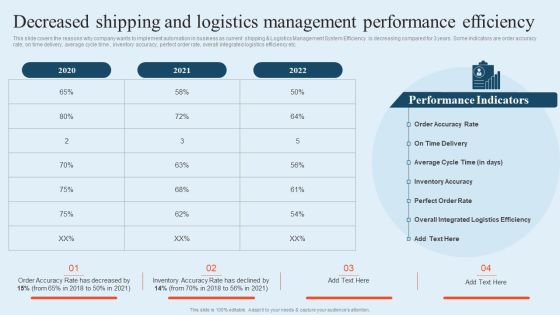
Integrating Logistics Automation Solution Decreased Shipping And Logistics Management Performance Ppt File Background Image PDF
This slide covers the reasons why company wants to implement automation in business as current shipping and Logistics Management System Efficiency is decreasing compared for 3 years. Some indicators are order accuracy rate, on time delivery, average cycle time , inventory accuracy, perfect order rate, overall integrated logistics efficiency etc. Here you can discover an assortment of the finest PowerPoint and Google Slides templates. With these templates, you can create presentations for a variety of purposes while simultaneously providing your audience with an eye-catching visual experience. Download Integrating Logistics Automation Solution Decreased Shipping And Logistics Management Performance Ppt File Background Image PDF to deliver an impeccable presentation. These templates will make your job of preparing presentations much quicker, yet still, maintain a high level of quality. Slidegeeks has experienced researchers who prepare these templates and write high-quality content for you. Later on, you can personalize the content by editing the Integrating Logistics Automation Solution Decreased Shipping And Logistics Management Performance Ppt File Background Image PDF.

Organizational Kpis Process Indicators Ppt Presentation
This is a organizational kpis process indicators ppt presentation. This is a five stage process. The stages in this process are people indicators, process indicators, system indicators, customer indicators, financial indicators, organizational kpis.
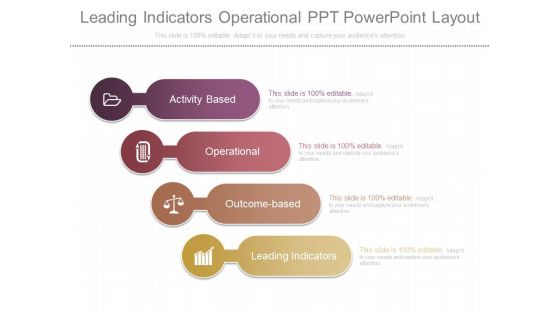
Leading Indicators Operational Ppt Powerpoint Layout
This is a leading indicators operational ppt powerpoint layout. This is a four stage process. The stages in this process are activity based, operational, outcome based, leading indicators.

Governance Key Performance Indicators Ppt Slides
This is a governance key performance indicators ppt slides. This is a five stage process. The stages in this process are performance, management, information, indicators, goals.

 Home
Home