Project Snapshot
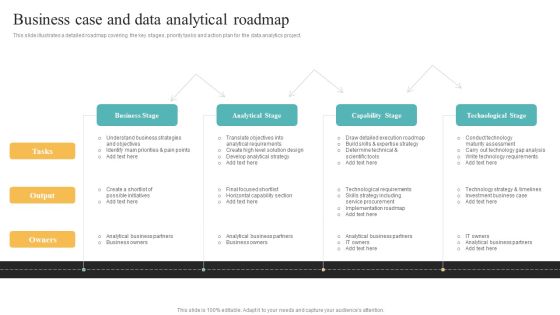
Transformation Toolkit Competitive Intelligence Information Analysis Business Case And Data Analytical Roadmap Microsoft PDF
This slide illustrates a detailed roadmap covering the key stages, priority tasks and action plan for the data analytics project. Get a simple yet stunning designed Transformation Toolkit Competitive Intelligence Information Analysis Business Case And Data Analytical Roadmap Microsoft PDF. It is the best one to establish the tone in your meetings. It is an excellent way to make your presentations highly effective. So, download this PPT today from Slidegeeks and see the positive impacts. Our easy to edit Transformation Toolkit Competitive Intelligence Information Analysis Business Case And Data Analytical Roadmap Microsoft PDF can be your go to option for all upcoming conferences and meetings. So, what are you waiting for Grab this template today.

Data Analytics Work Streams With Its Roles And Responsibilities Rules PDF
This slide highlights the key responsibilities, data work streams and. and data head roles for constructing data analytics project. Here you can discover an assortment of the finest PowerPoint and Google Slides templates. With these templates, you can create presentations for a variety of purposes while simultaneously providing your audience with an eye catching visual experience. Download Data Analytics Work Streams With Its Roles And Responsibilities Rules PDF to deliver an impeccable presentation. These templates will make your job of preparing presentations much quicker, yet still, maintain a high level of quality. Slidegeeks has experienced researchers who prepare these templates and write high quality content for you. Later on, you can personalize the content by editing the Data Analytics Work Streams With Its Roles And Responsibilities Rules PDF.
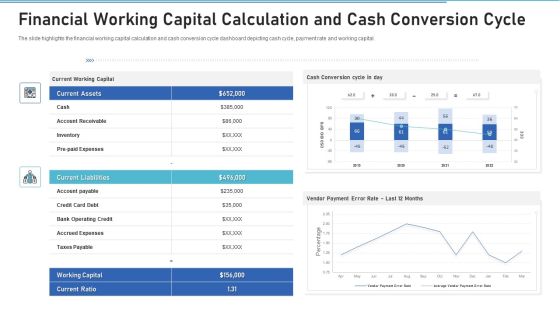
Financial Working Capital Calculation And Cash Conversion Cycle Mockup PDF
Showcasing this set of slides titled financial working capital calculation and cash conversion cycle mockup pdf. The topics addressed in these templates are capital, expenses, current liabilities. All the content presented in this PPT design is completely editable. Download it and make adjustments in color, background, font etc. as per your unique business setting.

Financial KPI Dashboard With Liquidity Ratio Analysis And Current Assets Breakdown Ideas PDF
This showcases KPI dashboard the can help organization to evaluate the financial performance and analyze the liquidity ratios. Its key components are vendor payment error rate, budget variance and cash conversion cycle. Showcasing this set of slides titled. The topics addressed in these templates are Quick Status, Workning Capital, Budget Variance. All the content presented in this PPT design is completely editable. Download it and make adjustments in color, background, font etc. as per your unique business setting.

Predictive Analytics Methods Predictive Analytics Models For Predictive Problems Graphics PDF
This slide depicts the overview of predictive analytics models, including the predictive problems they solve, such as binary results, number prediction, detecting odd behavior, and so on. The models include classification, forecasting, anomaly, cluster, and time series. The Predictive Analytics Methods Predictive Analytics Models For Predictive Problems Graphics PDF is a compilation of the most recent design trends as a series of slides. It is suitable for any subject or industry presentation, containing attractive visuals and photo spots for businesses to clearly express their messages. This template contains a variety of slides for the user to input data, such as structures to contrast two elements, bullet points, and slides for written information. Slidegeeks is prepared to create an impression.

Comprehensive Analysis Of Different Data Lineage Classification Data Lineage For Technical Professionals Summary PDF
This slide covers the importance of data lineage for technical experts, containing their requirements, projects, benefits, and type of data lineage. The advantages include lowering IT-related costs and required resources, enhancing productivity, and lowering the time to fix issues. Make sure to capture your audiences attention in your business displays with our gratis customizable Comprehensive Analysis Of Different Data Lineage Classification Data Lineage For Technical Professionals Summary PDF. These are great for business strategies, office conferences, capital raising or task suggestions. If you desire to acquire more customers for your tech business and ensure they stay satisfied, create your own sales presentation with these plain slides.

Bank Charge Off Forecast Report For Corporate Loan Diagrams PDF
This slide covers dashboard for bank charge-off analysis. It include KPIs such as predicted charge-off count, balance amount, original balance, average credit score, current interest rates, predicted charge off amount by state, etc. Showcasing this set of slides titled Bank Charge Off Forecast Report For Corporate Loan Diagrams PDF. The topics addressed in these templates are Balance Amount, Original Balance, Delinquency Past. All the content presented in this PPT design is completely editable. Download it and make adjustments in color, background, font etc. as per your unique business setting.

Information Technology Company Monthly Sales Forecast Dashboard Ppt Portfolio Images PDF
This slide shows the dashboard representing the data related to monthly sales forecast of an Information Technology Company. It shows information related to the net sales by customer, variance between actual and forecasted sales, total net sales, net sales per customer and total net sales per time for actual and forecasted sales. Pitch your topic with ease and precision using this Information Technology Company Monthly Sales Forecast Dashboard Ppt Portfolio Images PDF. This layout presents information on Total Net Sales, Actual vs Forecast, Net Sales Customer. It is also available for immediate download and adjustment. So, changes can be made in the color, design, graphics or any other component to create a unique layout.
Predictive Analytics Model Performance Tracking Dashboard Forward Looking Analysis IT Introduction PDF
This slide represents the predictive analytics model performance tracking dashboard, and it covers the details of total visitors, total buyers, total products added to the cart, filters by date and category, visitors to clients conversion rate, and so on.The Predictive Analytics Model Performance Tracking Dashboard Forward Looking Analysis IT Introduction PDF is a compilation of the most recent design trends as a series of slides. It is suitable for any subject or industry presentation, containing attractive visuals and photo spots for businesses to clearly express their messages. This template contains a variety of slides for the user to input data, such as structures to contrast two elements, bullet points, and slides for written information. Slidegeeks is prepared to create an impression.
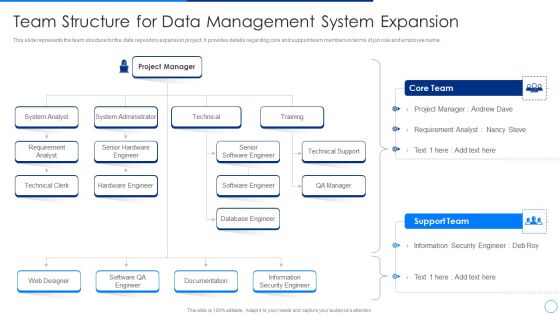
Scale Up Plan For Data Inventory Model Team Structure For Data Management System Expansion Slides PDF
This slide represents the team structure for the data repository expansion project. It provides details regarding core and support team members in terms of job role and employee name. Deliver an awe inspiring pitch with this creative scale up plan for data inventory model team structure for data management system expansion slides pdf bundle. Topics like analyst, technical, web designer, training, system administrator can be discussed with this completely editable template. It is available for immediate download depending on the needs and requirements of the user.

Developing Organization Primary Data Storage Action Plan Team Structure For Data Management System Expansion Portrait PDF
This slide represents the team structure for the data repository expansion project. It provides details regarding core and support team members in terms of job role and employee name. Deliver and pitch your topic in the best possible manner with this developing organization primary data storage action plan team structure for data management system expansion portrait pdf. Use them to share invaluable insights on technical, training, administrator, system, analyst and impress your audience. This template can be altered and modified as per your expectations. So, grab it now.

Predictive Analytics In The Age Of Big Data Introduction To Predictive Analytics Technology Background PDF
This slide represents the predictive analytics introduction that is used for forecasts action, behaviors, and trends using recent and past information. It performs the operations such as data mining, text analytics, statistics, and modeling on structured and unstructured data. Get a simple yet stunning designed Predictive Analytics In The Age Of Big Data Introduction To Predictive Analytics Technology Background PDF. It is the best one to establish the tone in your meetings. It is an excellent way to make your presentations highly effective. So, download this PPT today from Slidegeeks and see the positive impacts. Our easy to edit Predictive Analytics In The Age Of Big Data Introduction To Predictive Analytics Technology Background PDF can be your go to option for all upcoming conferences and meetings. So, what are you waiting for Grab this template today.

Information Technology Transformation Impact Of Using Advanced Inventory Management Methods Time Guidelines PDF
Mentioned slide shows monthly performance of current and forecasted performance of advanced product designing tools. Here the performance impact is measured by the number of prototypes developed and accepted. This is a information technology transformation impact of using advanced inventory management methods time guidelines pdf template with various stages. Focus and dispense information on four stages using this creative set, that comes with editable features. It contains large content boxes to add your information on topics like average manufacturing cycle, average order cycle time, inventory management. You can also showcase facts, figures, and other relevant content using this PPT layout. Grab it now.
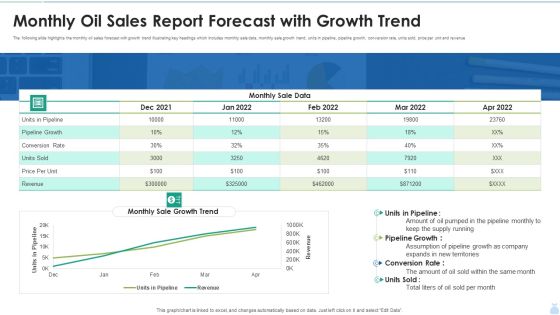
Monthly Oil Sales Report Forecast With Growth Trend Graphics PDF
The following slide highlights the monthly oil sales forecast with growth trend illustrating key headings which includes monthly sale data, monthly sale growth trend, units in pipeline, pipeline growth, conversion rate, units sold, price per unit and revenue. Showcasing this set of slides titled Monthly Oil Sales Report Forecast With Growth Trend Graphics PDF. The topics addressed in these templates are Pipeline Growth, Monthly Sale Data, Conversion Rate. All the content presented in this PPT design is completely editable. Download it and make adjustments in color, background, font etc. as per your unique business setting.

Predictive Data Model Predictive Analytics In Identifying Prospects Faster Pictures PDF
This slide depicts how predictive analytics help identifies prospects faster in the marketing industry. It can reduce the sales cycle by better forecasting visitors behavior as they progress through the funnel. Here you can discover an assortment of the finest PowerPoint and Google Slides templates. With these templates, you can create presentations for a variety of purposes while simultaneously providing your audience with an eye-catching visual experience. Download Predictive Data Model Predictive Analytics In Identifying Prospects Faster Pictures PDF to deliver an impeccable presentation. These templates will make your job of preparing presentations much quicker, yet still, maintain a high level of quality. Slidegeeks has experienced researchers who prepare these templates and write high-quality content for you. Later on, you can personalize the content by editing the Predictive Data Model Predictive Analytics In Identifying Prospects Faster Pictures PDF.

Predictive Data Model Uses Of Predictive Analytics Underwriting Clipart PDF
This slide represents the application of predictive analytics in underwriting by insurance companies. Predictive analytics help them identify future claims by analyzing policyholders historical data patterns and existing risk collection. Crafting an eye-catching presentation has never been more straightforward. Let your presentation shine with this tasteful yet straightforward Predictive Data Model Uses Of Predictive Analytics Underwriting Clipart PDF template. It offers a minimalistic and classy look that is great for making a statement. The colors have been employed intelligently to add a bit of playfulness while still remaining professional. Construct the ideal Predictive Data Model Uses Of Predictive Analytics Underwriting Clipart PDF that effortlessly grabs the attention of your audience Begin now and be certain to wow your customers

Predictive Analytics Methods Regression Model For Predictive Analytics Template PDF
This slide represents the regression model of predictive analytics that is most commonly used in statistical analysis. This model is used to identify patterns in large amounts of data and works by calculating a formula. Retrieve professionally designed Predictive Analytics Methods Regression Model For Predictive Analytics Template PDF to effectively convey your message and captivate your listeners. Save time by selecting pre made slideshows that are appropriate for various topics, from business to educational purposes. These themes come in many different styles, from creative to corporate, and all of them are easily adjustable and can be edited quickly. Access them as PowerPoint templates or as Google Slides themes. You do not have to go on a hunt for the perfect presentation because Slidegeeks got you covered from everywhere.

Comparative Analysis Of Big Bang And Trickle Data Migration Strategic Plan Designs PDF
The following slide depicts the comparison of two major data migration strategies to select the best approach and ensure timely completion of project. It also includes some parameters such as cost, duration, downtime, failures etc. Persuade your audience using this Comparative Analysis Of Big Bang And Trickle Data Migration Strategic Plan Designs PDF. This PPT design covers three stages, thus making it a great tool to use. It also caters to a variety of topics including Big Bang Data Migration, Tickle Data Migration, Cost. Download this PPT design now to present a convincing pitch that not only emphasizes the topic but also showcases your presentation skills.

International Apparel Manufacturing Report With Market Growth Forecast Inspiration PDF
This slide showcases global manufacturing insights for apparel market that can help organization to identify the growth in last financial years and make investment decisions on the basis of past data. It also showcases growth forecast for a period of next 6 financial years. Pitch your topic with ease and precision using this International Apparel Manufacturing Report With Market Growth Forecast Inspiration PDF. This layout presents information on Apparel Manufacturing, Market Growth Forecast, Billion. It is also available for immediate download and adjustment. So, changes can be made in the color, design, graphics or any other component to create a unique layout.

Business Intelligence Dashboards Presentation Slides
This is a business intelligence dashboards presentation slides. This is a seven stage process. The stages in this process are strategy formulation, planning, resource allocation, budgeting forecasting, reporting, monitoring, analysis, additional use of dashboards, most typical use of dashboard.
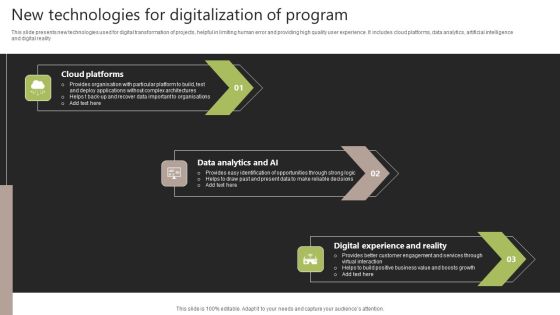
New Technologies For Digitalization Of Program Structure PDF
This slide presents new technologies used for digital transformation of projects, helpful in limiting human error and providing high quality user experience. It includes cloud platforms, data analytics, artificial intelligence and digital reality. Presenting New Technologies For Digitalization Of Program Structure PDF to dispense important information. This template comprises three stages. It also presents valuable insights into the topics including Cloud Platforms, Data Analytics AI, Digital Experience Reality. This is a completely customizable PowerPoint theme that can be put to use immediately. So, download it and address the topic impactfully.

Database Expansion And Optimization Team Structure For Data Management System Expansion Ppt Professional Example File
This slide represents the team structure for the data repository expansion project. It provides details regarding core and support team members in terms of job role and employee name. Deliver an awe inspiring pitch with this creative database expansion and optimization team structure for data management system expansion ppt professional example file bundle. Topics like analyst, technical, web designer, training, system administrator can be discussed with this completely editable template. It is available for immediate download depending on the needs and requirements of the user.

Tactical Plan For Upgrading DBMS Team Structure For Data Management System Expansion Template PDF
This slide represents the team structure for the data repository expansion project. It provides details regarding core and support team members in terms of job role and employee name. Deliver an awe inspiring pitch with this creative tactical plan for upgrading dbms team structure for data management system expansion template pdf bundle. Topics like analyst, technical, web designer, training, system administrator can be discussed with this completely editable template. It is available for immediate download depending on the needs and requirements of the user.
Horizontal Scaling Technique For Information Team Structure For Data Management System Expansion Icons PDF
This slide represents the team structure for the data repository expansion project. It provides details regarding core and support team members in terms of job role and employee name.Deliver and pitch your topic in the best possible manner with this Horizontal Scaling Technique For Information Team Structure For Data Management System Expansion Icons PDF Use them to share invaluable insights on Documentation Information, Security Engineer, Information Security Engineer and impress your audience. This template can be altered and modified as per your expectations. So, grab it now.

Key Components Of Business Structure Framework Ppt PowerPoint Presentation File Graphics PDF
Persuade your audience using this key components of business structure framework ppt powerpoint presentation file graphics pdf. This PPT design covers one stages, thus making it a great tool to use. It also caters to a variety of topics including stakeholders, policies, rules, regulations, capabilities, vision , strategies and tactics, organization, information, value streams, products and services, metrics and measures, decision and events, initiatives and projects, business architecture. Download this PPT design now to present a convincing pitch that not only emphasizes the topic but also showcases your presentation skills.
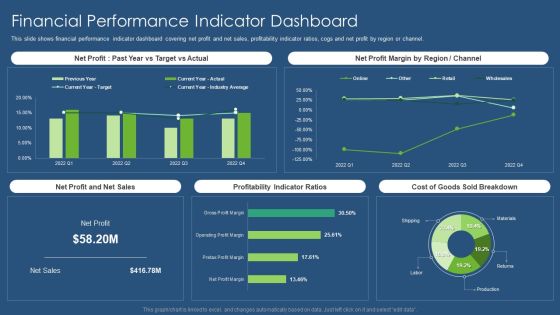
Sustainability Calculation With KPI Financial Performance Indicator Dashboard Infographics PDF Template PDF
This slide shows financial performance indicator dashboard covering net profit and net sales, profitability indicator ratios, cogs and net profit by region or channel. Deliver an awe inspiring pitch with this creative sustainability calculation with kpi financial performance indicator dashboard infographics pdf bundle. Topics like net profit margin, net profit and net sales, profitability indicator ratios, sold breakdown can be discussed with this completely editable template. It is available for immediate download depending on the needs and requirements of the user.

Toolkit For Data Science And Analytics Transition Key Training Skills For Data Analytics Program Template PDF
This slide highlights multiple skills required for conducting the data analytics project. It includes skills such as python, data mining skills, predictive modeling skills and many more. Coming up with a presentation necessitates that the majority of the effort goes into the content and the message you intend to convey. The visuals of a PowerPoint presentation can only be effective if it supplements and supports the story that is being told. Keeping this in mind our experts created Toolkit For Data Science And Analytics Transition Key Training Skills For Data Analytics Program Template PDF to reduce the time that goes into designing the presentation. This way, you can concentrate on the message while our designers take care of providing you with the right template for the situation.

Innovation Procedure For Online Business Team Members For Delivering Digital Transformation Rules PDF
Purpose of the following slide is to show the key team members responsible for delivering the digital transformation project, the following slide displays the team structure and the key roles and responsibilities of the team members. Deliver an awe inspiring pitch with this creative Innovation Procedure For Online Business Team Members For Delivering Digital Transformation Rules PDF bundle. Topics like Operational Leader Team, Vendor Management Team, Data And Analytics Leader And Team can be discussed with this completely editable template. It is available for immediate download depending on the needs and requirements of the user.
Ppt PowerPoint Slide Numbers A Procedure Or Timeline 2007 Templates
PPT powerpoint slide numbers a procedure or timeline 2007 Templates-This image represents the concept of structured analysis technique that employs a set of visual representations of the data that moves through the organization. This template is specifically designed to highlight you points. Organize your thoughts and illuminate your ideas accordingly-PPT powerpoint slide numbers a procedure or timeline 2007 Templates-Account, Arrow, Arrows, Away, Box, Business, Chart, Choice, Choose, Concept, Concepts, Consultation, Corporate, Design, Diagram, Direction, Elements, Flow, Follow, Follows, Future, Group, Grow, Increase, Lines, Many, Month, Move, Past, Period, Phase, Project, Report, Rise, Row, Step, Success, Text, Time, Timeline, Today, Up, Way, Ways, Work, Year

Comparative Assessment Of Software To Reduce Financial Challenges Icons PDF
Following slide demonstrates financial software comparative analysis conducted by managers to determine best tools for overcoming financial challenges. It includes key elements such as software solutions, financial pain points, rating, pricing and comments. Showcasing this set of slides titled Comparative Assessment Of Software To Reduce Financial Challenges Icons PDF. The topics addressed in these templates are Data Management, Financial Reporting, Financial Planning, Cash Flow Projection. All the content presented in this PPT design is completely editable. Download it and make adjustments in color, background, font etc. as per your unique business setting.

Five Kpis For Forecasting Stock Inventory And Management Pictures PDF
The following slide highlights some KPIs for better inventory management and accordingly plan production. It includes elements such as inventory turnover, average days to sell inventory, average inventory, inventory write-off, holding cost etc. Showcasing this set of slides titled Five Kpis For Forecasting Stock Inventory And Management Pictures PDF. The topics addressed in these templates are Holding Costs, Average Inventory, Inventory Turnover. All the content presented in this PPT design is completely editable. Download it and make adjustments in color, background, font etc. as per your unique business setting.

Toolkit For Data Science And Analytics Transition Data Analytics Business Case And Roadmap Designs PDF
This slide shows the business processes and key deliverables for developing the data analytics BI project. It starts with assessing and document the current state to identify priorities, analyze the process and ends at developing roadmap to achieve the outcomes. Get a simple yet stunning designed Toolkit For Data Science And Analytics Transition Data Analytics Business Case And Roadmap Designs PDF. It is the best one to establish the tone in your meetings. It is an excellent way to make your presentations highly effective. So, download this PPT today from Slidegeeks and see the positive impacts. Our easy to edit Toolkit For Data Science And Analytics Transition Data Analytics Business Case And Roadmap Designs PDF can be your go to option for all upcoming conferences and meetings. So, what are you waiting for Grab this template today.

Toolkit For Data Science And Analytics Transition Business Case And Data Analytical Roadmap Professional PDF
This slide illustrates a detailed roadmap covering the key stages, priority tasks and action plan for the data analytics project. Do you know about Slidesgeeks Toolkit For Data Science And Analytics Transition Business Case And Data Analytical Roadmap Professional PDF These are perfect for delivering any kind od presentation. Using it, create PowerPoint presentations that communicate your ideas and engage audiences. Save time and effort by using our pre designed presentation templates that are perfect for a wide range of topic. Our vast selection of designs covers a range of styles, from creative to business, and are all highly customizable and easy to edit. Download as a PowerPoint template or use them as Google Slides themes.

Forecast Analysis Technique IT Steps For Predictive Modeling Workflow Application Graphics PDF
This slide represents the steps for predictive analytics workflow application in industries, and it includes accessing and exploring information, pre-processing information, developing predictive models, and integrating analytics with systems. Slidegeeks is here to make your presentations a breeze with Forecast Analysis Technique IT Steps For Predictive Modeling Workflow Application Graphics PDF With our easy to use and customizable templates, you can focus on delivering your ideas rather than worrying about formatting. With a variety of designs to choose from, you are sure to find one that suits your needs. And with animations and unique photos, illustrations, and fonts, you can make your presentation pop. So whether you are giving a sales pitch or presenting to the board, make sure to check out Slidegeeks first.
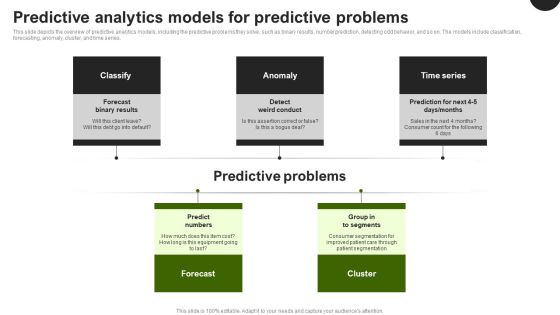
Predictive Analytics In The Age Of Big Data Predictive Analytics Models For Predictive Problems Rules PDF
This slide depicts the overview of predictive analytics models, including the predictive problems they solve, such as binary results, number prediction, detecting odd behavior, and so on. The models include classification, forecasting, anomaly, cluster, and time series. Presenting this PowerPoint presentation, titled Predictive Analytics In The Age Of Big Data Predictive Analytics Models For Predictive Problems Rules PDF, with topics curated by our researchers after extensive research. This editable presentation is available for immediate download and provides attractive features when used. Download now and captivate your audience. Presenting this Predictive Analytics In The Age Of Big Data Predictive Analytics Models For Predictive Problems Rules PDF. Our researchers have carefully researched and created these slides with all aspects taken into consideration. This is a completely customizable Predictive Analytics In The Age Of Big Data Predictive Analytics Models For Predictive Problems Rules PDF that is available for immediate downloading. Download now and make an impact on your audience. Highlight the attractive features available with our PPTs.
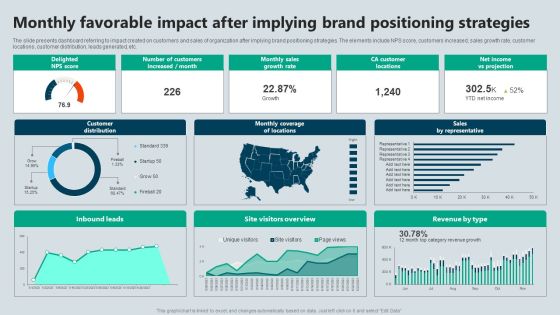
Monthly Favorable Impact After Implying Brand Positioning Strategies Demonstration PDF
The slide presents dashboard referring to impact created on customers and sales of organization after implying brand positioning strategies. The elements include NPS score, customers increased, sales growth rate, customer locations, customer distribution, leads generated, etc. Pitch your topic with ease and precision using this Monthly Favorable Impact After Implying Brand Positioning Strategies Demonstration PDF. This layout presents information on Strategies, Projection, Growth Rate. It is also available for immediate download and adjustment. So, changes can be made in the color, design, graphics or any other component to create a unique layout.

Forecast Analysis Technique IT Outliers Model For Predictive Modeling Elements PDF
This slide talks about the outliers model used for predictive analytics, including its use cases, impact and algorithm used in it, such as the generalized linear model for two values. This model helps banking, finance, and cyber security organizations to detect fraud and cyber crimes. Slidegeeks is here to make your presentations a breeze with Forecast Analysis Technique IT Outliers Model For Predictive Modeling Elements PDF With our easy to use and customizable templates, you can focus on delivering your ideas rather than worrying about formatting. With a variety of designs to choose from, you are sure to find one that suits your needs. And with animations and unique photos, illustrations, and fonts, you can make your presentation pop. So whether you are giving a sales pitch or presenting to the board, make sure to check out Slidegeeks first.

Supplier Association Management Techniques Supplier Relationship Management Roles Slides PDF
This slide covers SRM element people skills covering employees roles an responsibilities such as maintaining strategy, implement project, manage contract, operate solutions ect. This is a supplier association management techniques supplier performance management kpi dashboards guidelines pdf template with various stages. Focus and dispense information on six stages using this creative set, that comes with editable features. It contains large content boxes to add your information on topics like reduction in costs, increased efficiency, increase in profitability. You can also showcase facts, figures, and other relevant content using this PPT layout. Grab it now.
Forecasting And Managing Consumer Attrition For Business Advantage Dashboard Customer Purchase Tracking Repeat Structure PDF
The firm is looking forward to track customer experience by tracking various touchpoints in order to handle issues such customer churn. KPIs mentioned in the dashboard are measured regularly across the organization. Deliver and pitch your topic in the best possible manner with this forecasting and managing consumer attrition for business advantage dashboard customer purchase tracking repeat structure pdf. Use them to share invaluable insights on total repeat sales after coupon, total repeat sales after reward, total cart value per month and impress your audience. This template can be altered and modified as per your expectations. So, grab it now.
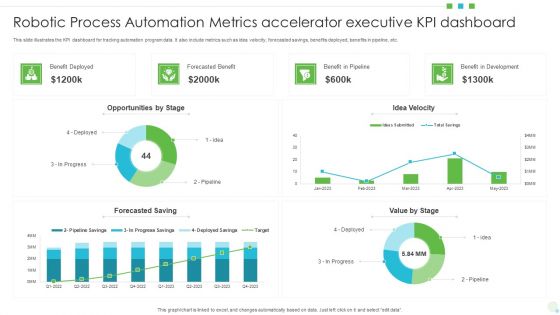
Robotic Process Automation Metrics Accelerator Executive KPI Dashboard Formats PDF
This slide illustrates the KPI dashboard for tracking automation program data. It also include metrics such as idea velocity, forecasted savings, benefits deployed, benefits in pipeline, etc. Showcasing this set of slides titled Robotic Process Automation Metrics Accelerator Executive KPI Dashboard Formats PDF. The topics addressed in these templates are Opportunities, Benefit In Development, Value. All the content presented in this PPT design is completely editable. Download it and make adjustments in color, background, font etc. as per your unique business setting.
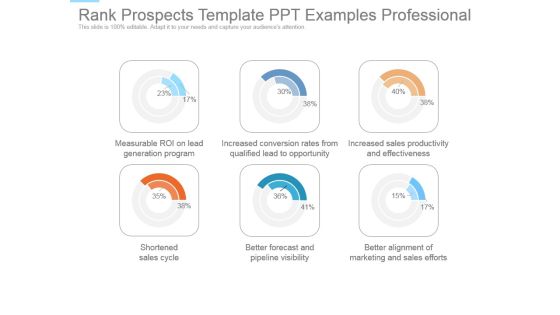
Rank Prospects Template Ppt Examples Professional
This is a rank prospects template ppt examples professional. This is a six stage process. The stages in this process are measurable roi on lead generation program, increased conversion rates from qualified lead to opportunity, increased sales productivity and effectiveness, shortened sales cycle, better forecast and pipeline visibility, better alignment of marketing and sales efforts.

Challenges With Traditional Manufacturing System Formats PDF
This slide represents the challenges with traditional manufacturing systems and it includes the limitation on customization, supply chain disruptions, labour shortage, worker safety, and longer production time. These challenges cause a delay in projects. The Challenges With Traditional Manufacturing System Formats PDF is a compilation of the most recent design trends as a series of slides. It is suitable for any subject or industry presentation, containing attractive visuals and photo spots for businesses to clearly express their messages. This template contains a variety of slides for the user to input data, such as structures to contrast two elements, bullet points, and slides for written information. Slidegeeks is prepared to create an impression.

Predictive Data Model Uses Of Predictive Analytics Credit Information PDF
This slide describes the usage of predictive analytics in banking and other financial institutions for credit purposes. It is used to calculate the credit score of a person or organization and to ensure that borrower doesnot fail to return the loan. If you are looking for a format to display your unique thoughts, then the professionally designed Predictive Data Model Uses Of Predictive Analytics Credit Information PDF is the one for you. You can use it as a Google Slides template or a PowerPoint template. Incorporate impressive visuals, symbols, images, and other charts. Modify or reorganize the text boxes as you desire. Experiment with shade schemes and font pairings. Alter, share or cooperate with other people on your work. Download Predictive Data Model Uses Of Predictive Analytics Credit Information PDF and find out how to give a successful presentation. Present a perfect display to your team and make your presentation unforgettable.

International Sales Performance Dashboard With Regional Market Report Inspiration PDF
This slide showcases global report that can help organization to estimate forecast of the sales and identify yearly revenue generated. Its key elements are yearly sales, market share, regional outlook, competitor analysis and geographical sales. Pitch your topic with ease and precision using this International Sales Performance Dashboard With Regional Market Report Inspiration PDF. This layout presents information on Regional Outlook, Sales And Forecast, Market Share Overview. It is also available for immediate download and adjustment. So, changes can be made in the color, design, graphics or any other component to create a unique layout.

Business Demand Predictive Dashboard Icon Ppt Summary Graphics Pictures PDF
Presenting business demand predictive dashboard icon ppt summary graphics pictures pdf to dispense important information. This template comprises one stages. It also presents valuable insights into the topics including business demand predictive dashboard icon. This is a completely customizable PowerPoint theme that can be put to use immediately. So, download it and address the topic impactfully.
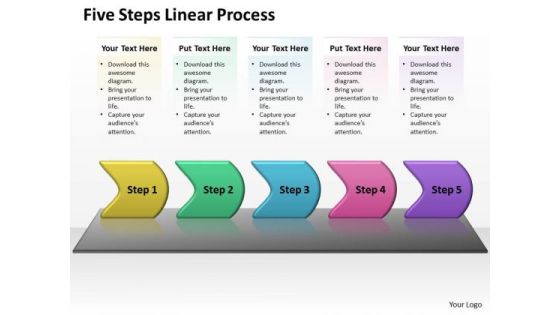
Usa Ppt Theme Five Steps Working With Slide Numbers Linear Process 1 Design
USA PPT Theme five steps working with slide numbers linear process 1 design-This image has been professionally designed to emphasize the paths through which the data moves, and the processes that produce, use, and transform data. Deliver amazing presentations to mesmerize your audience.-USA PPT Theme five steps working with slide numbers linear process 1 design-Account, Arrow, Arrows, Away, Box, Business, Chart, Choice, Choose, Concept, Concepts, Consultation, Corporate, Design, Diagram, Direction, Elements, Flow, Follow, Follows, Future, Group, Grow, Increase, Lines, Many, Month, Move, Past, Period, Phase, Project, Report, Rise, Row, Step, Success
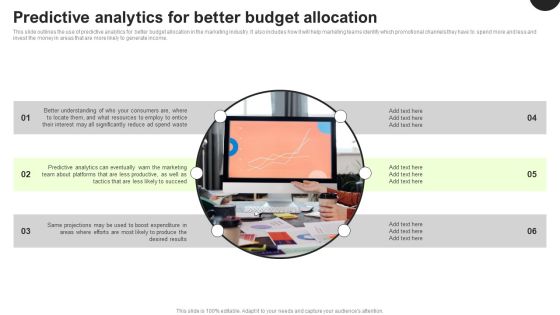
Predictive Analytics In The Age Of Big Data Predictive Analytics For Better Budget Allocation Inspiration PDF
This slide outlines the use of predictive analytics for better budget allocation in the marketing industry. It also includes how it will help marketing teams identify which promotional channels they have to spend more and less and invest the money in areas that are more likely to generate income. Make sure to capture your audiences attention in your business displays with our gratis customizable Predictive Analytics In The Age Of Big Data Predictive Analytics For Better Budget Allocation Inspiration PDF. These are great for business strategies, office conferences, capital raising or task suggestions. If you desire to acquire more customers for your tech business and ensure they stay satisfied, create your own sales presentation with these plain slides.

Forecast Analysis Technique IT Time Series Model Of Predictive Modeling Graphics PDF
This slide talks about the time series model of predictive analytics that makes future outcome predictions by taking time as input. This model can be implemented in customer support services and healthcare industries to predict the expected number of queries or patients. This modern and well arranged Forecast Analysis Technique IT Time Series Model Of Predictive Modeling Graphics PDF provides lots of creative possibilities. It is very simple to customize and edit with the Powerpoint Software. Just drag and drop your pictures into the shapes. All facets of this template can be edited with Powerpoint no extra software is necessary. Add your own material, put your images in the places assigned for them, adjust the colors, and then you can show your slides to the world, with an animated slide included.
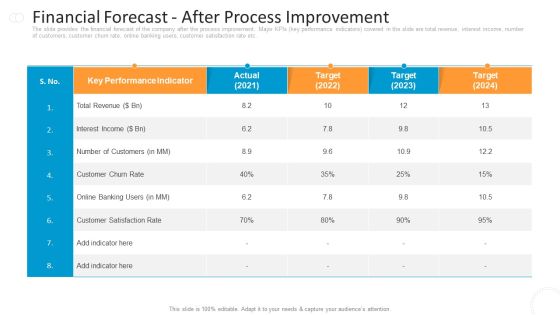
Financial Forecast After Process Improvement Pictures PDF
Deliver and pitch your topic in the best possible manner with this financial forecast after process improvement pictures pdf. Use them to share invaluable insights on financial forecast after process improvement and impress your audience. This template can be altered and modified as per your expectations. So, grab it now.

IT Security Analysis To Prevent Insider Threats Infographics PDF
This slide covers the data on the security by using the technologies to protect the data from the insider threats. It includes the analysis with risk model, CWE, OWASP, SQL injection, misconfiguration, etc. Presenting IT Security Analysis To Prevent Insider Threats Infographics PDF to dispense important information. This template comprises nine stages. It also presents valuable insights into the topics including Security Project, Application, Risk Model. This is a completely customizable PowerPoint theme that can be put to use immediately. So, download it and address the topic impactfully.

Quantitative Data Analysis Icon For Predictive Modelling Ppt Ideas Images PDF
Presenting Quantitative Data Analysis Icon For Predictive Modelling Ppt Ideas Images PDF to dispense important information. This template comprises one stages. It also presents valuable insights into the topics including Quantitative Data, Analysis Icon, Predictive Modelling. This is a completely customizable PowerPoint theme that can be put to use immediately. So, download it and address the topic impactfully.

Organization Compliance Metrics Pictures PDF
This slide covers the metrics that measure what you are doing with the awareness project, exactly how you will train and how. Such metrics are of particular importance for purposes of compliance and monitoring.Presenting organization compliance metrics pictures pdf. to provide visual cues and insights. Share and navigate important information on one stage that need your due attention. This template can be used to pitch topics like training completion, communication methods. In addtion, this PPT design contains high resolution images, graphics, etc, that are easily editable and available for immediate download.
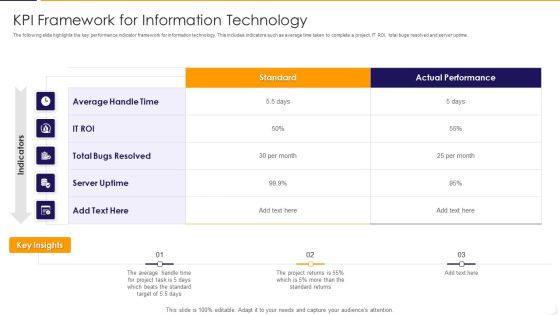
KPI Framework For Information Technology Ppt PowerPoint Presentation Gallery Clipart Images PDF
The following slide highlights the key performance indicator framework for information technology. This includes indicators such as average time taken to complete a project, IT ROI, total bugs resolved and server uptime. Showcasing this set of slides titled kpi framework for information technology ppt powerpoint presentation gallery clipart images pdf The topics addressed in these templates are average, target, performance All the content presented in this PPT design is completely editable. Download it and make adjustments in color, background, font etc. as per your unique business setting.

Cash Flow Forecasting To Estimate Future Inflows And Outflows Ppt PowerPoint Presentation File Pictures PDF
This slide provides glimpse about cashflow forecasting that can help business to evaluate future cash inflows by adopting selected strategic option. It includes cash sales, credit sales, raw material cost, labor charges, other costs, etc. Create an editable Cash Flow Forecasting To Estimate Future Inflows And Outflows Ppt PowerPoint Presentation File Pictures PDF that communicates your idea and engages your audience. Whether youre presenting a business or an educational presentation, pre designed presentation templates help save time. Cash Flow Forecasting To Estimate Future Inflows And Outflows Ppt PowerPoint Presentation File Pictures PDF is highly customizable and very easy to edit, covering many different styles from creative to business presentations. Slidegeeks has creative team members who have crafted amazing templates. So, go and get them without any delay.

Create Timetable And Financial Forecast Bundle Cost Estimate By Wbs Element Task Pictures PDF
Deliver an awe inspiring pitch with this creative create timetable and financial forecast bundle cost estimate by wbs element task pictures pdf bundle. Topics like development, technical documentation, business analyst can be discussed with this completely editable template. It is available for immediate download depending on the needs and requirements of the user.

Dashboards Showing Consultancy Company Performance With Key Metrics Microsoft PDF
This slide shows the dashboard related to consultancy company performance which includes budget preparation, sales and goals. Company profits and goals etc.Presenting dashboards showing consultancy company performance with key metrics microsoft pdf to provide visual cues and insights. Share and navigate important information on four stages that need your due attention. This template can be used to pitch topics like dashboards showing consultancy company performance with key metrics. In addtion, this PPT design contains high resolution images, graphics, etc, that are easily editable and available for immediate download.

Predictive Data Model Predictive Analytics Models For Predictive Problems Structure PDF
This slide depicts the overview of predictive analytics models, including the predictive problems they solve, such as binary results, number prediction, detecting odd behavior, and so on. The models include classification, forecasting, anomaly, cluster, and time series. Boost your pitch with our creative Predictive Data Model Predictive Analytics Models For Predictive Problems Structure PDF. Deliver an awe-inspiring pitch that will mesmerize everyone. Using these presentation templates you will surely catch everyones attention. You can browse the ppts collection on our website. We have researchers who are experts at creating the right content for the templates. So you do not have to invest time in any additional work. Just grab the template now and use them.

Requirement Assessment Of 3 Vendor Comparison Ppt Infographic Template Layouts PDF
The following slide showcases requirement evaluation of vendors to identify best vendor for a project. The requirements included are flexibility, incentive compensation, integrated reporting, ease of data integration, size of client base and approximate revenue. Showcasing this set of slides titled Requirement Assessment Of 3 Vendor Comparison Ppt Infographic Template Layouts PDF. The topics addressed in these templates are High Level Requirement, Supplier, Flexibility. All the content presented in this PPT design is completely editable. Download it and make adjustments in color, background, font etc. as per your unique business setting.

Predictive Analytics In The Age Of Big Data Uses Of Predictive Analytics Credit Ideas PDF
This slide describes the usage of predictive analytics in banking and other financial institutions for credit purposes. It is used to calculate the credit score of a person or organization and to ensure that borrower doesnot fail to return the loan. Present like a pro with Predictive Analytics In The Age Of Big Data Uses Of Predictive Analytics Credit Ideas PDF Create beautiful presentations together with your team, using our easy to use presentation slides. Share your ideas in real time and make changes on the fly by downloading our templates. So whether you are in the office, on the go, or in a remote location, you can stay in sync with your team and present your ideas with confidence. With Slidegeeks presentation got a whole lot easier. Grab these presentations today.
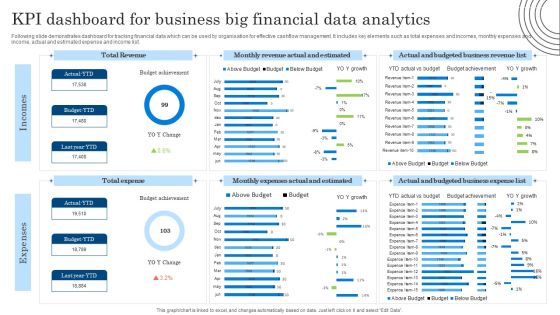
KPI Dashboard For Business Big Financial Data Analytics Diagrams PDF
Following slide demonstrates dashboard for tracking financial data which can be used by organisation for effective cashflow management. It includes key elements such as total expenses and incomes, monthly expenses and income, actual and estimated expense and income list. Showcasing this set of slides titled KPI Dashboard For Business Big Financial Data Analytics Diagrams PDF. The topics addressed in these templates are KPI Dashboard, Business Big Financial, Data Analytics. All the content presented in this PPT design is completely editable. Download it and make adjustments in color, background, font etc. as per your unique business setting.

 Home
Home