Project Snapshot

Call Center Process Key Performance Indicator Dashboard Mockup PDF
This slide showcases call center process measurements and key performance indicators so managers and teams can keep track of and improve performance . It includes received calls, calculating speed of answering calls , ended calls before starting conversations , average calls per minute etc. Showcasing this set of slides titled Call Center Process Key Performance Indicator Dashboard Mockup PDF. The topics addressed in these templates are Received Calls, Conversation, Abandon Rate. All the content presented in this PPT design is completely editable. Download it and make adjustments in color, background, font etc. as per your unique business setting.

Net Present Value Method Ppt PowerPoint Presentation Pictures Background
This is a net present value method ppt powerpoint presentation pictures background. This is a one stage process. The stages in this process are calculation, accept the project, reject the project, be indifferent, business.

Essential Key Performance Indicators In Investment Summary Demonstration PDF
The following slide showcases dashboard of portfolio summary with important key performance indicators to provide an oversight of the project. Key metrics covered are cost, work, variance, active risk and issues. Showcasing this set of slides titled Essential Key Performance Indicators In Investment Summary Demonstration PDF. The topics addressed in these templates are Cost, Active Risks, Projects. All the content presented in this PPT design is completely editable. Download it and make adjustments in color, background, font etc. as per your unique business setting.

Cash Conversion Cycle Diagram Example Of Ppt Presentation
This is a cash conversion cycle diagram example of ppt presentation. This is a four stage process. The stages in this process are order to cash, forecast to fulfill, purchase to pay, cash conversion cycle.

Internal Rate Of Return Template 2 Ppt PowerPoint Presentation Styles Graphics Pictures
This is a internal rate of return template 2 ppt powerpoint presentation styles graphics pictures. This is a two stage process. The stages in this process are accept the project, reject the project, be indifferent, icons, strategy.

Kids Standing Together Holding Hands School Banner Ppt PowerPoint Presentation Layouts Pictures
This is a kids standing together holding hands school banner ppt powerpoint presentation layouts pictures. This is a six stage process. The stages in this process are sales process school banner project, school poster project.

Asset Usage And Monitoring With Resource Management Plan Optimize Resource Utilization Clipart PDF
This slides shows the optimize resource utilization scenario output which includes key metrics, included projects, excluded projects, optimizing suggestions, etc.Deliver and pitch your topic in the best possible manner with this asset usage and monitoring with resource management plan optimize resource utilization clipart pdf Use them to share invaluable insights on included projects, excluded projects, optimizing suggestions and impress your audience. This template can be altered and modified as per your expectations. So, grab it now.

Critical Drivers Of Organizational Success Example Ppt Slide Template
This is a critical drivers of organizational success example ppt slide template. This is a seven stage process. The stages in this process are sale, productivity, expense control, cash flow, regulatory compliance, customer service, developmental projects.

Information Studies Dashboard For Data Science Implementation Structure PDF
This slide depicts the dashboard for data integration in the business, and it is showing real time details about expenses, profits, margins percentage, and new addition projects. Deliver an awe inspiring pitch with this creative Information Studies Dashboard For Data Science Implementation Structure PDF bundle. Topics like New Additions Projects, Margin, Expenses can be discussed with this completely editable template. It is available for immediate download depending on the needs and requirements of the user.

Sustainability Calculation With KPI Customer Satisfaction Dashboard Customer Ppt PowerPoint Presentation Gallery Smartart PDF
Following slide shows customer satisfaction dashboard covering net promoter score. It also includes customer retention metrics with a 12 month format. Deliver and pitch your topic in the best possible manner with this sustainability calculation with kpi customer satisfaction dashboard customer ppt powerpoint presentation gallery smartart pdf. Use them to share invaluable insights on customer satisfaction dashboard and impress your audience. This template can be altered and modified as per your expectations. So, grab it now.
Sustainability Calculation With KPI Effective Rate Metrics By Customer And Offering Ppt PowerPoint Presentation Icon Files PDF
This slide covers effective rate metrics. It shows over year over comparison of effective rate per customer as well as effective rate per offering. Deliver an awe inspiring pitch with this creative sustainability calculation with kpi effective rate metrics by customer and offering ppt powerpoint presentation icon files pdf bundle. Topics like effective rate metrics by customer and offering can be discussed with this completely editable template. It is available for immediate download depending on the needs and requirements of the user.
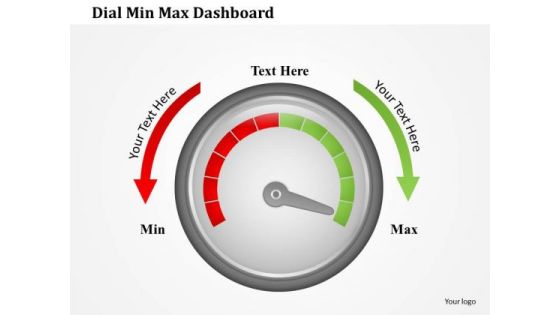
Business Framework Dial Min Max Dashboard PowerPoint Presentation
This professional power point template slide has been crafted with graphic of two funnels. These funnels are used to show any data calculation or process flow. Use this PPT for your business presentation and become a professional presenter.

Business To Business Model Flat Pricing Model Ppt File Grid PDF
This slide shows business to business B2B flat pricing model. It provides information about unlimited projects, company dashboard, unlimited users, team projects, storage space, unlimited clients, etc. Persuade your audience using this Business To Business Model Flat Pricing Model Ppt File Grid PDF. This PPT design covers six stages, thus making it a great tool to use. It also caters to a variety of topics including Unlimited Project, Unlimited Users, Team Projects. Download this PPT design now to present a convincing pitch that not only emphasizes the topic but also showcases your presentation skills.

KPI Dashboard To Track Effectiveness Of Real Estate Business Performance Guidelines PDF
The following slide exhibits key performance indicator KPI dashboard which can be used to measure the financial performance of the real estate company. It covers various kpis such as sales vs target per agent, top 10 projects, top 5 agencies etc.Deliver an awe inspiring pitch with this creative KPI Dashboard To Track Effectiveness Of Real Estate Business Performance Guidelines PDF bundle. Topics like Top Projects, Sales Amount, Sales Amount can be discussed with this completely editable template. It is available for immediate download depending on the needs and requirements of the user.
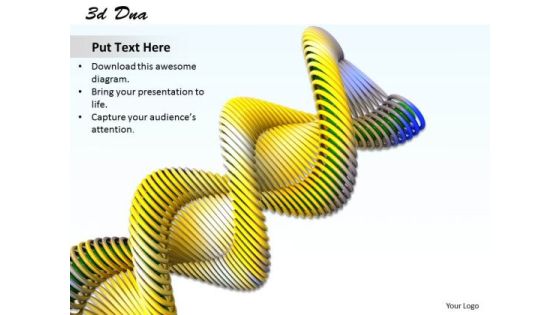
Stock Photo 3d Dna With Yellow Color For Medical Theme PowerPoint Slide
This professional image is designed with graphics of DNA structure. Download this image for medical presentations. This image can be used in medical and science projects.

Dashboard For Data Analytics Implementation Ppt Model Files PDF
This slide depicts the dashboard for data integration in the business, and it is showing real time details about expenses, profits, margins percentage, and new addition projects. Deliver and pitch your topic in the best possible manner with this dashboard for data analytics implementation ppt model files pdf. Use them to share invaluable insights on expenses, profits, analytics, data and impress your audience. This template can be altered and modified as per your expectations. So, grab it now.

Submit Data Collection Request Ppt Design Templates
This is a submit data collection request ppt design templates. This is a thirteen stage process. The stages in this process are refine data collection approach and schedule, submit data collection request, organize and kick of projects, currently being used for future use metric, critical reporting requirements definition, meet with and interview president and executive leadership, currents state assessment gap and analysis and process capability, conduct key stakeholders alignment meeting, conduct vision workshop with executive leadership, information and data assessment, internal reporting requirements, future state capability vision, implementation considerations and high level plan.

News Paper Ppt PowerPoint Presentation Pictures Information
This is a news paper ppt powerpoint presentation pictures information. This is a three stage process. The stages in this process are newspaper, server, computer, project, business.

Data Assimilation Business Intelligence KPI Dashboard Score Ppt Graphics PDF
Deliver and pitch your topic in the best possible manner with this data assimilation business intelligence kpi dashboard score ppt graphics pdf. Use them to share invaluable insights on revenue, projections, locations, growth, sales and impress your audience. This template can be altered and modified as per your expectations. So, grab it now.

Key Business Metrics To Track Ecommerce User On Boarding Success Pictures PDF
This slide signifies the key organisation metric to measure ecommerce onboading plan. It covers information about kpis, key description, projection, actual and variance. Pitch your topic with ease and precision using this Key Business Metrics To Track Ecommerce User On Boarding Success Pictures PDF. This layout presents information on Key Description, Projection, Variance. It is also available for immediate download and adjustment. So, changes can be made in the color, design, graphics or any other component to create a unique layout.

Predictive Analytics Steps Ppt PowerPoint Presentation Styles Guidelines
This is a predictive analytics steps ppt powerpoint presentation styles guidelines. This is a six stage process. The stages in this process are define project, data collection, data analysis, statistics, stages, benefits.
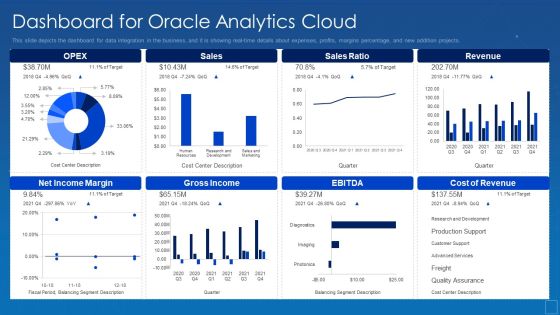
Oracle Cloud Data Analytics Administration IT Dashboard For Oracle Analytics Cloud Sample PDF
This slide depicts the dashboard for data integration in the business, and it is showing real-time details about expenses, profits, margins percentage, and new addition projects. Deliver an awe inspiring pitch with this creative oracle cloud data analytics administration it dashboard for oracle analytics cloud sample pdf bundle. Topics like dashboard for oracle analytics cloud can be discussed with this completely editable template. It is available for immediate download depending on the needs and requirements of the user.

Customer Relationship Management Dashboard CRM Application Dashboard Risk Guidelines PDF
Deliver an awe inspiring pitch with this creative customer relationship management dashboard crm application dashboard risk guidelines pdf bundle. Topics like about to renew, accounts at risk, ongoing project, ongoing accounts can be discussed with this completely editable template. It is available for immediate download depending on the needs and requirements of the user.

Data Mining Implementation Dashboard For Data Mining Implementation Pictures PDF
This slide depicts the dashboard for data integration in the business, and it is showing real-time details about expenses, profits, margins percentage, and new addition projects.Deliver and pitch your topic in the best possible manner with this data mining implementation dashboard for data mining implementation pictures pdf Use them to share invaluable insights on dashboard for data mining implementation and impress your audience. This template can be altered and modified as per your expectations. So, grab it now.

Predictive Analytics Steps Ppt PowerPoint Presentation Portfolio Template
This is a predictive analytics steps ppt powerpoint presentation portfolio template. This is a six stage process. The stages in this process are define project, benefits, stages, statistics, data analysis.

State Location On Africa Map With Percentage Data Powerpoint Slides
This PowerPoint template displays state location on Africa map with percentage data. This Map template can be used for annual growth report. This slide can also be used by school students for educational projects.
Map Of Czech With Percentage Data And Icons Powerpoint Slides
This PowerPoint template displays map of Czech with percentage data and icons. This Map template can be used for annual growth report. This slide can also be used by school students for educational projects.

Real Estate Outlook Ppt PowerPoint Presentation Layout
This is a real estate outlook ppt powerpoint presentation layout. This is a one stage process. The stages in this process are business, marketing, management, real estate, innovation.
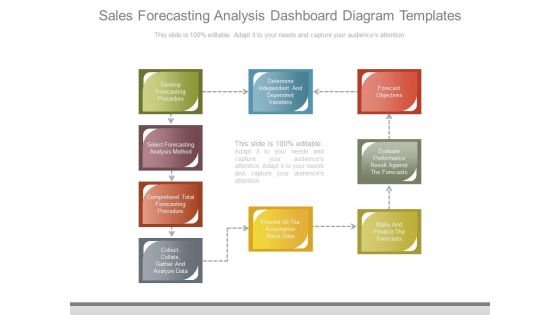
Sales Forecasting Analysis Dashboard Diagram Templates
This is a sales forecasting analysis dashboard diagram templates. This is a nine stage process. The stages in this process are develop forecasting procedure, select forecasting analysis method, comprehend total forecasting procedure, collect collate gather and analyze data, determine independent and dependent variables, present all the assumption about data, forecast objectives, evaluate performance result against the forecasts, make and finalize the forecasts.

KPI Dashboard To Measure Sales Divisional Strategy Growth Formats PDF
This slide signifies the key performance indicator to measure sales department strategy growth. It covers information regarding to the units sold, top 10 project, target per agent. Showcasing this set of slides titled KPI Dashboard To Measure Sales Divisional Strategy Growth Formats PDF. The topics addressed in these templates are Sales, Target. All the content presented in this PPT design is completely editable. Download it and make adjustments in color, background, font etc. as per your unique business setting.

Stock Photo Molecules Cube PowerPoint Slide
This professional image is designed for medical presentations. This image is designed with graphics of molecules cubes. Medical students can use this image slide in their projects. Grab the attention of your team with this image slide.

Professional Sales Planning Cycle Diagram Ppt Slide Template
This is a professional sales planning cycle diagram ppt slide template. This is a six stage process. The stages in this process are establish purpose, scope the project, strategy development, sales planning, design survey strategy, evaluate the products, operational planning.

Predictive Data Model Predictive Analytics Forecast Model Introduction Themes PDF
This slide outlines the introduction of the forecast model used for predictive analytics to make the metric value predictions for business processes. This model uses the Prophet algorithm to make predictions and includes its use cases in the manufacturing industry. The best PPT templates are a great way to save time, energy, and resources. Slidegeeks have 100 percent editable powerpoint slides making them incredibly versatile. With these quality presentation templates, you can create a captivating and memorable presentation by combining visually appealing slides and effectively communicating your message. Download Predictive Data Model Predictive Analytics Forecast Model Introduction Themes PDF from Slidegeeks and deliver a wonderful presentation.
Technology Upgradation Action Plan Dashboard For Issues Tracking Ppt Portfolio Graphics Pictures PDF
This slide shows the issues tracking the dashboard for the business transition project. It provides details of multiple issues faced by users to keep records for effective management of the project. Deliver an awe inspiring pitch with this creative Technology Upgradation Action Plan Dashboard For Issues Tracking Ppt Portfolio Graphics Pictures PDF bundle. Topics like Issues Failed Verification, Immediate Issues, High Churn Issues, Suspect Requirements, Failed Test Runs can be discussed with this completely editable template. It is available for immediate download depending on the needs and requirements of the user.

Customer Acquisition Management Ppt PowerPoint Presentation Files
This is a customer acquisition management ppt powerpoint presentation files. This is a four stage process. The stages in this process are build connections, assess specific needs of project, execute campaigns, response management.
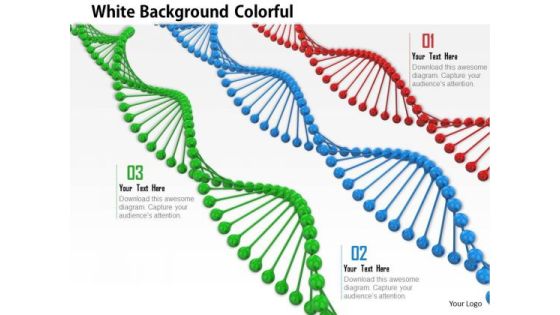
Stock Photo Green Blue Red Dna Strands PowerPoint Slide
This professional image is designed for medical presentations. This image is designed with green blue red DNA strands. Medical students can use this image slide in their projects. Grab the attention of your team with this image slide.
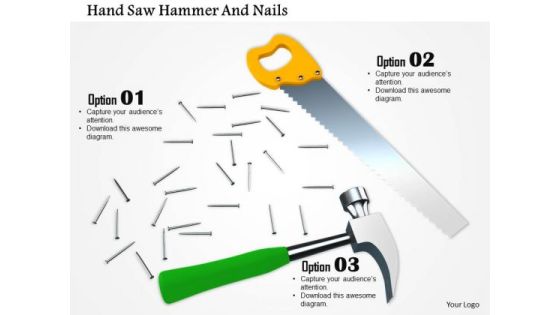
Stock Photo Illustration Of Handsaw Hammer And Nails PowerPoint Slide
Create dynamic presentations with this professional image of handsaw, hammer and nails. This image may be used to explain importance of tools for industrial project. Add this image in your presentations to visually support your content and express your thoughts.
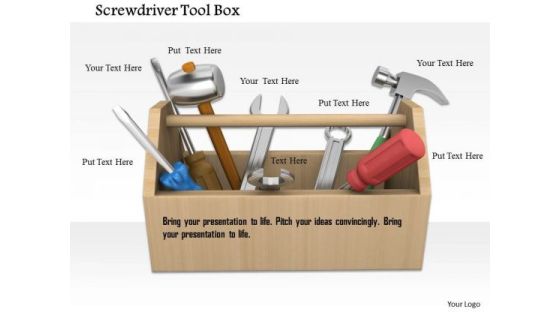
Stock Photo Illustration Of Mechanic Tools Box PowerPoint Slide
Create dynamic presentations with this image of mechanic tool box. This image may be used to explain importance of tools for industrial project. Add this image in your presentations to visually support your content and express your thoughts.

Stock Photo Illustration Of Toolkit With Tools PowerPoint Slide
Create dynamic presentations with this image of mechanic tool box. This image may be used to explain importance of tools for industrial project. Add this image in your presentations to visually support your content and express your thoughts.

Stock Photo Image Of Handsaw Hammer And Nails PowerPoint Slide
Create dynamic presentations with this professional image of handsaw, hammer and nails. This image may be used to explain importance of tools for industrial project. Add this image in your presentations to visually support your content and express your thoughts.

Stock Photo Service Tools Screwdriver And Hammer PowerPoint Slide
Create dynamic presentations with this professional image of tools screwdriver and hammer. This image may be used to explain importance of tools for industrial project. Add this image in your presentations to visually support your content and express your thoughts.

0814 Stock Photo Illustration Of Bolts And Nuts PowerPoint Slide
Create dynamic presentations with this professional image displaying bolts and nuts. This image may be used to explain importance of tools for industrial project. Add this image in your presentations to visually support your content and express your thoughts.

0814 Stock Photo Illustration Of Red Tool Box PowerPoint Slide
Create dynamic presentations with this professional image red tool box. This image may be used to explain importance of tools for industrial project. Add this image in your presentations to visually support your content and express your thoughts.

0814 Stock Photo Service Tools In Blue Box PowerPoint Slide
Create dynamic presentations with this professional image blue tool box. This image may be used to explain importance of tools for industrial project. Add this image in your presentations to visually support your content and express your thoughts.

Stock Photo Graphics Of Hammer Spanner With Screwdriver PowerPoint Slide
Create dynamic presentations with this professional image of tools screwdriver and hammer. This image may be used to explain importance of tools for industrial project. Add this image in your presentations to visually support your content and express your thoughts.

Stock Photo Hammer And Spanner With Screwdrivers PowerPoint Slide
Create dynamic presentations with this professional image of tools screwdriver and hammer. This image may be used to explain importance of tools for industrial project. Add this image in your presentations to visually support your content and express your thoughts.

Stock Photo Wrench Hammer And Screwdriver For Service PowerPoint Slide
Create dynamic presentations with this professional image of wrench hammer and screwdriver. This image may be used to explain importance of tools for industrial project. Add this image in your presentations to express your thoughts.
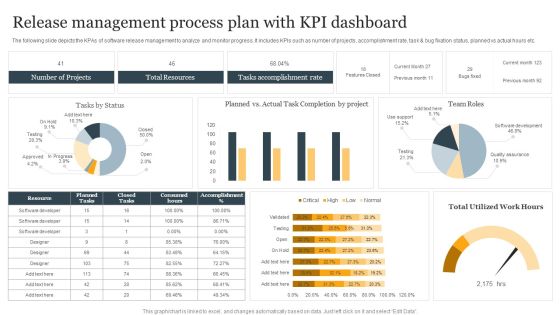
Release Management Process Plan With KPI Dashboard Ppt Infographic Template Structure PDF
The following slide depicts the KPAs of software release management to analyze and monitor progress. It includes KPIs such as number of projects, accomplishment rate, task and bug fixation status, planned vs actual hours etc. Showcasing this set of slides titled Release Management Process Plan With KPI Dashboard Ppt Infographic Template Structure PDF. The topics addressed in these templates are Number Of Projects, Total Resources, Tasks Accomplishment Rate. All the content presented in this PPT design is completely editable. Download it and make adjustments in color, background, font etc. as per your unique business setting.
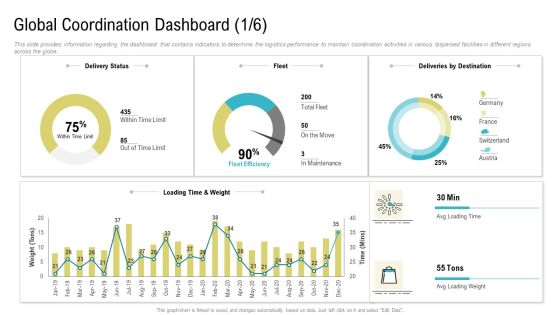
Global Coordination Dashboard Ppt Styles Graphics Download PDF
This slide provides information regarding the dashboard that contains indicators to determine the coordination activities in various dispersed facilities in different regions across the globe. Deliver and pitch your topic in the best possible manner with this global coordination dashboard ppt styles graphics download pdf. Use them to share invaluable insights on project, global coordination dashboard and impress your audience. This template can be altered and modified as per your expectations. So, grab it now.
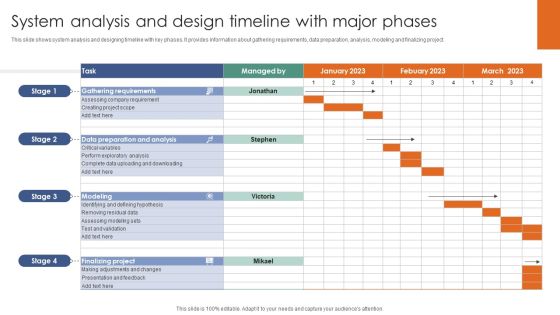
System Analysis And Design Timeline With Major Phases Ppt Pictures Slide Portrait PDF
This slide shows system analysis and designing timeline with key phases. It provides information about gathering requirements, data preparation, analysis, modeling and finalizing project. Showcasing this set of slides titled System Analysis And Design Timeline With Major Phases Ppt Pictures Slide Portrait PDF. The topics addressed in these templates are Modeling, Finalizing Project, Gathering Requirements. All the content presented in this PPT design is completely editable. Download it and make adjustments in color, background, font etc. as per your unique business setting.

Dashboard To Track Energy Efficiency After Campaign Implementation Pictures PDF
This slide consists of a Dashboard which can be used to track energy saving which will be used by managers to track effectiveness of program implementation. The key performance indicators include electric vs gas allocation, equipment activity, changes in costs, budget load etc. Showcasing this set of slides titled Dashboard To Track Energy Efficiency After Campaign Implementation Pictures PDF. The topics addressed in these templates are Equipment Activity, Budget Load, Cost Projection. All the content presented in this PPT design is completely editable. Download it and make adjustments in color, background, font etc. as per your unique business setting.
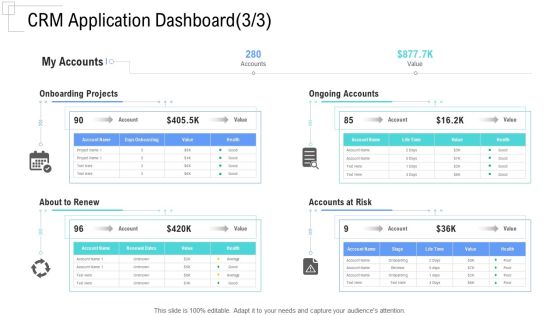
Managing Customer Experience CRM Application Dashboard Accounts Introduction PDF
Deliver and pitch your topic in the best possible manner with this managing customer experience crm application dashboard accounts introduction pdf. Use them to share invaluable insights on onboarding projects, ongoing accounts, about to renew, accounts at risk and impress your audience. This template can be altered and modified as per your expectations. So, grab it now.

CRM Application Dashboard Value Customer Relationship Management CRM Introduction PDF
Deliver and pitch your topic in the best possible manner with this crm application dashboard value customer relationship management crm introduction pdf. Use them to share invaluable insights on ongoing accounts, ongoing project, value, risk and impress your audience. This template can be altered and modified as per your expectations. So, grab it now.
Information Technology Change Implementation Plan Dashboard For Issues Tracking Clipart PDF
This slide shows the issues tracking the dashboard for the business transition project. It provides details of multiple issues faced by users to keep records for effective management of the project. Deliver an awe inspiring pitch with this creative Information Technology Change Implementation Plan Dashboard For Issues Tracking Clipart PDF bundle. Topics like Issues Failed Verification, Immediate Issues, High Churn Issues, Suspect Requirements, Failed Test Runs can be discussed with this completely editable template. It is available for immediate download depending on the needs and requirements of the user.

Change Execution Plan Dashboard For Issues Tracking Ppt PowerPoint Presentation Gallery Background Images PDF
This slide shows the issues tracking the dashboard for the business transition project. It provides details of multiple issues faced by users to keep records for effective management of the project. Deliver and pitch your topic in the best possible manner with this Change Execution Plan Dashboard For Issues Tracking Ppt PowerPoint Presentation Gallery Background Images PDF. Use them to share invaluable insights on Employee Wise Issues, Overall Issues Status, High Churn Issue and impress your audience. This template can be altered and modified as per your expectations. So, grab it now.

Data Quality Auditing And Threats Reporting Process Ppt Icon Picture PDF
This slide covers auditing process of data quality and reporting risk detected. It includes framework depicting checkpoints needed to audit data quality for data warehouse and business intelligence projects. Presenting Data Quality Auditing And Threats Reporting Process Ppt Icon Picture PDF to dispense important information. This template comprises one stages. It also presents valuable insights into the topics including External Data, Customer Data, Legacy Data. This is a completely customizable PowerPoint theme that can be put to use immediately. So, download it and address the topic impactfully.

Change Metrics To Analyze Status By Priority Formats PDF
The following slide displays dashboard for real time tracking of major change kpis of the organization. It includes elements such as requests, projects, open, approved, review, in- progress, etc. Pitch your topic with ease and precision using this Change Metrics To Analyze Status By Priority Formats PDF This layout presents information on Project, Request Statistics, Priority. It is also available for immediate download and adjustment. So, changes can be made in the color, design, graphics or any other component to create a unique layout.

Data Analytics Work Streams With Its Roles And Responsibilities Business Analysis Modification Toolkit Inspiration PDF
This slide highlights the key responsibilities, data work streams and. And data head roles for constructing data analytics project.Deliver an awe inspiring pitch with this creative Data Analytics Work Streams With Its Roles And Responsibilities Business Analysis Modification Toolkit Inspiration PDF bundle. Topics like Machine Learning, Reporting Visualization can be discussed with this completely editable template. It is available for immediate download depending on the needs and requirements of the user.

Business Opportunity Dashboard With Customer Metrics Information PDF
This Slide illustrates market opportunity dashboard with customer metrics which contains favorable net promoter score NPS, standard customers, growth rate, cumulative average of customer location, net income vs projection, customer distribution, sales by representatives, etc. Pitch your topic with ease and precision using this Business Opportunity Dashboard With Customer Metrics Information PDF. This layout presents information on Customer Distribution, Growth Rate, Top Customers Locations. It is also available for immediate download and adjustment. So, changes can be made in the color, design, graphics or any other component to create a unique layout.

Time Management Statistics Diagram Presentation Pictures
This is a time management statistics diagram presentation pictures. This is a six stage process. The stages in this process are objective, projects, to do list, focus, task, objective, time management.

 Home
Home