Project Dashboard

Microsoft Excel Data Analysis 3d Change In Business Process Chart PowerPoint Templates
Double Your Chances With Our microsoft excel data analysis 3d change in business process chart Powerpoint Templates . The Value Of Your Thoughts Will Increase Two-Fold.

Microsoft Excel Data Analysis 3d Chart For Business Observation PowerPoint Templates
Double Up Our microsoft excel data analysis 3d chart for business observation Powerpoint Templates With Your Thoughts. They Will Make An Awesome Pair.
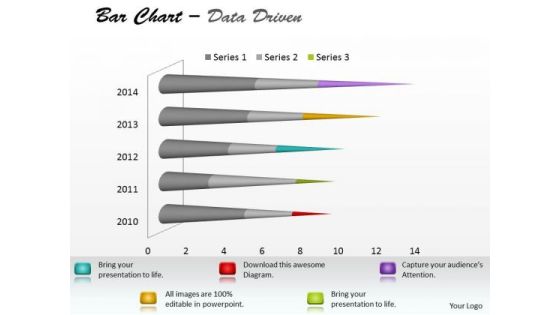
Microsoft Excel Data Analysis Bar Chart To Communicate Information PowerPoint Templates
With Our microsoft excel data analysis bar chart to communicate information Powerpoint Templates You Will Be Doubly Sure. They Possess That Stamp Of Authority.

Microsoft Excel Data Analysis Bar Chart To Compare Quantities PowerPoint Templates
Our microsoft excel data analysis bar chart to compare quantities Powerpoint Templates Leave No One In Doubt. Provide A Certainty To Your Views.
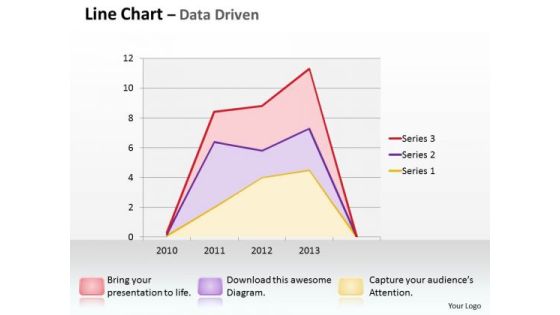
Multivariate Data Analysis Driven Line Chart Shows Revenue Trends PowerPoint Slides Templates
Good Camaraderie Is A Key To Teamwork. Our multivariate data analysis driven line chart shows revenue trends powerpoint slides Templates Can Be A Cementing Force.
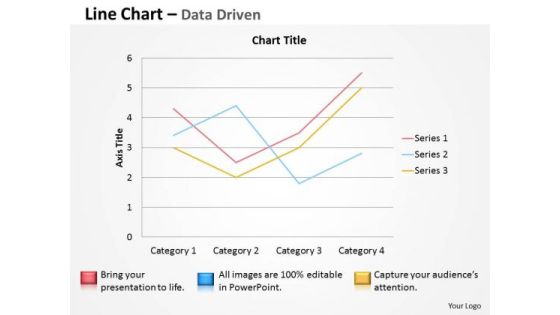
Multivariate Data Analysis Driven Line Chart To Demonstrate PowerPoint Slides Templates
Brace Yourself, Arm Your Thoughts. Prepare For The Hustle With Our multivariate data analysis driven line chart to demonstrate powerpoint slides Templates .
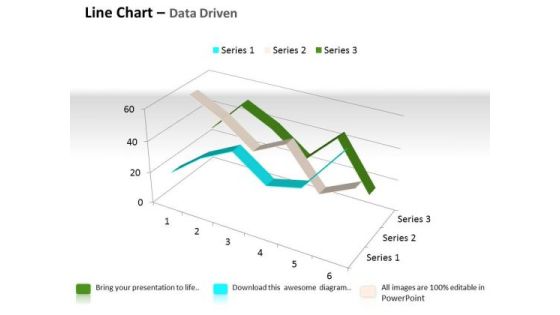
Quantitative Data Analysis 3d Line Chart For Comparison Of PowerPoint Templates
Touch Base With Our quantitative data analysis 3d line chart for comparison of Powerpoint Templates . Review Your Growth With Your Audience.

Quantitative Data Analysis 3d Pie Chart For Business Process PowerPoint Templates
Put Them On The Same Page With Our quantitative data analysis 3d pie chart for business process Powerpoint Templates . Your Team Will Sing From The Same Sheet.
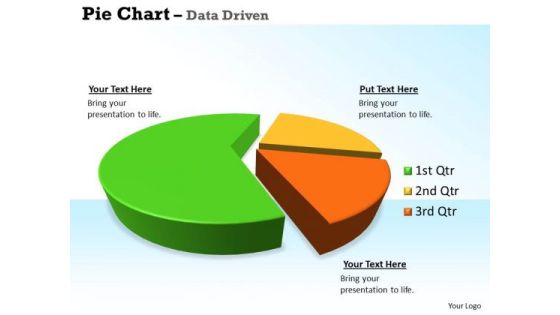
Quantitative Data Analysis 3d Pie Chart For Business Statistics PowerPoint Templates
Our quantitative data analysis 3d pie chart for business statistics Powerpoint Templates Allow You To Do It With Ease. Just Like Picking The Low Hanging Fruit.

Quantitative Data Analysis Driven Economic Status Line Chart PowerPoint Slides Templates
Be The Dramatist With Our quantitative data analysis driven economic status line chart powerpoint slides Templates . Script Out The Play Of Words.

Quantitative Data Analysis Driven Economic With Column Chart PowerPoint Slides Templates
Add Some Dramatization To Your Thoughts. Our quantitative data analysis driven economic with column chart powerpoint slides Templates Make Useful Props.
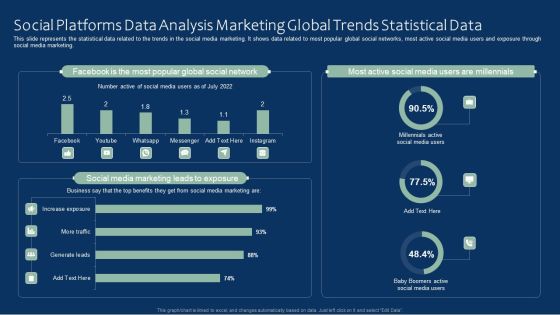
Social Platforms Data Analysis Marketing Global Trends Statistical Data Rules PDF
This slide represents the statistical data related to the trends in the social media marketing. It shows data related to most popular global social networks, most active social media users and exposure through social media marketing. Pitch your topic with ease and precision using this Social Platforms Data Analysis Marketing Global Trends Statistical Data Rules PDF. This layout presents information on Social Platforms Data Analysis, Marketing Global, Trends Statistical Data. It is also available for immediate download and adjustment. So, changes can be made in the color, design, graphics or any other component to create a unique layout.
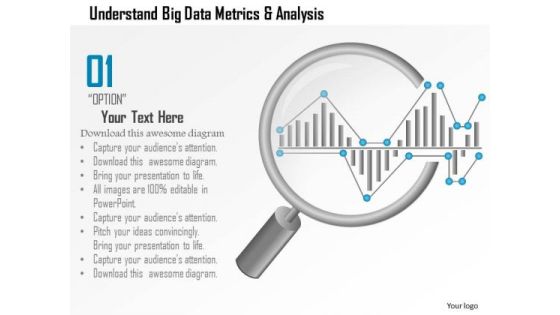
Business Diagram Understand Big Data Metrics And Analysis Showing By Magnifying Glass Ppt Slide
This PPT slide has been designed with big data metrics and magnifying glass. This diagram helps to portray concept of data analysis and data search. Download this diagram to make professional presentations.

Agenda For Predictive Analytics In The Age Of Big Data Graphics PDF
Find a pre designed and impeccable Agenda For Predictive Analytics In The Age Of Big Data Graphics PDF. The templates can ace your presentation without additional effort. You can download these easy to edit presentation templates to make your presentation stand out from others. So, what are you waiting for Download the template from Slidegeeks today and give a unique touch to your presentation.

Sales Data Analysis Diagram Powerpoint Slides
This is a sales data analysis diagram powerpoint slides. This is a three stage process. The stages in this process are data analysis, method, compare.

Data Analysis On Excel 3d Chart Shows Interrelated Sets Of PowerPoint Templates
Put Them On The Same Page With Our data analysis on excel 3d chart shows interrelated sets of Powerpoint Templates . Your Team Will Sing From The Same Sheet.

Pure Data For Analysis Powerpoint Slide Clipart
This is a pure data for analysis powerpoint slide clipart. This is a four stage process. The stages in this process are pure data for analysis, data repositories, production available, packing list.

Role Of Metadata In Data Lineage Process Deploying Data Lineage IT Infographics PDF
This slide represents the role of metadata in the data lineage process, including how it collects information about a particular report or ETL process throughout the organization. It provides information about the companys different resources and their connections.From laying roadmaps to briefing everything in detail, our templates are perfect for you. You can set the stage with your presentation slides. All you have to do is download these easy-to-edit and customizable templates. Role Of Metadata In Data Lineage Process Deploying Data Lineage IT Infographics PDF will help you deliver an outstanding performance that everyone would remember and praise you for. Do download this presentation today.
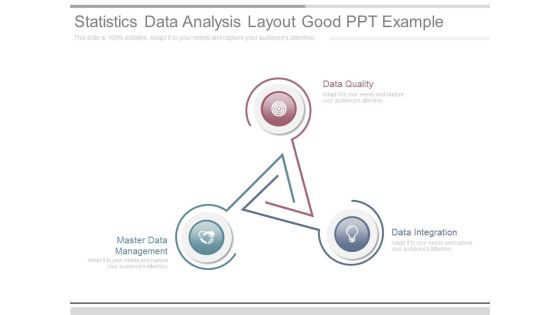
Statistics Data Analysis Layout Good Ppt Example
This is a statistics data analysis layout good ppt example. This is a three stage process. The stages in this process are data quality, data integration, master data management.
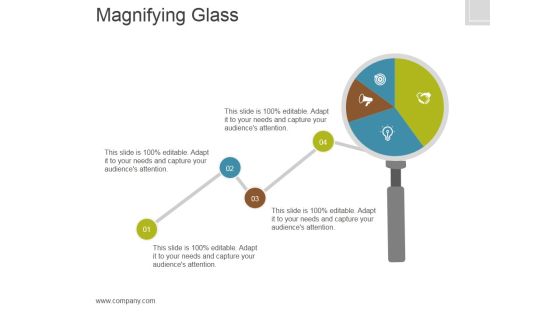
Magnifying Glass Ppt PowerPoint Presentation Professional
This is a magnifying glass ppt powerpoint presentation professional. This is a four stage process. The stages in this process are icons, process, business, marketing, analysis.
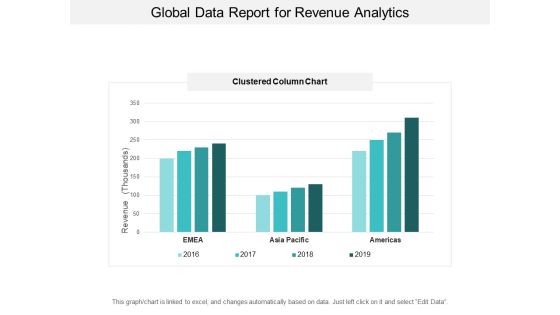
Global Data Report For Revenue Analytics Ppt PowerPoint Presentation Inspiration Visuals
This is a global data report for revenue analytics ppt powerpoint presentation inspiration visuals. This is a four stage process. The stages in this process are financial analysis, quantitative, statistical modelling.

Comparative Analysis Of Tools For Measuring Effectiveness Of Training Program Icons PDF
This slide covers comparative analysis of tools for measuring effectiveness of training program. It involves features such as analytics dashboard, customized survey templates, data analysis and customized reports. Find highly impressive Comparative Analysis Of Tools For Measuring Effectiveness Of Training Program Icons PDF on Slidegeeks to deliver a meaningful presentation. You can save an ample amount of time using these presentation templates. No need to worry to prepare everything from scratch because Slidegeeks experts have already done a huge research and work for you. You need to download Comparative Analysis Of Tools For Measuring Effectiveness Of Training Program Icons PDF for your upcoming presentation. All the presentation templates are 100 percent editable and you can change the color and personalize the content accordingly. Download now

Six Sigma Methodologies For Process Optimization Introduction To The Six Sigma Topics PDF
This slide gives the description of the six sigma method to analyze and improve the project, and its name is derived from the Greek word. Deliver an awe inspiring pitch with this creative Six Sigma Methodologies For Process Optimization Introduction To The Six Sigma Topics PDF bundle. Topics like Methodology, Data Driven Strategy, Management Methods can be discussed with this completely editable template. It is available for immediate download depending on the needs and requirements of the user.

Data Lake Architecture Future Of Data Analysis Comparison Between Data Warehouse Diagrams PDF
This slide represents the comparison between data warehouse, data lake and data lakehouse based on the period and components of both, along with information insights carried out.Deliver and pitch your topic in the best possible manner with this Data Lake Architecture Future Of Data Analysis Comparison Between Data Warehouse Diagrams PDF. Use them to share invaluable insights on Data Warehouse, Unstructured Data, Streaming Analytics and impress your audience. This template can be altered and modified as per your expectations. So, grab it now.

Predictive Analytics In The Age Of Big Data Table Of Contents Background PDF
Slidegeeks is one of the best resources for PowerPoint templates. You can download easily and regulate Predictive Analytics In The Age Of Big Data Table Of Contents Background PDF for your personal presentations from our wonderful collection. A few clicks is all it takes to discover and get the most relevant and appropriate templates. Use our Templates to add a unique zing and appeal to your presentation and meetings. All the slides are easy to edit and you can use them even for advertisement purposes.

Customer Data Mining And Analysis Ppt Sample
This is a customer data mining and analysis ppt sample. This is a five stage process. The stages in this process are data mining and analysis, customer data, execute business plan, customer service, sale marketing.
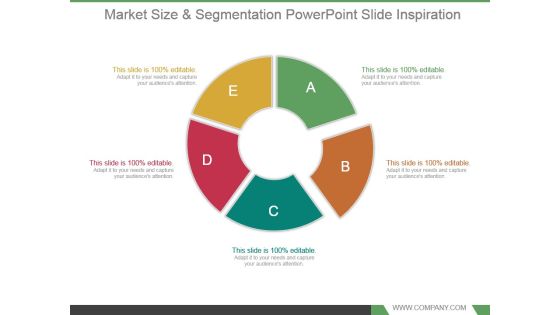
Market Size And Segmentation Powerpoint Slide Inspiration
This is a market size and segmentation powerpoint slide inspiration. This is a five stage process. The stages in this process are market, process, flow, circle, size.
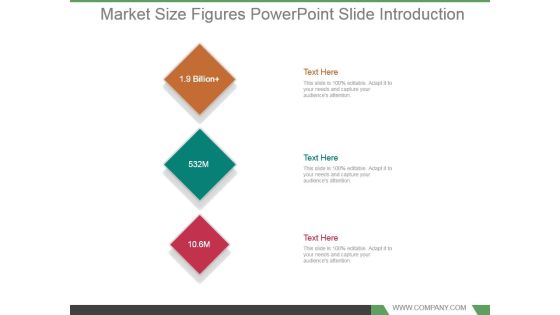
Market Size Figures Powerpoint Slide Introduction
This is a market size figures powerpoint slide introduction. This is a three stage process. The stages in this process are business, marketing, strategy, figure, size.

Market Size Study Powerpoint Slide Rules
This is a market size study powerpoint slide rules. This is a three stage process. The stages in this process are target market, in team of users, in team of revenue, advertisers, event organizers, mentors.

Big Data Partnership Challenges Analysis Ppt Design
This is a big data partnership challenges analysis ppt design. This is a four stage process. The stages in this process are academia and scientific communities, national statically offers, big data providers data sources, research institutes and technology providers.

Big Data Cycle For Analysis Diagram Slides
This is a big data cycle for analysis diagram slides. This is a five stage process. The stages in this process are massive data, new management needs, new final result, new hard and software, new analysis possibilities.

Tools For HR Business Analytics Understanding Working Of ETL Tools For Data Integration Ideas PDF
This slide represents the workflow of ETL tools which allows businesses to consolidate data from various databases into single repository. It includes three steps of ETL process such as extracting, transforming and loading data. Presenting this PowerPoint presentation, titled Tools For HR Business Analytics Understanding Working Of ETL Tools For Data Integration Ideas PDF, with topics curated by our researchers after extensive research. This editable presentation is available for immediate download and provides attractive features when used. Download now and captivate your audience. Presenting this Tools For HR Business Analytics Understanding Working Of ETL Tools For Data Integration Ideas PDF. Our researchers have carefully researched and created these slides with all aspects taken into consideration. This is a completely customizable Tools For HR Business Analytics Understanding Working Of ETL Tools For Data Integration Ideas PDF that is available for immediate downloading. Download now and make an impact on your audience. Highlight the attractive features available with our PPTs.
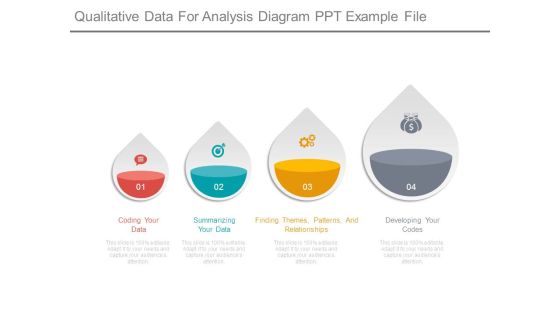
Qualitative Data For Analysis Diagram Ppt Example File
This is a qualitative data for analysis diagram ppt example file. This is a four stage process. The stages in this process are coding your data, summarizing your data, finding themes, patterns, and relationships, developing your codes.

Magnifying Glass Ppt PowerPoint Presentation Information
This is a magnifying glass ppt powerpoint presentation information. This is a one stage process. The stages in this process are magnify, gears, search, big data, technology.
Mobile Data Analysis Vector Ppt PowerPoint Presentation Icon Slide
This is a mobile data analysis vector ppt powerpoint presentation icon slide. This is a four stage process. The stages in this process are mobile analytics, mobile tracking, mobile web analytics.

Mobile Data And Statistical Analysis Ppt PowerPoint Presentation Slides Portrait
This is a mobile data and statistical analysis ppt powerpoint presentation slides portrait. This is a two stage process. The stages in this process are mobile analytics, mobile tracking, mobile web analytics.
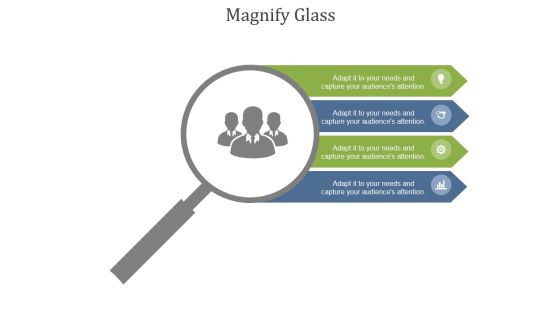
Magnify Glass Ppt PowerPoint Presentation Themes
This is a magnify glass ppt powerpoint presentation themes. This is a four stage process. The stages in this process are magnifier, search, analysis, marketing, strategy, success.

Magnifying Glass Ppt PowerPoint Presentation Portfolio Layout
This is a magnifying glass ppt powerpoint presentation portfolio layout. This is a six stage process. The stages in this process are magnifier, research, analysis, business, marketing.

Analyze Results Ppt PowerPoint Presentation Professional Guide
This is a analyze results ppt powerpoint presentation professional guide. This is a two stage process. The stages in this process are magnifier, search, marketing, strategy, analysis, business.

Data Lake Architecture Future Of Data Analysis Central Repository Data Lake Overview Pictures PDF
This slide represents the overview of data lake is and how it stores machine learning, analytics, on-premise data movement, real-time data movement.Deliver and pitch your topic in the best possible manner with this Data Lake Architecture Future Of Data Analysis Central Repository Data Lake Overview Pictures PDF. Use them to share invaluable insights on Cloud Sources, Storage Identifies, Information Across and impress your audience. This template can be altered and modified as per your expectations. So, grab it now.

Bar Graph For Marketing Research Data Powerpoint Slides
This PowerPoint template has been designed with diagram of bar graph. This PPT slide can be used to prepare presentations for profit growth report and also for financial data analysis. You can download finance PowerPoint template to prepare awesome presentations.
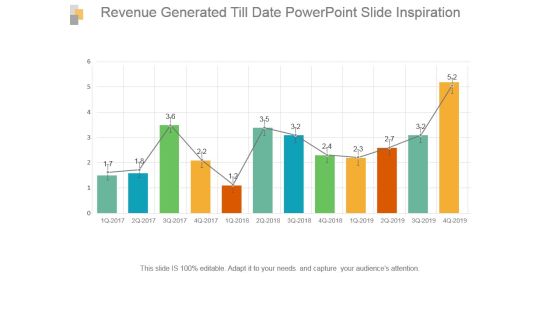
Revenue Generated Till Date Powerpoint Slide Inspiration
This is a revenue generated till date powerpoint slide inspiration. This is a twelve stage process. The stages in this process are bar graph, growth, success, data, analysis.
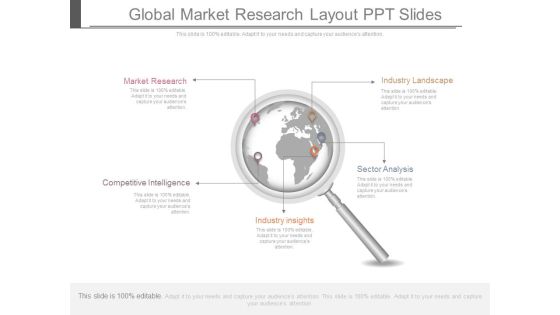
Global Market Research Layout Ppt Slides
This is a global market research layout ppt slides. This is a five stage process. The stages in this process are market research, industry landscape, competitive intelligence, sector analysis, industry insights.

Force Field Analysis Template 2 Ppt PowerPoint Presentation Themes
This is a force field analysis template 2 ppt powerpoint presentation themes. This is a two stage process. The stages in this process are restraining forces, driving forces, estimated strength, equilibrium.
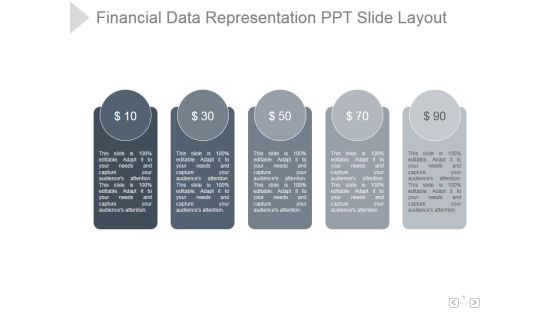
Financial Data Representation Ppt PowerPoint Presentation Rules
This is a financial data representation ppt powerpoint presentation rules. This is a five stage process. The stages in this process are financial, data, representation, marketing, management, business.
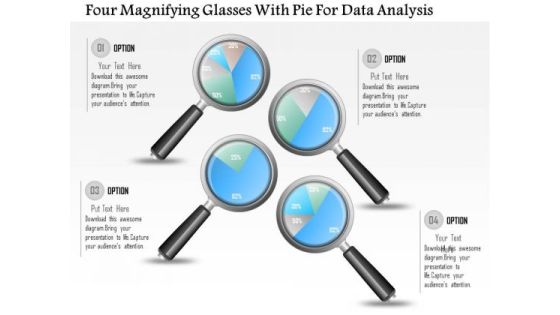
Business Diagram Four Magnifying Glasses With Pie For Data Analysis PowerPoint Slide
This business diagram displays graphic of pie charts in shape of magnifying glasses This business slide is suitable to present and compare business data. Use this diagram to build professional presentations for your viewers.
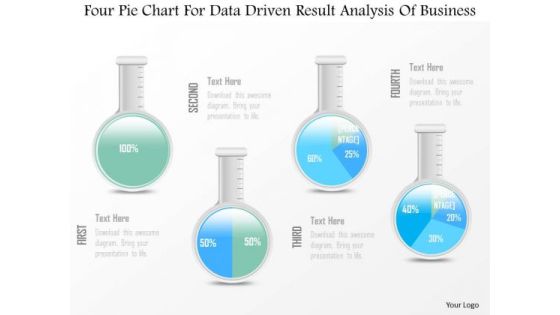
Business Diagram Four Pie Chart For Data Driven Result Analysis Of Business PowerPoint Slide
This business diagram displays graphic of pie charts in shape of flasks. This business slide is suitable to present and compare business data. Use this diagram to build professional presentations for your viewers.
Sales Gap Data Analysis Icon Microsoft PDF
Persuade your audience using this Sales Gap Data Analysis Icon Microsoft PDF. This PPT design covers four stages, thus making it a great tool to use. It also caters to a variety of topics including Sales Gap Data, Analysis Icon. Download this PPT design now to present a convincing pitch that not only emphasizes the topic but also showcases your presentation skills.

Predictive Analytics Methods Predictive Analytics Models For Predictive Problems Graphics PDF
This slide depicts the overview of predictive analytics models, including the predictive problems they solve, such as binary results, number prediction, detecting odd behavior, and so on. The models include classification, forecasting, anomaly, cluster, and time series. The Predictive Analytics Methods Predictive Analytics Models For Predictive Problems Graphics PDF is a compilation of the most recent design trends as a series of slides. It is suitable for any subject or industry presentation, containing attractive visuals and photo spots for businesses to clearly express their messages. This template contains a variety of slides for the user to input data, such as structures to contrast two elements, bullet points, and slides for written information. Slidegeeks is prepared to create an impression.

Data Analytics IT Roadmap To Integrate Data Science In The Organization Microsoft PDF
This slide shows the roadmap to integrate data science in the business and what actions to be made at each stage after an interval of time. This is a data analytics it roadmap to integrate data science in the organization microsoft pdf template with various stages. Focus and dispense information on five stages using this creative set, that comes with editable features. It contains large content boxes to add your information on topics like data acquisition and transformation, hire professional data scientists, final data analysis and reporting. You can also showcase facts, figures, and other relevant content using this PPT layout. Grab it now.

Data Interpretation And Analysis Playbook How To Fix The Business Intelligence Problem Data Analytics Playbook Sample PDF
This template covers the solution for BI problems such as analytics transformation and business intelligence program. It also depicts that switching to next-generation analytics platform that gives business users data-driven insights. Presenting data interpretation and analysis playbook how to fix the business intelligence problem data analytics playbook sample pdf to provide visual cues and insights. Share and navigate important information on six stages that need your due attention. This template can be used to pitch topics like analytics, business intelligence, predictive analytics. In addtion, this PPT design contains high resolution images, graphics, etc, that are easily editable and available for immediate download.

Big Healthcare Data Analytics Workflow Infographics PDF
This slide showcase the process for big data mining in healthcare. It includes elements such as types of different data, types of analytics and outcomes improved. Showcasing this set of slides titled Big Healthcare Data Analytics Workflow Infographics PDF. The topics addressed in these templates are Data Detection, Electronic Health Record, Clinical Data. All the content presented in this PPT design is completely editable. Download it and make adjustments in color, background, font etc. as per your unique business setting.

Data Analysis Workflow Chart Powerpoint Slides
This is a data analysis workflow chart powerpoint slides. This is a three stage process. The stages in this process are connect, visualize, share.
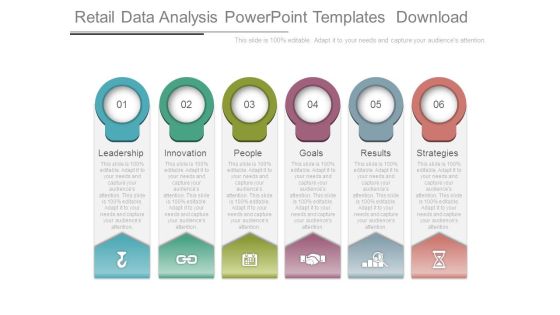
Retail Data Analysis Powerpoint Templates Download
This is a retail data analysis powerpoint templates download. This is a six stage process. The stages in this process are leadership, innovation, people, goals, results, strategies.

Business Analytics Application Understanding Working Of ETL Tools For Data Structure PDF
This slide represents the workflow of ETL tools which allows businesses to consolidate data from various databases into single repository. It includes three steps of ETL process such as extracting, transforming and loading data. This Business Analytics Application Understanding Working Of ETL Tools For Data Structure PDF from Slidegeeks makes it easy to present information on your topic with precision. It provides customization options, so you can make changes to the colors, design, graphics, or any other component to create a unique layout. It is also available for immediate download, so you can begin using it right away. Slidegeeks has done good research to ensure that you have everything you need to make your presentation stand out. Make a name out there for a brilliant performance.
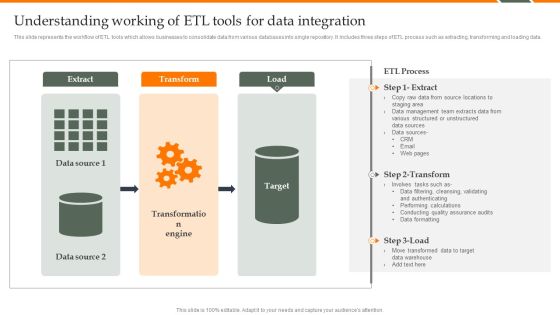
Human Resource Analytics Understanding Working Of ETL Tools For Data Integration Microsoft PDF
This slide represents the workflow of ETL tools which allows businesses to consolidate data from various databases into single repository. It includes three steps of ETL process such as extracting, transforming and loading data. Do you know about Slidesgeeks Human Resource Analytics Understanding Working Of ETL Tools For Data Integration Microsoft PDF These are perfect for delivering any kind od presentation. Using it, create PowerPoint presentations that communicate your ideas and engage audiences. Save time and effort by using our pre-designed presentation templates that are perfect for a wide range of topic. Our vast selection of designs covers a range of styles, from creative to business, and are all highly customizable and easy to edit. Download as a PowerPoint template or use them as Google Slides themes.

Business Data Analysis Databases Download PDF
Deliver an awe inspiring pitch with this creative business data analysis databases download pdf bundle. Topics like amalgamation of traditional, this integration paves the way for a hybrid data model and requires low investment and it infrastructural costs, these databases can then provide for the extraction of insights that are used to drive business profits. can be discussed with this completely editable template. It is available for immediate download depending on the needs and requirements of the user.

Customer Focus Ppt PowerPoint Presentation Outline
This is a customer focus ppt powerpoint presentation outline. This is a one stage process. The stages in this process are customer focus, magnifier, search, analysis, business.

Case Study Ppt PowerPoint Presentation Slides Diagrams
This is a case study ppt powerpoint presentation slides diagrams. This is a one stage process. The stages in this process are magnify, search, technology, study, analysis.

Value Stream Information Data Analytics Structure Business Analysis Modification Toolkit Rules PDF
The slides shows the stages of data analytics with reactive and proactive approach. In includes four steps collection, analysis, predictive and actions.Presenting Value Stream Information Data Analytics Structure Business Analysis Modification Toolkit Rules PDF to provide visual cues and insights. Share and navigate important information on four stages that need your due attention. This template can be used to pitch topics like Predictive Analytics, Streaming Analytics, Collection Analysis. In addtion, this PPT design contains high resolution images, graphics, etc, that are easily editable and available for immediate download.

 Home
Home