Project Dashboard

Consumer Research And Analysis Vector Icon Ppt PowerPoint Presentation File Graphics Download PDF
Presenting this set of slides with name consumer research and analysis vector icon ppt powerpoint presentation file graphics download pdf. This is a three stage process. The stages in this process are consumer research and analysis vector icon. This is a completely editable PowerPoint presentation and is available for immediate download. Download now and impress your audience.

Consumer Statistics Analysis Vector Icon Ppt PowerPoint Presentation File Guidelines PDF
Presenting this set of slides with name consumer statistics analysis vector icon ppt powerpoint presentation file guidelines pdf. This is a three stage process. The stages in this process are consumer statistics analysis vector icon. This is a completely editable PowerPoint presentation and is available for immediate download. Download now and impress your audience.
Magnifying Glass Bar Graph Showing Business Statistical Analysis Ppt PowerPoint Presentation File Sample PDF
Presenting this set of slides with name magnifying glass bar graph showing business statistical analysis ppt powerpoint presentation file sample pdf. This is a three stage process. The stages in this process are magnifying glass bar graph showing business statistical analysis. This is a completely editable PowerPoint presentation and is available for immediate download. Download now and impress your audience.

Cost Control And Analysis Ppt PowerPoint Presentation Summary Example Topics PDF
Presenting this set of slides with name cost control and analysis ppt powerpoint presentation summary example topics pdf. This is a four stage process. The stages in this process are cost control and analysis. This is a completely editable PowerPoint presentation and is available for immediate download. Download now and impress your audience.
Documenting Operations For Information Technology Simplification Analysis Icon Ppt PowerPoint Presentation File Influencers PDF
Presenting documenting operations for information technology simplification analysis icon ppt powerpoint presentation file influencers pdf to dispense important information. This template comprises two stages. It also presents valuable insights into the topics including documenting operations for information technology simplification analysis icon. This is a completely customizable PowerPoint theme that can be put to use immediately. So, download it and address the topic impactfully.
Magnifying Glass Medical Research And Analysis Vector Icon Ppt PowerPoint Presentation Gallery Graphics Pictures PDF
Presenting magnifying glass medical research and analysis vector icon ppt powerpoint presentation gallery graphics pictures pdf to dispense important information. This template comprises three stages. It also presents valuable insights into the topics including magnifying glass medical research and analysis vector icon. This is a completely customizable PowerPoint theme that can be put to use immediately. So, download it and address the topic impactfully.

Customer Research And Analysis Vector Icon Ppt PowerPoint Presentation Icon Maker PDF
Presenting customer research and analysis vector icon ppt powerpoint presentation icon maker pdf to dispense important information. This template comprises three stages. It also presents valuable insights into the topics including customer research and analysis vector icon. This is a completely customizable PowerPoint theme that can be put to use immediately. So, download it and address the topic impactfully.

Predictive Analytics In The Age Of Big Data Uses Of Predictive Analytics Credit Ideas PDF
This slide describes the usage of predictive analytics in banking and other financial institutions for credit purposes. It is used to calculate the credit score of a person or organization and to ensure that borrower doesnot fail to return the loan. Present like a pro with Predictive Analytics In The Age Of Big Data Uses Of Predictive Analytics Credit Ideas PDF Create beautiful presentations together with your team, using our easy to use presentation slides. Share your ideas in real time and make changes on the fly by downloading our templates. So whether you are in the office, on the go, or in a remote location, you can stay in sync with your team and present your ideas with confidence. With Slidegeeks presentation got a whole lot easier. Grab these presentations today.

Business Objectives Impact Analysis Icon Themes PDF
Presenting Business Objectives Impact Analysis Icon Themes PDF to dispense important information. This template comprises three stages. It also presents valuable insights into the topics including Business Objectives, Impact Analysis Icon. This is a completely customizable PowerPoint theme that can be put to use immediately. So, download it and address the topic impactfully.

Business Process Impact Analysis Icon Demonstration PDF
Persuade your audience using this Business Process Impact Analysis Icon Demonstration PDF. This PPT design covers three stages, thus making it a great tool to use. It also caters to a variety of topics including Business Process, Impact Analysis Icon. Download this PPT design now to present a convincing pitch that not only emphasizes the topic but also showcases your presentation skills.
Problem Analysis Overview Procedure Icon Summary PDF
Presenting Problem Analysis Overview Procedure Icon Summary PDF to dispense important information. This template comprises three stages. It also presents valuable insights into the topics including Problem Analysis, Overview Procedure Icon . This is a completely customizable PowerPoint theme that can be put to use immediately. So, download it and address the topic impactfully.
Statistical Analysis Icon With Magnifying Glass Ppt PowerPoint Presentation Gallery Clipart Images PDF
Persuade your audience using this statistical analysis icon with magnifying glass ppt powerpoint presentation gallery clipart images pdf. This PPT design covers three stages, thus making it a great tool to use. It also caters to a variety of topics including statistical analysis icon with magnifying glass. Download this PPT design now to present a convincing pitch that not only emphasizes the topic but also showcases your presentation skills.
Statistical Analysis Icon With Pie Chart Ppt PowerPoint Presentation Diagram Templates PDF
Persuade your audience using this statistical analysis icon with pie chart ppt powerpoint presentation diagram templates pdf. This PPT design covers three stages, thus making it a great tool to use. It also caters to a variety of topics including statistical analysis icon with pie chart. Download this PPT design now to present a convincing pitch that not only emphasizes the topic but also showcases your presentation skills.
Target Customer Research Analysis Vector Icon Ppt PowerPoint Presentation Model Example Topics PDF
Persuade your audience using this target customer research analysis vector icon ppt powerpoint presentation model example topics pdf. This PPT design covers four stages, thus making it a great tool to use. It also caters to a variety of topics including target customer research analysis vector icon. Download this PPT design now to present a convincing pitch that not only emphasizes the topic but also showcases your presentation skills.

Campaign Report Ppt PowerPoint Presentation File Icon
This is a campaign report ppt powerpoint presentation file icon. This is a ten stage process. The stages in this process are email name, send date time, recipients, delivered, spam.

Market Dynamics Ppt PowerPoint Presentation Show
This is a market dynamics ppt powerpoint presentation show. This is a four stage process. The stages in this process are competitive landscape, market opportunity description, economic outlook, market dynamics.

Activity Analysis Ppt PowerPoint Presentation Diagram Images
This is a activity analysis ppt powerpoint presentation diagram images. This is a one stage process. The stages in this process are survey, customer video contest, customer surveys, product testers, acquisition, idea collection.

Fishbone Ishikawa Cause And Effect Analysis Magnifying Glass Ppt PowerPoint Presentation Summary Objects PDF
Presenting this set of slides with name fishbone ishikawa cause and effect analysis magnifying glass ppt powerpoint presentation summary objects pdf. This is a four stage process. The stages in this process are magnifying glass. This is a completely editable PowerPoint presentation and is available for immediate download. Download now and impress your audience.

Client Segmentation Analysis Understand The Customer Needs Ppt Ideas Graphics Template PDF
Presenting this set of slides with name client segmentation analysis understand the customer needs ppt ideas graphics template pdf. This is a five stage process. The stages in this process are business, website, occupation. This is a completely editable PowerPoint presentation and is available for immediate download. Download now and impress your audience.

Business Diagram Data Visualization Workflow From Data Access To Graphs Ppt Slide
Graphic of workflow has been used to design this diagram. This diagram slide depicts the concept of data visualization from data access. This diagrams suitable for technology and internet related presentations.

Calculating Customer Lifetime Value Clv Ppt PowerPoint Presentation Styles Good
This is a calculating customer lifetime value clv ppt powerpoint presentation styles good. This is a five stage process. The stages in this process are average acquisition cost, average customer revenue, average customer costs, average customer profit, customer retention rate, cumulative retention rate, likely customer profit.
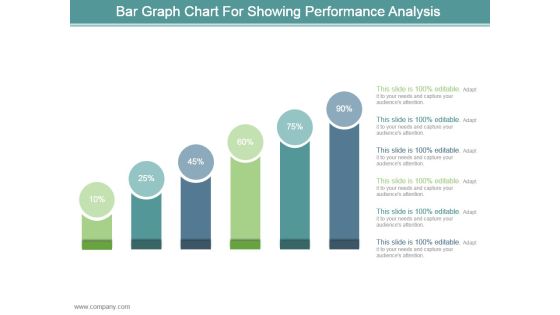
Bar Graph Chart For Showing Performance Analysis Ppt Design
This is a bar graph chart for showing performance analysis ppt design. This is a six stage process. The stages in this process are business, marketing, process, success, presentation.

Data Analytics Management Big Data Types Structured Data Introduction PDF
This slide represents the structured data type of big data and how data is kept in specific formats that are handled by machines only.Deliver an awe inspiring pitch with this creative Data Analytics Management Big Data Types Structured Data Introduction PDF bundle. Topics like Handled By Machines, Information, Business Databases can be discussed with this completely editable template. It is available for immediate download depending on the needs and requirements of the user.

Consulting Slides Bar Chart For Data Interpretation Business Presentation
This pre-designed and appealing bar chart for PowerPoint offer an optimized possibility to illustrate your business strategy. You can use this diagram for data interpretation. This diagram is editable and can be easily adjusted.
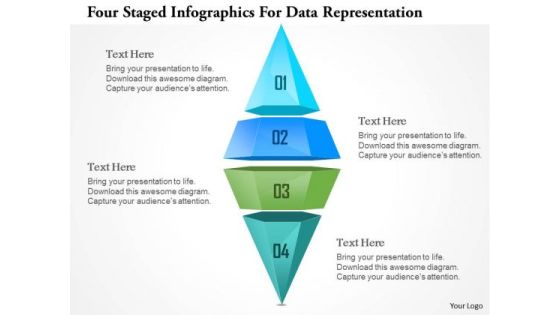
Busines Diagram Four Staged Ingographics For Data Representation Ppt Template
This business diagram has been designed with graphic of four staged info graphics. This info graphic can be used for data representation. Deliver amazing presentations to mesmerize your audience.

Budgeting Template Ppt PowerPoint Presentation Show Template
This is a budgeting template ppt powerpoint presentation show template. This is a three stage process. The stages in this process are business, marketing, finance, planning, tables.
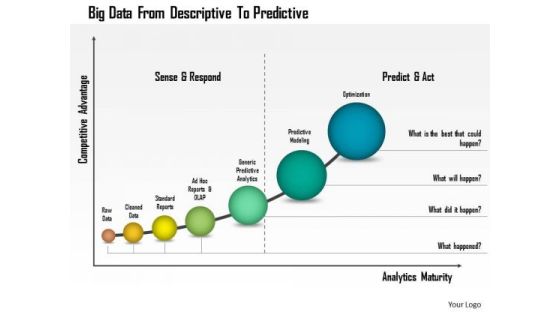
Business Diagram Big Data From Descriptive To Predictive Presentation Template
This business diagram has been designed with graphic of linear bar graph. This growing bar graph depicts the concept of big data analysis. Use this professional diagram for your financial and business analysis.

Business Diagram Business Bar Graph For Data Analysis Presentation Template
This business slide displays pie charts with percentage ratios. This diagram is a data visualization tool that gives you a simple way to present statistical information. This slide helps your audience examines and interprets the data you present.

Data Analytics Management Big Data Types Unstructured Data Brochure PDF
This slide depicts the unstructured data form of big data and how it can be any form such as videos, audio, likes, and comments. Deliver and pitch your topic in the best possible manner with this Data Analytics Management Big Data Types Unstructured Data Brochure PDF. Use them to share invaluable insights on Unorganized Information, Format Collected, Document Stored and impress your audience. This template can be altered and modified as per your expectations. So, grab it now.

Data Lineage Methods Data Lineage For Business People Designs PDF
This slide talks about the data lineage for business people, including their needs, initiatives, benefits and type of lineages that can be used. The advantages include avoiding fines and lowering operational threats, increasing productivity, creating reconciliation reports, and increasing data quality. Find a pre-designed and impeccable Data Lineage Methods Data Lineage For Business People Designs PDF. The templates can ace your presentation without additional effort. You can download these easy-to-edit presentation templates to make your presentation stand out from others. So, what are you waiting for Download the template from Slidegeeks today and give a unique touch to your presentation.

Budgeting Template Ppt PowerPoint Presentation Styles Pictures
This is a budgeting template ppt powerpoint presentation styles pictures. This is a three stage process. The stages in this process are public relations, web marketing, advertising, press release development, review program.

Budgeting Template Ppt PowerPoint Presentation Gallery Inspiration
This is a budgeting template ppt powerpoint presentation gallery inspiration. This is a three stage process. The stages in this process are public relations, web marketing, advertising, press release development, microsoft as program.
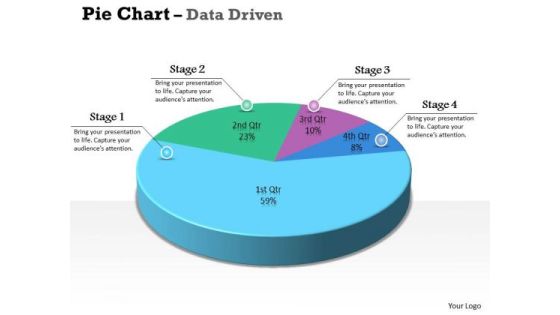
Data Analysis Excel 3d Pie Chart For Marketing Process PowerPoint Templates
Our data analysis excel 3d pie chart for marketing process Powerpoint Templates Team Are A Dogged Lot. They Keep At It Till They Get It Right.
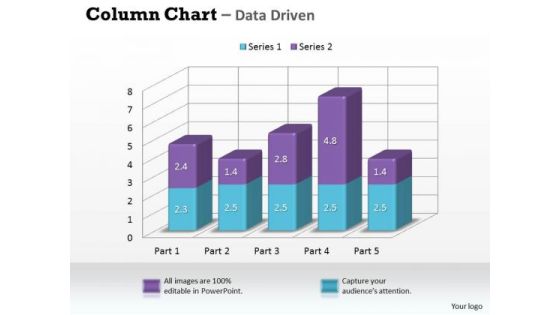
Data Analysis In Excel 3d Column Chart For Market Surveys PowerPoint Templates
Our data analysis in excel 3d column chart for market surveys Powerpoint Templates Leave No One In Doubt. Provide A Certainty To Your Views.

Data Analysis Programs 3d Bar Chart For Market Surveys PowerPoint Templates
Draw On The Experience Of Our data analysis programs 3d bar chart for market surveys Powerpoint Templates . They Imbibe From Past Masters.
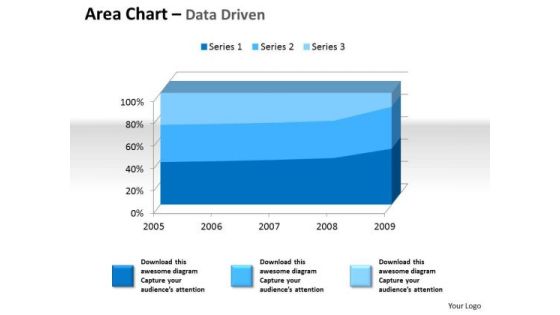
Examples Of Data Analysis Market 3d Area Chart For Quantiative PowerPoint Templates
Drum It Up With Our examples of data analysis market 3d area chart for quantiative Powerpoint Templates . Your Thoughts Will Raise The Tempo.
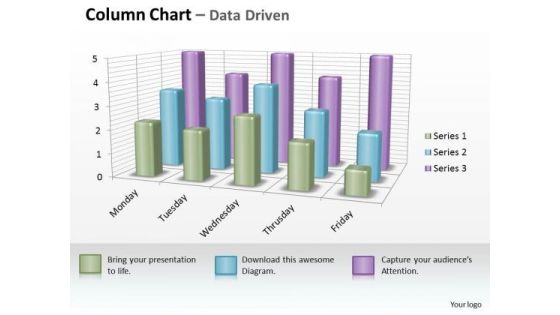
Examples Of Data Analysis Market 3d Business Inspection Procedure Chart PowerPoint Templates
However Dry Your Topic Maybe. Make It Catchy With Our examples of data analysis market 3d business inspection procedure chart Powerpoint Templates .

Examples Of Data Analysis Market 3d Business Intelligence And PowerPoint Templates
Our examples of data analysis market 3d business intelligence and Powerpoint Templates Are Dual Purpose. They Help Instruct And Inform At The Same Time.
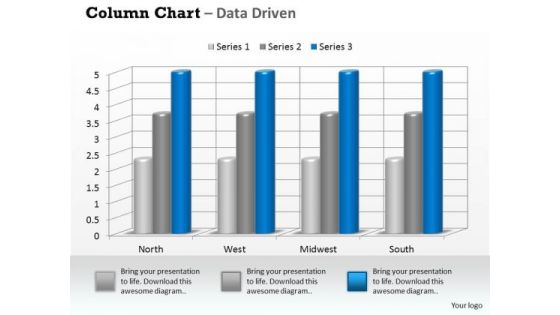
Examples Of Data Analysis Market 3d Business On Regular Intervals PowerPoint Templates
Drum It Out Loud And Clear On Our examples of data analysis market 3d business on regular intervals Powerpoint Templates . Your Words Will Ring In Their Ears.

Examples Of Data Analysis Market Driven Plotting The Business Values PowerPoint Slides Templates
Ring The Duck With Our examples of data analysis market driven plotting the business values powerpoint slides Templates . Acquire The Points With Your Ideas.

Examples Of Data Analysis Market Driven Radar Chart To Compare PowerPoint Slides Templates
Rely On Our examples of data analysis market driven radar chart to compare powerpoint slides Templates In Any Duel. They Will Drive Home Your Point.

Financial Data Analysis Driven Compare Market Share Of Brand PowerPoint Templates
Doll Up Your Thoughts With Our financial data analysis driven compare market share of brand Powerpoint Templates . They Will Make A Pretty Picture.
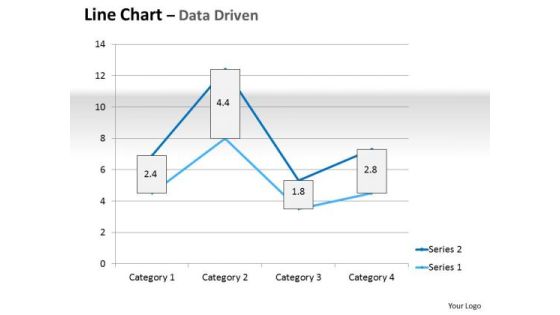
Multivariate Data Analysis Driven Line Chart Market Graph PowerPoint Slides Templates
Plan For All Contingencies With Our multivariate data analysis driven line chart market graph powerpoint slides Templates . Douse The Fire Before It Catches.
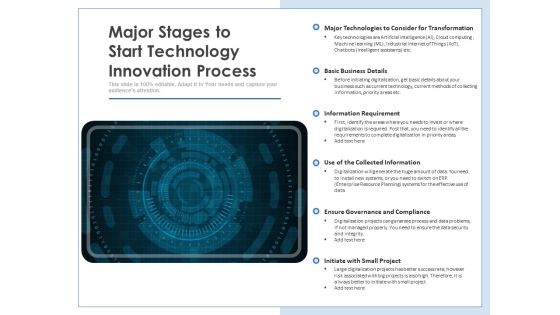
Major Stages To Start Technology Innovation Process Ppt PowerPoint Presentation Show Pictures PDF
Persuade your audience using this major stages to start technology innovation process ppt powerpoint presentation show pictures pdf. This PPT design covers one stages, thus making it a great tool to use. It also caters to a variety of topics including major technologies to consider for transformation, basic business details, information requirement, use of the collected information, ensure governance and compliance, initiate with small project. Download this PPT design now to present a convincing pitch that not only emphasizes the topic but also showcases your presentation skills.

Competitive Analysis Techniques Ppt Powerpoint Images
This is a competitive analysis techniques ppt powerpoint images. This is a six stage process. The stages in this process are competitor analysis, distribution, success, innovation, benefits, research, customer.

Comprehensive Analysis Of Different Data Lineage Classification Data Lineage For Technical Professionals Summary PDF
This slide covers the importance of data lineage for technical experts, containing their requirements, projects, benefits, and type of data lineage. The advantages include lowering IT-related costs and required resources, enhancing productivity, and lowering the time to fix issues. Make sure to capture your audiences attention in your business displays with our gratis customizable Comprehensive Analysis Of Different Data Lineage Classification Data Lineage For Technical Professionals Summary PDF. These are great for business strategies, office conferences, capital raising or task suggestions. If you desire to acquire more customers for your tech business and ensure they stay satisfied, create your own sales presentation with these plain slides.

Predictive Data Model Neural Network Model For Predictive Analytics Structure PDF
This slide depicts the neural networks model of predictive analytics that behave in the same manner as a human brain does. It used artificial intelligence and pattern recognition to operate on complex information connections. Crafting an eye-catching presentation has never been more straightforward. Let your presentation shine with this tasteful yet straightforward Predictive Data Model Neural Network Model For Predictive Analytics Structure PDF template. It offers a minimalistic and classy look that is great for making a statement. The colors have been employed intelligently to add a bit of playfulness while still remaining professional. Construct the ideal Predictive Data Model Neural Network Model For Predictive Analytics Structure PDF that effortlessly grabs the attention of your audience Begin now and be certain to wow your customers

Data Analytics Software Features Business Analysis Modification Toolkit Formats PDF
This slide represents the key features of predictive data analytics including data mining, data visualization, and modelling etc.Presenting Data Analytics Software Features Business Analysis Modification Toolkit Formats PDF to provide visual cues and insights. Share and navigate important information on eight stages that need your due attention. This template can be used to pitch topics like Predictive Modeling, Data Unification, Data Visualization. In addtion, this PPT design contains high resolution images, graphics, etc, that are easily editable and available for immediate download.

Business Research And Analysis Ppt PowerPoint Presentation Ideas Graphics Design
This is a business research and analysis ppt powerpoint presentation ideas graphics design. This is a three stage process. The stages in this process are support, assistance, hand holding.
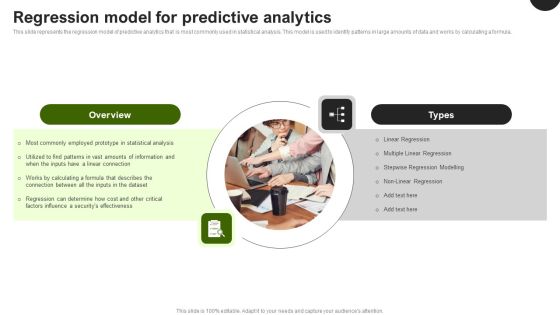
Predictive Analytics In The Age Of Big Data Regression Model For Predictive Analytics Elements PDF
This slide represents the regression model of predictive analytics that is most commonly used in statistical analysis. This model is used to identify patterns in large amounts of data and works by calculating a formula. Do you know about Slidesgeeks Predictive Analytics In The Age Of Big Data Regression Model For Predictive Analytics Elements PDF, These are perfect for delivering any kind od presentation. Using it, create PowerPoint presentations that communicate your ideas and engage audiences. Save time and effort by using our pre designed presentation templates that are perfect for a wide range of topic. Our vast selection of designs covers a range of styles, from creative to business, and are all highly customizable and easy to edit. Download as a PowerPoint template or use them as Google Slides themes.

Cloud Computing Data Performance Gap Analysis Icon Microsoft PDF
Persuade your audience using this Cloud Computing Data Performance Gap Analysis Icon Microsoft PDF. This PPT design covers three stages, thus making it a great tool to use. It also caters to a variety of topics including Cloud Computing Data, Performance Gap Analysis Icon. Download this PPT design now to present a convincing pitch that not only emphasizes the topic but also showcases your presentation skills.

Activity Analysis Ppt PowerPoint Presentation File Outfit
This is a activity analysis ppt powerpoint presentation file outfit. This is a one stage process. The stages in this process are survey, customer video contest, customer surveys, product testers, acquisition.
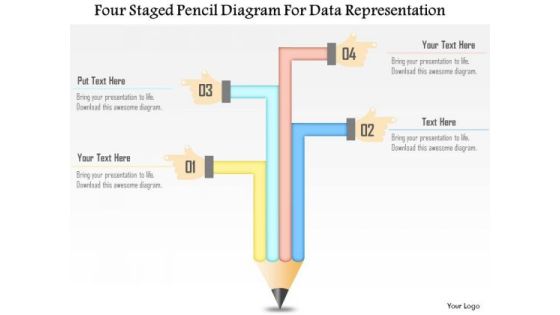
Business Diagram Four Staged Pencil Diagram For Data Representation Presentation Template
This business diagram has been designed with four staged pencil chart. This slide suitable for data representation. You can also use this slide to present four steps of any business process. Use this diagram to present your views in a wonderful manner.

Data Analysis On Excel Driven Stock Chart For Market History PowerPoint Slides Templates
Draw Out The Best In You With Our data analysis on excel driven stock chart for market history powerpoint slides Templates . Let Your Inner Brilliance Come To The Surface.
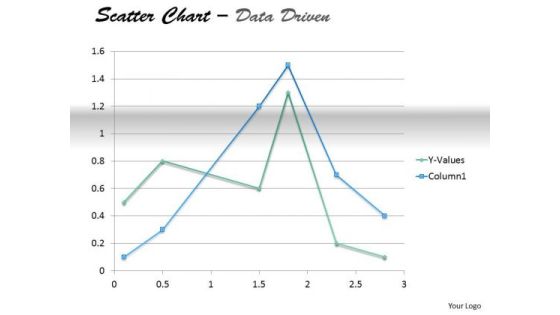
Examples Of Data Analysis Market Driven Present In Scatter Chart PowerPoint Slides Templates
Your Thoughts Will Take To Our examples of data analysis market driven present in scatter chart powerpoint slides Templates Like A Duck To Water. They Develop A Binding Affinity.

Campaign Report Ppt PowerPoint Presentation Slides Professional
This is a campaign report ppt powerpoint presentation slides professional. This is a five stage process. The stages in this process are email name, send date time, recipients, delivered, spam, opt out, open, click, transactions, revenue.

Calculating Customer Lifetime Value Clv Ppt PowerPoint Presentation Show Icon
This is a calculating customer lifetime value clv ppt powerpoint presentation show icon. This is a five stage process. The stages in this process are average acquisition cost, average customer revenue, average customer costs, average customer profit, customer retention rate.

Product Launch Marketing Budget Template Ppt PowerPoint Presentation Pictures Objects
This is a product launch marketing budget template ppt powerpoint presentation pictures objects. This is a four stage process. The stages in this process are public relations, web marketing, advertising, collateral.

Milestones For The Next Reporting Period Template Ppt PowerPoint Presentation Background Images
This is a milestones for the next reporting period template ppt powerpoint presentation background images. This is a six stage process. The stages in this process are jan, feb, mar, apr, may, jun.

Calculating Customer Lifetime Value Clv Ppt PowerPoint Presentation Summary
This is a calculating customer lifetime value clv ppt powerpoint presentation summary. This is a five stage process. The stages in this process are complete clv, average acquisition cost, average customer revenue, average customer costs, average customer profit, customer retention rate, likely customer profit.

 Home
Home