Project Dashboard
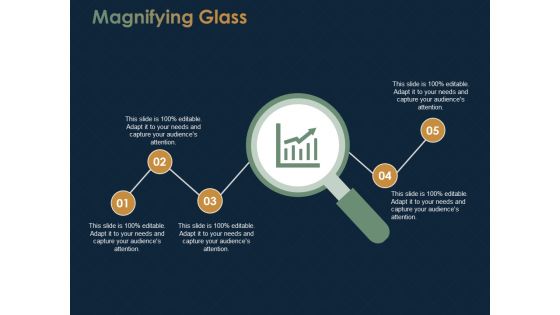
Magnifying Glass Research Ppt PowerPoint Presentation Gallery Clipart Images
This is a magnifying glass research ppt powerpoint presentation gallery clipart images. This is a five stage process. The stages in this process are magnifying glass, research, marketing, strategy, business.

Annual Performance Review Ppt PowerPoint Presentation Example Cpb
This is a annual performance review ppt powerpoint presentation example cpb. This is a four stage process. The stages in this process are annual performance review, business, management, marketing.

Magnifying Glass Research Ppt PowerPoint Presentation Infographics Example Introduction
This is a magnifying glass research ppt powerpoint presentation infographics example introduction. This is a four stage process. The stages in this process are magnifying glass, research, marketing, strategy, business.
Magnifying Glass Research Ppt PowerPoint Presentation Infographics Good
This is a magnifying glass research ppt powerpoint presentation infographics good. This is a four stage process. The stages in this process are magnifying glass, research, marketing, strategy, business.
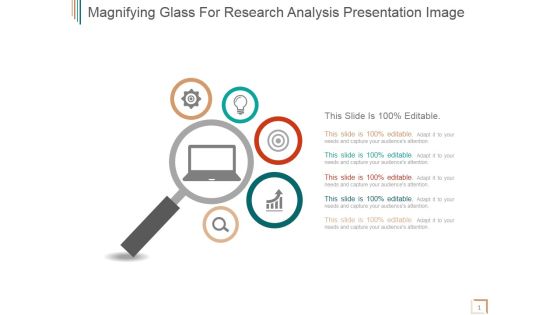
Magnifying Glass For Research Analysis Ppt PowerPoint Presentation Topics
This is a magnifying glass for research analysis ppt powerpoint presentation topics. This is a five stage process. The stages in this process are magnifying glass, research, analysis, management, strategy.
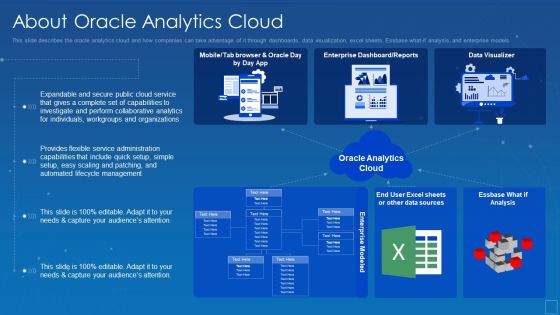
Oracle Cloud Data Analytics Administration IT About Oracle Analytics Cloud Clipart PDF
This slide describes the oracle analytics cloud and how companies can take advantage of it through dashboards, data visualization, excel sheets, Essbase what if analysis, and enterprise models. Deliver and pitch your topic in the best possible manner with this oracle cloud data analytics administration it about oracle analytics cloud clipart pdf. Use them to share invaluable insights on management, lifecycle, capabilities, service, flexible and impress your audience. This template can be altered and modified as per your expectations. So, grab it now.

Data Assimilation BI Applications Load Ppt Professional Layout Ideas PDF
This is a data assimilation bi applications load ppt professional layout ideas pdf template with various stages. Focus and dispense information on eleven stages using this creative set, that comes with editable features. It contains large content boxes to add your information on topics like visualization, dashboards, reporting, extraction, transformation. You can also showcase facts, figures, and other relevant content using this PPT layout. Grab it now.

Predictive Data Model Working Of Predictive Analytics Models Pictures PDF
This slide depicts the working of predictive analytics models that operates iteratively. The main phases in working include business understanding, data understanding, data preparation, modeling, evaluation, and deployment. Formulating a presentation can take up a lot of effort and time, so the content and message should always be the primary focus. The visuals of the PowerPoint can enhance the presenters message, so our Predictive Data Model Working Of Predictive Analytics Models Pictures PDF was created to help save time. Instead of worrying about the design, the presenter can concentrate on the message while our designers work on creating the ideal templates for whatever situation is needed. Slidegeeks has experts for everything from amazing designs to valuable content, we have put everything into Predictive Data Model Working Of Predictive Analytics Models Pictures PDF

Multi Segment Circle For Data Interpretation Powerpoint Template
This PowerPoint template has been designed with circular web diagram. This diagram is useful to display outline of a business plan. Visual effect helps in maintaining the flow of the discussion and provides more clarity to the subject.

Predictive Data Model Regression Model For Predictive Analytics Sample PDF
This slide represents the regression model of predictive analytics that is most commonly used in statistical analysis. This model is used to identify patterns in large amounts of data and works by calculating a formula. There are so many reasons you need a Predictive Data Model Regression Model For Predictive Analytics Sample PDF. The first reason is you can not spend time making everything from scratch, Thus, Slidegeeks has made presentation templates for you too. You can easily download these templates from our website easily.

Trend Line Technical Analysis Powerpoint Themes
This is a trend line technical analysis powerpoint themes. This is a five stage process. The stages in this process are complex systems, statistical modeling, uncertainty, lateral thinking, mathematical analysis.

Business Data Management Maturity With Manual Data Drudgery Ppt PowerPoint Presentation Gallery Example Introduction PDF
Persuade your audience using this business data management maturity with manual data drudgery ppt powerpoint presentation gallery example introduction pdf. This PPT design covers five stages, thus making it a great tool to use. It also caters to a variety of topics including manual data drudgery, death by dashboards, data tells a story. Download this PPT design now to present a convincing pitch that not only emphasizes the topic but also showcases your presentation skills.

Performance Sales Report Development Process Portrait PDF
The slide highlights steps to establish a sales report for effective analysis of products. Various steps included are consider report users, appropriate information, define period, compile data and double-check the data. Persuade your audience using this Performance Sales Report Development Process Portrait PDF. This PPT design covers five stages, thus making it a great tool to use. It also caters to a variety of topics including Compile Data, Appropriate Information, Consider Report Users. Download this PPT design now to present a convincing pitch that not only emphasizes the topic but also showcases your presentation skills.

Data Interpretation And Analysis Playbook Table Of Contents For Data Interpretation And Analysis Playbook Rules PDF
Deliver an awe inspiring pitch with this creative data interpretation and analysis playbook table of contents for data interpretation and analysis playbook rules pdf bundle. Topics like six critical elements, data management framework, solutions to the barriers, data management in bi projects, final thoughts can be discussed with this completely editable template. It is available for immediate download depending on the needs and requirements of the user.

Big Data Market Forecast Ppt PowerPoint Presentation Portfolio Inspiration
This is a big data market forecast ppt powerpoint presentation portfolio inspiration. This is a five stage process. The stages in this process are business, growth, analysis, strategy, success.

Data Assimilation BI Applications Monitoring Ppt Icon Maker PDF
Presenting data assimilation bi applications monitoring ppt icon maker pdf to provide visual cues and insights. Share and navigate important information on nine stages that need your due attention. This template can be used to pitch topics like digital dashboards, business, monitoring, data warehouse, data mining. In addtion, this PPT design contains high resolution images, graphics, etc, that are easily editable and available for immediate download.

Data Assimilation Your Title Here Metrics Ppt Icon Skills PDF
This is a data assimilation your title here metrics ppt icon skills pdf template with various stages. Focus and dispense information on two stages using this creative set, that comes with editable features. It contains large content boxes to add your information on topics like kpi metrics, kpi dashboards. You can also showcase facts, figures, and other relevant content using this PPT layout. Grab it now.

Data Warehousing With Validation Cleaning And Transforming Ppt PowerPoint Presentation Professional Visuals
Presenting this set of slides with name data warehousing with validation cleaning and transforming ppt powerpoint presentation professional visuals. This is a three stage process. The stages in this process are data sources, data flow, bi results, operational system, erp, crm, sql, flat files, spredsheets, olap analysis, data mining, data visualization, reports, dashboards, alerts. This is a completely editable PowerPoint presentation and is available for immediate download. Download now and impress your audience.

Vendor Data Profile For Data Analytics Software Business Analysis Modification Toolkit Topics PDF
This is a Vendor Data Profile For Data Analytics Software Business Analysis Modification Toolkit Topics PDF template with various stages. Focus and dispense information on four stages using this creative set, that comes with editable features. It contains large content boxes to add your information on topics like Predictive Applications, Reporting Features, Security Features. You can also showcase facts, figures, and other relevant content using this PPT layout. Grab it now.
Magnifying Glass With Tax Report Ppt PowerPoint Presentation Gallery Design Templates PDF
Presenting magnifying glass with tax report ppt powerpoint presentation gallery design templates pdf to dispense important information. This template comprises three stages. It also presents valuable insights into the topics including magnifying glass with tax report. This is a completely customizable PowerPoint theme that can be put to use immediately. So, download it and address the topic impactfully.

Environmental Social And Governance Reporting Evaluation For IT Industry Icon Portrait PDF
Persuade your audience using this Environmental Social And Governance Reporting Evaluation For IT Industry Icon Portrait PDF. This PPT design covers four stages, thus making it a great tool to use. It also caters to a variety of topics including Environmental, Social, Governance Reporting Evaluation, IT Industry Icon. Download this PPT design now to present a convincing pitch that not only emphasizes the topic but also showcases your presentation skills.

Business Diagram Colored Column Chart For Result Analysis PowerPoint Slide
This Power Point diagram has been designed with graphic of column chart. It contains diagram of bar char depicting annual business progress report. Use this diagram to build professional presentations for your viewers.

Budgeting Template Ppt PowerPoint Presentation Icon Examples
This is a budgeting template ppt powerpoint presentation icon examples. This is a four stage process. The stages in this process are public relations, web marketing, advertising, press release development, microsoft as program.

Progress Layout Of A Business With Growth Funding Ppt PowerPoint Presentation Gallery Example PDF
Persuade your audience using this progress layout of a business with growth funding ppt powerpoint presentation gallery example pdf. This PPT design covers seven stages, thus making it a great tool to use. It also caters to a variety of topics including valuation, growth, dashboards. Download this PPT design now to present a convincing pitch that not only emphasizes the topic but also showcases your presentation skills.
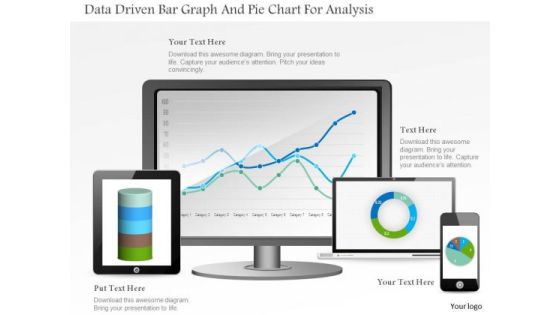
Business Diagram Data Driven Bar Graph And Pie Chart For Analysis PowerPoint Slide
This PowerPoint template displays technology gadgets with various business charts. Use this diagram slide, in your presentations to make business reports for statistical analysis. You may use this diagram to impart professional appearance to your presentations.

Analysis Icon Of Latest Market Research Trend Ppt PowerPoint Presentation File Images PDF
Persuade your audience using this analysis icon of latest market research trend ppt powerpoint presentation file images pdf. This PPT design covers one stages, thus making it a great tool to use. It also caters to a variety of topics including analysis icon of latest market research trend. Download this PPT design now to present a convincing pitch that not only emphasizes the topic but also showcases your presentation skills.
Target Market Assessment Analysis Icon Mockup PDF
Persuade your audience using this Target Market Assessment Analysis Icon Mockup PDF. This PPT design covers four stages, thus making it a great tool to use. It also caters to a variety of topics including Target Market Assessment, Analysis Icon. Download this PPT design now to present a convincing pitch that not only emphasizes the topic but also showcases your presentation skills.
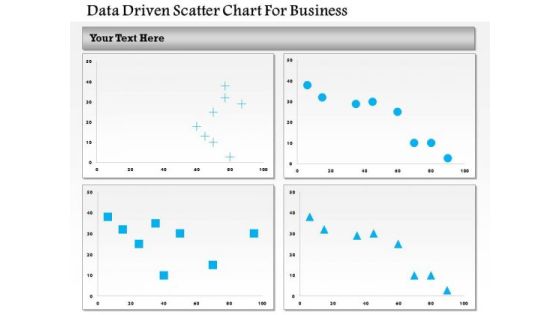
Business Diagram Data Driven Scatter Chart For Business PowerPoint Slide
This business diagram has been designed with four comparative charts. This slide suitable for data representation. You can also use this slide to present business analysis and reports. Use this diagram to present your views in a wonderful manner.

Information Management Framework For Marketing Team Summary PDF
This slide shows marketing teams data management framework. It provides information about decision making, dashboard, data integration, customer data, omni channel, customer profile, etc. Showcasing this set of slides titled Information Management Framework For Marketing Team Summary PDF. The topics addressed in these templates are Data Integration, Customer Data, Marketing Workflow. All the content presented in this PPT design is completely editable. Download it and make adjustments in color, background, font etc. as per your unique business setting.

Information Transformation Process Toolkit Data Analytics Program Checklist Mockup PDF
This slide shows progress status of data analytics process which includes important key tasks that must be performed while initiating a project. Deliver and pitch your topic in the best possible manner with this Information Transformation Process Toolkit Data Analytics Program Checklist Mockup PDF. Use them to share invaluable insights on Data Modelling, Statistical Analysis, Data Analysis and impress your audience. This template can be altered and modified as per your expectations. So, grab it now.

Business Intelligence And Big Data Analytics Program Checklist Demonstration PDF
This slide shows progress status of data analytics process which includes important key tasks that must be performed while initiating a project. This is a business intelligence and big data analytics program checklist demonstration pdf template with various stages. Focus and dispense information on one stages using this creative set, that comes with editable features. It contains large content boxes to add your information on topics like data collection, data analysis, statistical analysis, data modelling, data visualization. You can also showcase facts, figures, and other relevant content using this PPT layout. Grab it now.

Oracle Analytics Cloud Application Roles Background PDF
This slide represents the oracle analytics aloud application roles. It includes BI service administrator, BI data model author, BI content writer, BI data load, DV content writer, and DV consumer. Deliver an awe inspiring pitch with this creative oracle analytics cloud application roles background pdf bundle. Topics like administrator, content, communicate, dashboards, visualizations can be discussed with this completely editable template. It is available for immediate download depending on the needs and requirements of the user.

Corporate Intelligence Business Analysis BI Applications Ppt Gallery Background Designs PDF
Presenting corporate intelligence business analysis bi applications ppt gallery background designs pdf to provide visual cues and insights. Share and navigate important information on nine stages that need your due attention. This template can be used to pitch topics like digital dashboards, spreadsheets, data warehouse, data cleansing, data mining. In addition, this PPT design contains high-resolution images, graphics, etc, that are easily editable and available for immediate download.

Corporate Intelligence Business Analysis BI Applications Load Ppt Pictures Rules PDF
This is a corporate intelligence business analysis bi applications load ppt pictures rules pdf template with various stages. Focus and dispense information on eleven stages using this creative set, that comes with editable features. It contains large content boxes to add your information on topics like reporting, analytics, data mining, dashboards, visualization. You can also showcase facts, figures, and other relevant content using this PPT layout. Grab it now.

Business Diagram Two Tablets With Growth Bar Graph Data Driven PowerPoint Slide
This business diagram has been designed with comparative charts on tablets. This slide suitable for data representation. You can also use this slide to present business reports and information. Use this diagram to present your views in a wonderful manner.

Due Diligence For M And A Analysis Icon Ppt Inspiration Graphic Images PDF
Persuade your audience using this Due Diligence For M And A Analysis Icon Ppt Inspiration Graphic Images PDF. This PPT design covers three stages, thus making it a great tool to use. It also caters to a variety of topics including Due Diligence, M And A, Analysis Icon. Download this PPT design now to present a convincing pitch that not only emphasizes the topic but also showcases your presentation skills.
System Analysis And Design Running On Browser Icon Ppt Styles Images PDF
Persuade your audience using this System Analysis And Design Running On Browser Icon Ppt Styles Images PDF. This PPT design covers three stages, thus making it a great tool to use. It also caters to a variety of topics including System, Analysis And Design, Running Browser Icon. Download this PPT design now to present a convincing pitch that not only emphasizes the topic but also showcases your presentation skills.

Data Analysis Template Driven Stock Chart For Market Trends PowerPoint Slides Templates
Drive Your Team Along The Road To Success. Take The Wheel With Our data analysis template driven stock chart for market trends powerpoint slides Templates .

Examples Of Data Analysis Market 3d Business Trend Series Chart PowerPoint Templates
Duct It Through With Our examples of data analysis market 3d business trend series chart Powerpoint Templates . Your Ideas Will Reach Into Their Minds Intact.

What Is Big Data Ppt PowerPoint Presentation Styles Background
This is a what is big data ppt powerpoint presentation styles background. This is a one stage process. The stages in this process are big data, data analysis, business, marketing, management.

Benefits Of Data Analysis Ppt Powerpoint Show
This is a benefits of data analysis ppt powerpoint show. This is a five stage process. The stages in this process are r three is data rich, report opportunistic, testing the entire populations versus sample, date analysis increases effectiveness and efficiency, effective for working remotely or on site, easier to share information electronically than via hardcopy reports.

Implementation Of Data Governance Framework Big Data Integration Ideas PDF
This architecture states that data will be extracted from several source systems and then the data will be transformed and loaded into Hadoop Data Warehouse. End-user visualizations, reports and queries are run on top of this Data Warehouse.Deliver and pitch your topic in the best possible manner with this Implementation Of Data Governance Framework Big Data Integration Ideas PDF. Use them to share invaluable insights on Dashboards, Warehouse Storage, Clickstream Weblogs and impress your audience. This template can be altered and modified as per your expectations. So, grab it now.

Predictive Analytics In The Age Of Big Data Introduction To Predictive Analytics Technology Background PDF
This slide represents the predictive analytics introduction that is used for forecasts action, behaviors, and trends using recent and past information. It performs the operations such as data mining, text analytics, statistics, and modeling on structured and unstructured data. Get a simple yet stunning designed Predictive Analytics In The Age Of Big Data Introduction To Predictive Analytics Technology Background PDF. It is the best one to establish the tone in your meetings. It is an excellent way to make your presentations highly effective. So, download this PPT today from Slidegeeks and see the positive impacts. Our easy to edit Predictive Analytics In The Age Of Big Data Introduction To Predictive Analytics Technology Background PDF can be your go to option for all upcoming conferences and meetings. So, what are you waiting for Grab this template today.
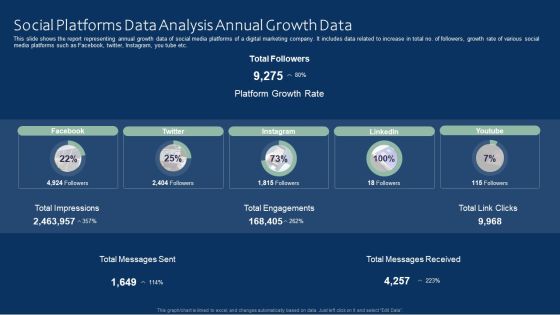
Social Platforms Data Analysis Annual Growth Data Ideas PDF
This slide shows the report representing annual growth data of social media platforms of a digital marketing company. It includes data related to increase in total no. of followers, growth rate of various social media platforms such as Facebook, twitter, Instagram, you tube etc. Pitch your topic with ease and precision using this Social Platforms Data Analysis Annual Growth Data Ideas PDF. This layout presents information on Social Platforms Data Analysis, Annual Growth Data. It is also available for immediate download and adjustment. So, changes can be made in the color, design, graphics or any other component to create a unique layout.

Business Diagram Tablet With Pie And Business Bar Graph For Result Analysis PowerPoint Slide
This PowerPoint template displays technology gadgets with various business charts. Use this diagram slide, in your presentations to make business reports for statistical analysis. You may use this diagram to impart professional appearance to your presentations.
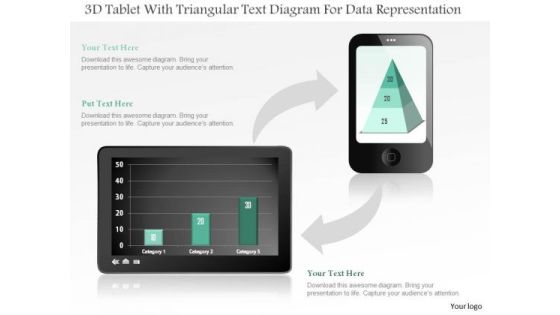
Business Diagram 3d Tablet With Triangular Text Diagram For Data Representation PowerPoint Slide
This business diagram displays bar graph on tablet and pyramid chart on mobile phone. Use this diagram, to make reports for interactive business presentations. Create professional presentations using this diagram.
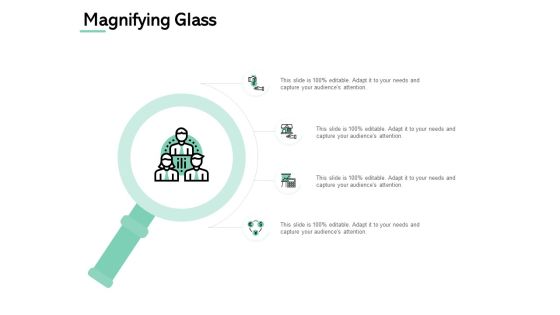
Magnifying Glass Data Analysis Ppt PowerPoint Presentation Styles Images
Presenting this set of slides with name magnifying glass data analysis ppt powerpoint presentation styles images. This is a four stage process. The stages in this process are technology, marketing, planning, business, management. This is a completely editable PowerPoint presentation and is available for immediate download. Download now and impress your audience.
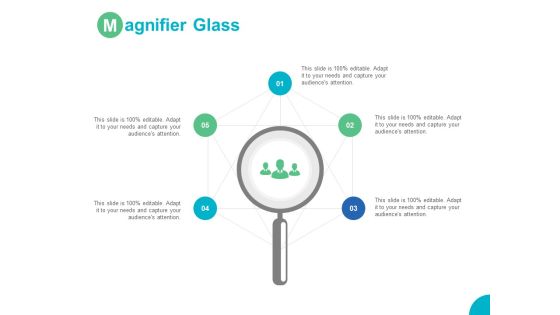
Magnifier Glass Data Analysis Ppt PowerPoint Presentation Model Elements
Presenting this set of slides with name magnifier glass data analysis ppt powerpoint presentation model elements. This is a five stage process. The stages in this process are technology, marketing, planning, business, management. This is a completely editable PowerPoint presentation and is available for immediate download. Download now and impress your audience.

Magnifying Glass Big Data Analysis Ppt PowerPoint Presentation Diagram Templates
Presenting this set of slides with name magnifying glass big data analysis ppt powerpoint presentation diagram templates. This is a four stage process. The stages in this process are technology, marketing, planning, business, management. This is a completely editable PowerPoint presentation and is available for immediate download. Download now and impress your audience.

Data And Analytics Ppt PowerPoint Presentation Icon Layouts Cpb
This is a data and analytics ppt powerpoint presentation icon layouts cpb. This is a five stage process. The stages in this process are data and analytics.
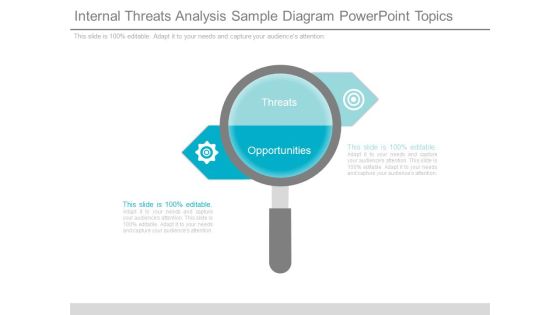
Internal Threats Analysis Sample Diagram Powerpoint Topics
This is a Internal Threats Analysis Sample Diagram Powerpoint Topics. This is a two stage process. The stages in this process are threats, opportunities.
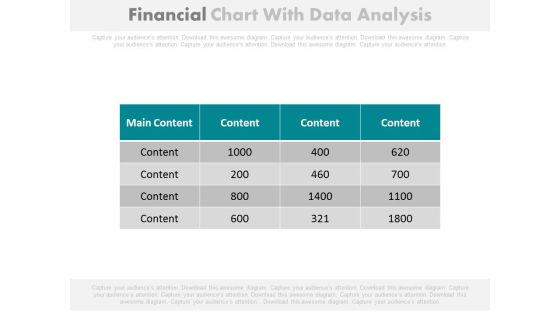
Financial Figures Data Analysis Report Powerpoint Slides
Our above PowerPoint template contains table chart with financial figures. This professional slide may be used to display data analysis report. Enlighten your audience with your breathtaking ideas.
Risk Analysis Vector Icon Ppt Powerpoint Presentation Infographics File Formats
This is a risk analysis vector icon ppt powerpoint presentation infographics file formats. This is a four stage process. The stages in this process are feedback loop icon, evaluation icon, assessment icon.

Activity Analysis Ppt PowerPoint Presentation Professional Picture
This is a activity analysis ppt powerpoint presentation professional picture. This is a one stage process. The stages in this process are survey, customer surveys, product testers, acquisition, idea collection.
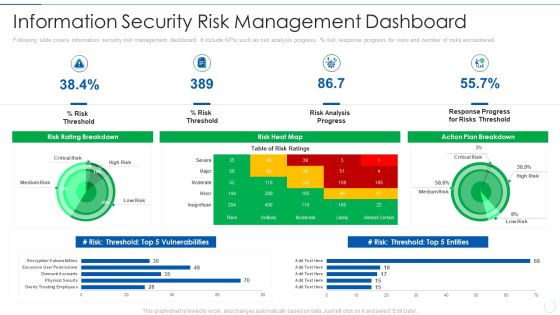
Effective IT Risk Management Process Information Security Risk Management Brochure PDF
Following slide covers information security risk management dashboard. It include KPIs such as risk analysis progress, percentage risk, response progress for risks and number of risks encountered. Deliver an awe inspiring pitch with this creative effective it risk management process information security risk management brochure pdf bundle. Topics like analysis, plan, risk, progress can be discussed with this completely editable template. It is available for immediate download depending on the needs and requirements of the user.

Predictive Data Model Uses Of Predictive Analytics Underwriting Clipart PDF
This slide represents the application of predictive analytics in underwriting by insurance companies. Predictive analytics help them identify future claims by analyzing policyholders historical data patterns and existing risk collection. Crafting an eye-catching presentation has never been more straightforward. Let your presentation shine with this tasteful yet straightforward Predictive Data Model Uses Of Predictive Analytics Underwriting Clipart PDF template. It offers a minimalistic and classy look that is great for making a statement. The colors have been employed intelligently to add a bit of playfulness while still remaining professional. Construct the ideal Predictive Data Model Uses Of Predictive Analytics Underwriting Clipart PDF that effortlessly grabs the attention of your audience Begin now and be certain to wow your customers

Global Environmental And Market Trends Retail Market Trends Ppt PowerPoint Presentation Styles Information
This is a global environmental and market trends retail market trends ppt powerpoint presentation styles information. This is a eight stage process. The stages in this process are icons, management, strategy, analysis, marketing.

Table Of Contents For Information Technology Infrastructure Library Framework ITIL Budget Microsoft PDF
Presenting table of contents for information technology infrastructure library framework itil budget microsoft pdf to provide visual cues and insights. Share and navigate important information on three stages that need your due attention. This template can be used to pitch topics like implementation, pricing, budget, dashboard, financial. In addtion, this PPT design contains high resolution images, graphics, etc, that are easily editable and available for immediate download.

Post It Ppt PowerPoint Presentation Portfolio Shapes
This is a post it ppt powerpoint presentation portfolio shapes. This is a four stage process. The stages in this process are business, strategy, analysis, marketing, post it.

Business Analysis Data Monitoring Vector Icon Ppt Powerpoint Presentation Ideas Design Ideas
This is a business analysis data monitoring vector icon ppt powerpoint presentation ideas design ideas. This is a one stage process. The stages in this process are feedback loop icon, evaluation icon, assessment icon.

 Home
Home