Progress Infographic

Real Time Assessment Of Security Threats Benchmarking With Security Operations Maturity Model Infographics PDF
This slide focuses on the SOMM which measures the current security posture and understand the progress of operations readiness by visibility improvement, threats identification, etc. Presenting real time assessment of security threats benchmarking with security operations maturity model infographics pdf to provide visual cues and insights. Share and navigate important information on three stages that need your due attention. This template can be used to pitch topics like centralized forensic visibility, mean time to detect, mean time to respond. In addtion, this PPT design contains high resolution images, graphics, etc, that are easily editable and available for immediate download.
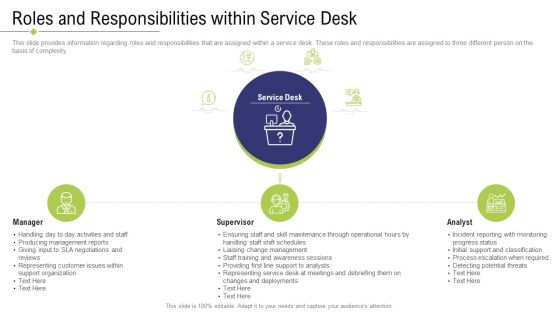
Technology Facility Maintenance And Provider Roles And Responsibiliies Within Service Desk Ppt Infographics Display PDF
This slide provides information regarding roles and responsibilities that are assigned within a service desk. These roles and responsibilities are assigned to three different person on the basis of complexity. This is a technology facility maintenance and provider roles and responsibiliies within service desk ppt infographics display pdf template with various stages. Focus and dispense information on three stages using this creative set, that comes with editable features. It contains large content boxes to add your information on topics like support organization, producing management reports, potential threats, progress status, process escalation when required . You can also showcase facts, figures, and other relevant content using this PPT layout. Grab it now.

Things To Consider While Implementing Business Product Line Diversity Infographics PDF
The following slide highlights factors considered while implementing product line extensions. It includes components such as monitoring the progress of current product lines, gathering customer feedback, evaluating competition, monitoring finances and resources available, considering product exclusivity, etc. Presenting Things To Consider While Implementing Business Product Line Diversity Infographics PDF to dispense important information. This template comprises five stages. It also presents valuable insights into the topics including Gather Customer Feedback, Evaluate Competition, Consider Product Exclusivity. This is a completely customizable PowerPoint theme that can be put to use immediately. So, download it and address the topic impactfully.

Transformation Plan Key Steps For Business Process Transition Ppt PowerPoint Presentation Gallery Infographics PDF
This slide highlights the essential steps of business process modification. It also covers major activities to be performed in each stage along with the progress reviews for successful project completion. Deliver an awe inspiring pitch with this creative Transformation Plan Key Steps For Business Process Transition Ppt PowerPoint Presentation Gallery Infographics PDF bundle. Topics like Identity Team, Project Set Up, Risk Management can be discussed with this completely editable template. It is available for immediate download depending on the needs and requirements of the user.
Three Months New Technical Officer Manager Plan Ppt Icon Infographics PDF
This slide shows 3 months plan for new chief technical officer to make improvements in technical side. It includes 30 60 90 days activities like getting familiar to employees, monitoring progress and making reports. Pitch your topic with ease and precision using this Three Months New Technical Officer Manager Plan Ppt Icon Infographics PDF. This layout presents information on First 30 Days, 30 60 Days,60 90 Days. It is also available for immediate download and adjustment. So, changes can be made in the color, design, graphics or any other component to create a unique layout.

Social Media Management Plan For Effective Performance Ppt Infographics Background Images PDF
Following slide exhibits social media management strategy with analytics and auditing. It includes major elements such as- tracking progress and test results, gather data to map success and targets etc. Showcasing this set of slides titled social media management plan for effective performance ppt infographics background images pdf. The topics addressed in these templates are strategy, analytics, adjust, goals, audit. All the content presented in this PPT design is completely editable. Download it and make adjustments in color, background, font etc. as per your unique business setting.

Risk Analysis Strategies For Real Estate Construction Project Project Risk Monitoring And Reporting Infographics PDF
This slide shows dashboard covering overall progress report of construction project by tracking cost reduction, procurement ROI, and top suppliers. Deliver and pitch your topic in the best possible manner with this risk analysis strategies for real estate construction project project risk monitoring and reporting infographics pdf. Use them to share invaluable insights on cost of purchase, cost reduction, cost saving, cost avoidance, procurement roi and impress your audience. This template can be altered and modified as per your expectations. So, grab it now.

Coordinating Distinct Activities For Effective Project Time Management Prioritizing Tasks Using Eisenhower Matrix Infographics PDF
This slide represents the project task list to track progress and create schedule accordingly which includes registration date, description, responsible person, due date, status and other comments.This is a Coordinating Distinct Activities For Effective Project Time Management Prioritizing Tasks Using Eisenhower Matrix Infographics PDF template with various stages. Focus and dispense information on four stages using this creative set, that comes with editable features. It contains large content boxes to add your information on topics like Important Urgent, Communicate With Friends, Copier Repaired You can also showcase facts, figures, and other relevant content using this PPT layout. Grab it now.

Program Project Management Report With Task List Ppt Infographics Examples PDF
This slide contains the tasks to be done under a project with the person assigned to the every task separately for the eliminating chaos and smooth workflow in an organization programme. It also includes the task priority, status and progress report. Pitch your topic with ease and precision using this Program Project Management Report With Task List Ppt Infographics Examples PDF. This layout presents information on Opening Meeting, Brainstorming Session, Media Engagement. It is also available for immediate download and adjustment. So, changes can be made in the color, design, graphics or any other component to create a unique layout.

Digital Technology Solutions For Building Industry Ppt PowerPoint Presentation File Infographics PDF
The following slide showcases digital solutions for construction industry to track progress online, give real-time status updates and record number of working hours etc. It includes components such as design management, scheduling, materials management, crew tracking and quality control etc. Showcasing this set of slides titled Digital Technology Solutions For Building Industry Ppt PowerPoint Presentation File Infographics PDF. The topics addressed in these templates are Design Management, Scheduling, Materials Management. All the content presented in this PPT design is completely editable. Download it and make adjustments in color, background, font etc. as per your unique business setting.

Brand Recognition Overview Brand Awareness Model Hierarchy Effects Theory Infographics PDF
This slide provides information regarding brand awareness model which determines the sequential progress of customer from unaware stage to product purchase stage in terms of cognitive, affective and conative. From laying roadmaps to briefing everything in detail, our templates are perfect for you. You can set the stage with your presentation slides. All you have to do is download these easy-to-edit and customizable templates. Brand Recognition Overview Brand Awareness Model Hierarchy Effects Theory Infographics PDF will help you deliver an outstanding performance that everyone would remember and praise you for. Do download this presentation today.

Deploying XP Practices To Enhance Operational Efficiency Courage Value Of Extreme Programming Infographics PDF
This slide describes the courage value of extreme programming which includes providing courage to developers, being transparent about the progress of a project in an organization.This Deploying XP Practices To Enhance Operational Efficiency Courage Value Of Extreme Programming Infographics PDF is perfect for any presentation, be it in front of clients or colleagues. It is a versatile and stylish solution for organizing your meetings. The Deploying XP Practices To Enhance Operational Efficiency Courage Value Of Extreme Programming Infographics PDF features a modern design for your presentation meetings. The adjustable and customizable slides provide unlimited possibilities for acing up your presentation. Slidegeeks has done all the homework before launching the product for you. So, do not wait, grab the presentation templates today.

Workforce Growth And Improvement Metrics To Track Effectiveness Of Mentoring Programme Infographics PDF
This slide showcases metrics that can help organization to track the success and effectiveness and mentoring programme. It include KPIs related to engagement, programme progress and business objectives. Welcome to our selection of the Workforce Growth And Improvement Metrics To Track Effectiveness Of Mentoring Programme Infographics PDF. These are designed to help you showcase your creativity and bring your sphere to life. Planning and Innovation are essential for any business that is just starting out. This collection contains the designs that you need for your everyday presentations. All of our PowerPoints are 100 percent editable, so you can customize them to suit your needs. This multi-purpose template can be used in various situations. Grab these presentation templates today.

Services Promotion Investor Financing Elevator Overview Of Firm As Online Services Provider Infographics PDF
This slide caters details about firm as a service provider in terms of firm background, mission statement and how firm is progressing. Deliver and pitch your topic in the best possible manner with this services promotion investor financing elevator overview of firm as online services provider infographics pdf. Use them to share invaluable insights on firm background, mission statement, revenue progression and impress your audience. This template can be altered and modified as per your expectations. So, grab it now.

Product USP Product Capability Assessment Gantt Chart Ppt Infographics Pictures PDF
The Schedule of the Product Capability assessment process can be shown through this Gantt chart provided in the slide. Elucidate your project plan using our product usp product capability assessment gantt chart ppt infographics pictures pdf. Capture the timeframe for every release by outlining crucial details like project beginning and end date, status, and assigned team. Establish coordination with other team members, share your product plans, and discuss the project progress with the executives using this template. Furthermore, this task management chart helps you align your activities efficiently. Utilize the versatile nature of this template to initiate high-level resource planning and implement it flexibly for the benefit of your business. The slide is easy-to-edit so download it and schedule your projects resourcefully.

Go To Market Strategy With Sales Engagement Ppt PowerPoint Presentation Infographics Sample PDF
Presenting this set of slides with name go to market strategy with sales engagement ppt powerpoint presentation infographics sample pdf. This is a eight stage process. The stages in this process are create buyer personas, build a conversion strategy, create an email nurturing workflow, social media, set up the right analytics and marketing automation, use progressive profiling, content marketing strategy, sales engagement strategy. This is a completely editable PowerPoint presentation and is available for immediate download. Download now and impress your audience.
Arrows With Icons For Success Steps PowerPoint Templates
Our above business slide contains arrows Infographics. This slide can be used to present progress steps. Capture the attention of your audience with this slide.

Decentralization App Development Build Dapp On The Tron Blockchain Platform Infographics PDF
This slide depicts the procedures required in constructing decentralised apps on the Tron blockchain platform, beginning with the creation of a smart contract and progressing through various steps. This Decentralization App Development Build Dapp On The Tron Blockchain Platform Infographics PDF from Slidegeeks makes it easy to present information on your topic with precision. It provides customization options, so you can make changes to the colors, design, graphics, or any other component to create a unique layout. It is also available for immediate download, so you can begin using it right away. Slidegeeks has done good research to ensure that you have everything you need to make your presentation stand out. Make a name out there for a brilliant performance.

Ten Stages Process With Business Plan And International Diversification Ppt PowerPoint Presentation Infographics Slide PDF
Presenting ten stages process with business plan and international diversification ppt powerpoint presentation infographics slide pdf to dispense important information. This template comprises ten stages. It also presents valuable insights into the topics including progress, global expansion, tools analyzing, design strategy, implement. This is a completely customizable PowerPoint theme that can be put to use immediately. So, download it and address the topic impactfully.

Dashboard Showing Project Status Of Business Ppt PowerPoint Presentation Infographics Graphics Download PDF
Pitch your topic with ease and precision using this dashboard showing project status of business ppt powerpoint presentation infographics graphics download pdf. This layout presents information on task, cost, progress, workload, percent complete, actual. It is also available for immediate download and adjustment. So, changes can be made in the color, design, graphics or any other component to create a unique layout.

Five Steps Star Layout For Communication Process Ppt PowerPoint Presentation Infographics Skills PDF
Presenting this set of slides with name five steps star infographic for risk analysis ppt powerpoint presentation inspiration background images pdf. This is a five stage process. The stages in this process are understanding, remembering, evaluating, feedback, receiving. This is a completely editable PowerPoint presentation and is available for immediate download. Download now and impress your audience.

Bliss Investor Capital Raising Elevator Pitch Deck Presenting Services Offered By Bliss Technology Infographics PDF
This slide shows the services offered by our platform which includes real time code evaluation, highlights reports regarding software development progress, detects bugs, etc.This is a Bliss Investor Capital Raising Elevator Pitch Deck Presenting Services Offered By Bliss Technology Infographics PDF template with various stages. Focus and dispense information on two stages using this creative set, that comes with editable features. It contains large content boxes to add your information on topics like Communicates Software, Development Progress, Technology Customizable You can also showcase facts, figures, and other relevant content using this PPT layout. Grab it now.
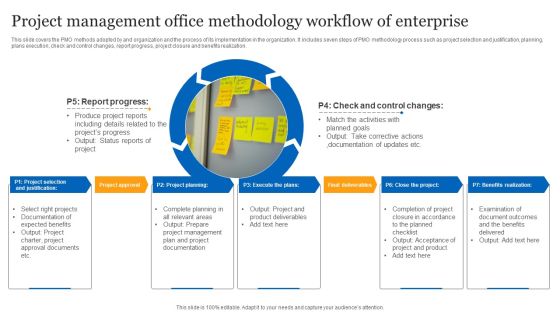
Project Management Office Methodology Workflow Of Enterprise Ppt Show Infographics PDF
This slide covers the PMO methods adopted by and organization and the process of its implementation in the organization. It includes seven steps of PMO methodology process such as project selection and justification, planning, plans execution, check and control changes, report progress, project closure and benefits realization. Showcasing this set of slides titled Project Management Office Methodology Workflow Of Enterprise Ppt Show Infographics PDF. The topics addressed in these templates are Report Progress, Check And Control, Project Approval. All the content presented in this PPT design is completely editable. Download it and make adjustments in color, background, font etc. as per your unique business setting.

Amalgamation Marketing Pitch Deck Impact Of Choosing Right Mix Of Multi Channel Marketing App Infographics PDF
This infographic shows the impact of choosing right mix of multi channel marketing which leads to better ROI, improved CTR, engagement rate, etc. Deliver an awe inspiring pitch with this creative amalgamation marketing pitch deck impact of choosing right mix of multi channel marketing app infographics pdf bundle. Topics like impact of choosing right mix of multi channel marketing can be discussed with this completely editable template. It is available for immediate download depending on the needs and requirements of the user.

Quarterly Presentation With Time Growth And Success Ppt PowerPoint Presentation Portfolio Infographics PDF
Persuade your audience using this quarterly presentation with time growth and success ppt powerpoint presentation portfolio infographics pdf. This PPT design covers five stages, thus making it a great tool to use. It also caters to a variety of topics including growth, progress, invest, success, time. Download this PPT design now to present a convincing pitch that not only emphasizes the topic but also showcases your presentation skills.
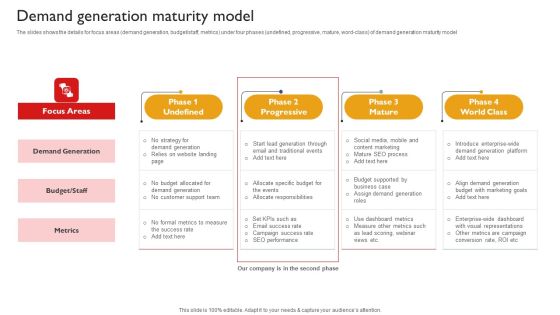
Techniques To Enhance Brand Awareness Demand Generation Maturity Model Infographics PDF
The slides shows the details for focus areas demand generation, budget staff, metrics under four phases undefined, progressive, mature, word-class of demand generation maturity model The slides shows the details for focus areas demand generation, budget staff, metrics under four phases undefined, progressive, mature, word-class of demand generation maturity model Formulating a presentation can take up a lot of effort and time, so the content and message should always be the primary focus. The visuals of the PowerPoint can enhance the presenters message, so our Techniques To Enhance Brand Awareness Demand Generation Maturity Model Infographics PDF was created to help save time. Instead of worrying about the design, the presenter can concentrate on the message while our designers work on creating the ideal templates for whatever situation is needed. Slidegeeks has experts for everything from amazing designs to valuable content, we have put everything into Techniques To Enhance Brand Awareness Demand Generation Maturity Model Infographics PDF

Five Step Circular Model Strategy Planning Diagram To Overcome Competition Infographics PDF
Persuade your audience using this five step circular model strategy planning diagram to overcome competition infographics pdf. This PPT design covers five stages, thus making it a great tool to use. It also caters to a variety of topics including growth, progress, competition. Download this PPT design now to present a convincing pitch that not only emphasizes the topic but also showcases your presentation skills.
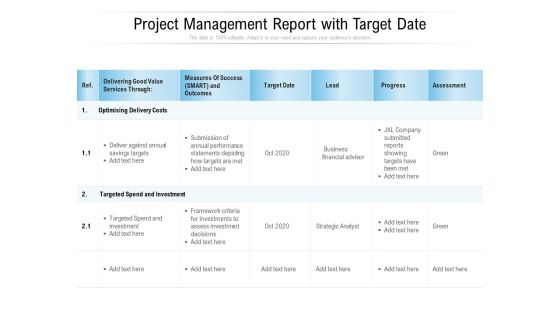
Project Management Report With Target Date Ppt PowerPoint Presentation Infographics Mockup PDF
Pitch your topic with ease and precision using this project management report with target date ppt powerpoint presentation infographics mockup pdf. This layout presents information on optimising delivery costs, targeted spend and investment, target date, lead, progress, assessment. It is also available for immediate download and adjustment. So, changes can be made in the color, design, graphics or any other component to create a unique layout.

Six Months Organization Unit Strategy Management Process Ppt Infographics Themes PDF
Introducing our six months organization unit strategy management process ppt infographics themes pdf. This PPT presentation is Google Slides compatible, therefore, you can share it easily with the collaborators for measuring the progress. Also, the presentation is available in both standard screen and widescreen aspect ratios. So edit the template design by modifying the font size, font type, color, and shapes as per your requirements. As this PPT design is fully editable it can be presented in PDF, JPG and PNG formats.

Determine Traction Addressing Firm Growth Over Years Ppt Infographics Design Ideas PDF
This slide caters details about traction addressing key milestones achieved through years by consumer electronics firm showcasing its progress. This is a determine traction addressing firm growth over years ppt infographics design ideas pdf template with various stages. Focus and dispense information on five stages using this creative set, that comes with editable features. It contains large content boxes to add your information on topics like technology, manufacturer, brand, electronics. You can also showcase facts, figures, and other relevant content using this PPT layout. Grab it now.
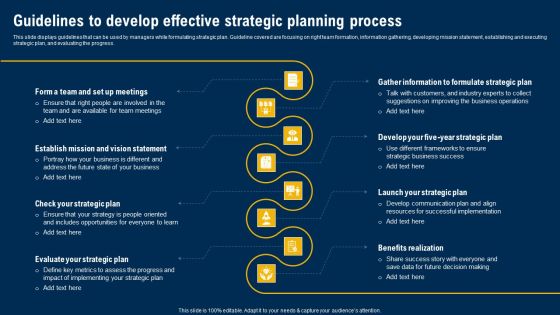
Guidelines To Develop Effective Strategic Planning Process Ultimate Guide Of Strategic Management Infographics PDF
This slide displays guidelines that can be used by managers while formulating strategic plan. Guideline covered are focusing on right team formation, information gathering, developing mission statement, establishing and executing strategic plan, and evaluating the progress.If your project calls for a presentation, then Slidegeeks is your go-to partner because we have professionally designed, easy-to-edit templates that are perfect for any presentation. After downloading, you can easily edit Guidelines To Develop Effective Strategic Planning Process Ultimate Guide Of Strategic Management Infographics PDF and make the changes accordingly. You can rearrange slides or fill them with different images. Check out all the handy templates.
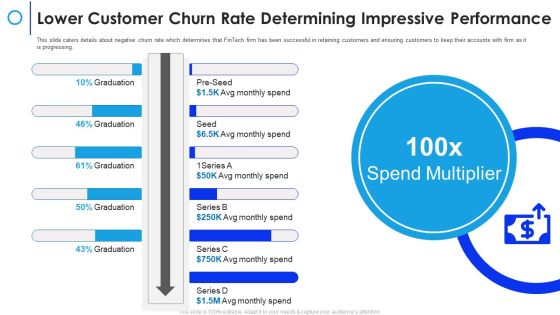
Financial Technology Firm Lower Customer Churn Rate Determining Impressive Performance Infographics PDF
This slide caters details about negative churn rate which determines that FinTech firm has been successful in retaining customers and ensuring customers to keep their accounts with firm as it is progressing. Deliver an awe inspiring pitch with this creative financial technology firm lower customer churn rate determining impressive performance infographics pdf bundle. Topics like lower customer churn rate determining impressive performance can be discussed with this completely editable template. It is available for immediate download depending on the needs and requirements of the user.

Communication Plan Project Goals Deliverables And Target Audience Ppt PowerPoint Presentation Infographics Styles PDF
The following slide illustrates the project communication plan to keep the stakeholders well informed about the progress. It includes key elements such as target audience, objectives, methods, schedule and deliverables etc.Showcasing this set of slides titled Communication Plan Project Goals Deliverables And Target Audience Ppt PowerPoint Presentation Infographics Styles PDF. The topics addressed in these templates are Execution Team, Project Deviations, Minutes Meeting. All the content presented in this PPT design is completely editable. Download it and make adjustments in color, background, font etc. as per your unique business setting.

Marketing Performance Dashboard With Analytics Campaign Ppt Infographics Background Images PDF
This slide represents dashboard for campaign performance analytics report. It covers total clicks, CTR, impressions , view-through conversions , total conversion, lead generation, activity per click etc to track campaign progress. Showcasing this set of slides titled Marketing Performance Dashboard With Analytics Campaign Ppt Infographics Background Images PDF. The topics addressed in these templates are Total Clicks, Total Impressions, Total Conversions, Activity Per Click. All the content presented in this PPT design is completely editable. Download it and make adjustments in color, background, font etc. as per your unique business setting.
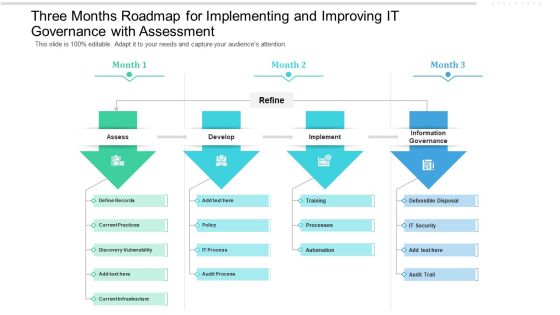
Three Months Roadmap For Implementing And Improving IT Governance With Assessment Infographics
Introducing our three months roadmap for implementing and improving it governance with assessment infographics. This PPT presentation is Google Slides compatible, therefore, you can share it easily with the collaborators for measuring the progress. Also, the presentation is available in both standard screen and widescreen aspect ratios. So edit the template design by modifying the font size, font type, color, and shapes as per your requirements. As this PPT design is fully editable it can be presented in PDF, JPG and PNG formats.

Five Years Workforce On Job Learning Roadmap With Curriculum Development Infographics
Introducing our five years workforce on job learning roadmap with curriculum development infographics. This PPT presentation is Google Slides compatible, therefore, you can share it easily with the collaborators for measuring the progress. Also, the presentation is available in both standard screen and widescreen aspect ratios. So edit the template design by modifying the font size, font type, color, and shapes as per your requirements. As this PPT design is fully editable it can be presented in PDF, JPG and PNG formats.
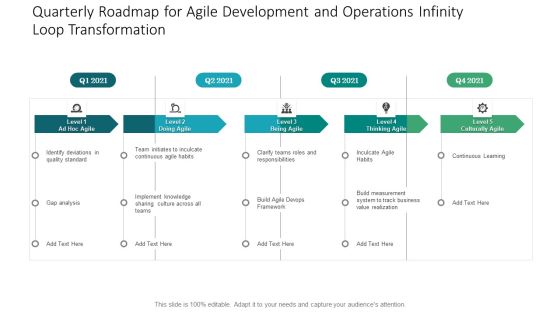
Quarterly Roadmap For Agile Development And Operations Infinity Loop Transformation Infographics
Introducing our quarterly roadmap for agile development and operations infinity loop transformation infographics. This PPT presentation is Google Slides compatible, therefore, you can share it easily with the collaborators for measuring the progress. Also, the presentation is available in both standard screen and widescreen aspect ratios. So edit the template design by modifying the font size, font type, color, and shapes as per your requirements. As this PPT design is fully editable it can be presented in PDF, JPG and PNG formats.
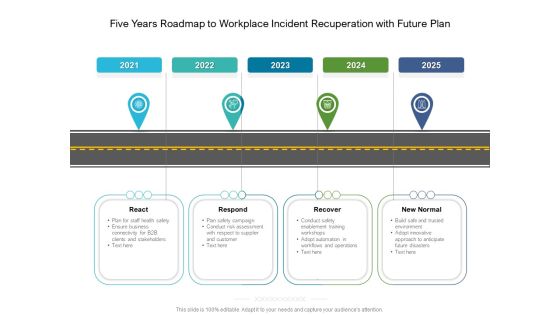
Five Years Roadmap To Workplace Incident Recuperation With Future Plan Infographics
Introducing our five years roadmap to workplace incident recuperation with future plan infographics. This PPT presentation is Google Slides compatible, therefore, you can share it easily with the collaborators for measuring the progress. Also, the presentation is available in both standard screen and widescreen aspect ratios. So edit the template design by modifying the font size, font type, color, and shapes as per your requirements. As this PPT design is fully editable it can be presented in PDF, JPG and PNG formats.
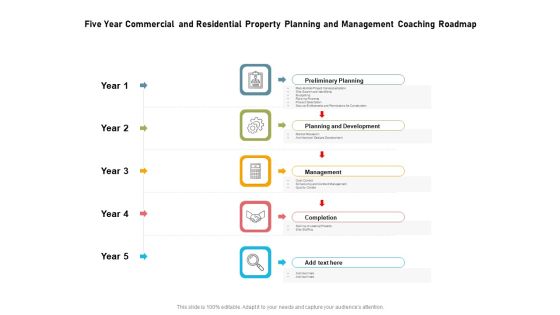
Five Year Commercial And Residential Property Planning And Management Coaching Roadmap Infographics
Introducing our five year commercial and residential property planning and management coaching roadmap infographics. This PPT presentation is Google Slides compatible, therefore, you can share it easily with the collaborators for measuring the progress. Also, the presentation is available in both standard screen and widescreen aspect ratios. So edit the template design by modifying the font size, font type, color, and shapes as per your requirements. As this PPT design is fully editable it can be presented in PDF, JPG and PNG formats.

5 Year Advantage Action Plan Roadmap For Lead Generation Activities Infographics
Introducing our 5 year advantage action plan roadmap for lead generation activities infographics. This PPT presentation is Google Slides compatible, therefore, you can share it easily with the collaborators for measuring the progress. Also, the presentation is available in both standard screen and widescreen aspect ratios. So edit the template design by modifying the font size, font type, color, and shapes as per your requirements. As this PPT design is fully editable it can be presented in PDF, JPG and PNG formats.

Six Months Multiple Product Comparison Roadmap Based On Key Metrics Infographics
Introducing our six months multiple product comparison roadmap based on key metrics infographics. This PPT presentation is Google Slides compatible, therefore, you can share it easily with the collaborators for measuring the progress. Also, the presentation is available in both standard screen and widescreen aspect ratios. So edit the template design by modifying the font size, font type, color, and shapes as per your requirements. As this PPT design is fully editable it can be presented in PDF, JPG and PNG formats.
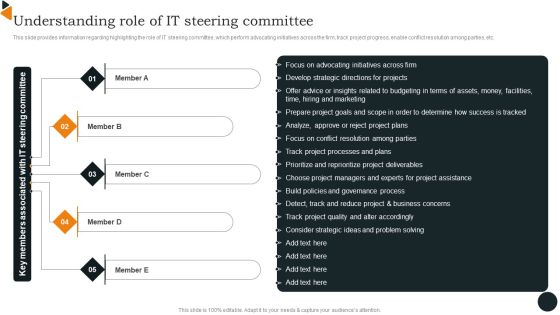
Chief Information Officers Guide On Technology Plan Understanding Role Of IT Infographics PDF
This slide provides information regarding highlighting the role of IT steering committee, which perform advocating initiatives across the firm, track project progress, enable conflict resolution among parties, etc. Do you have an important presentation coming up Are you looking for something that will make your presentation stand out from the rest Look no further than Chief Information Officers Guide On Technology Plan Understanding Role Of IT Infographics PDF. With our professional designs, you can trust that your presentation will pop and make delivering it a smooth process. And with Slidegeeks, you can trust that your presentation will be unique and memorable. So why wait Grab Chief Information Officers Guide On Technology Plan Understanding Role Of IT Infographics PDF today and make your presentation stand out from the rest.
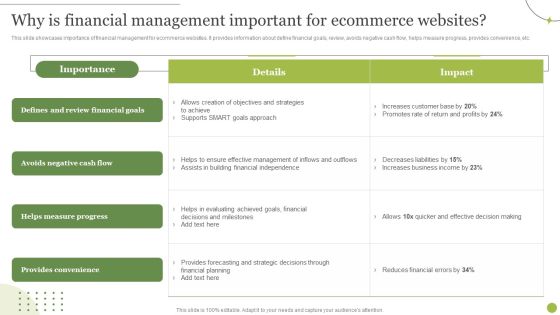
Managing E Commerce Business Accounting Why Is Financial Management Important For Ecommerce Websites Infographics PDF
This slide showcases importance of financial management for ecommerce websites. It provides information about define financial goals, review, avoids negative cash flow, helps measure progress, provides convenience, etc. Do you have to make sure that everyone on your team knows about any specific topic I yes, then you should give Managing E Commerce Business Accounting Why Is Financial Management Important For Ecommerce Websites Infographics PDF a try. Our experts have put a lot of knowledge and effort into creating this impeccable Managing E Commerce Business Accounting Why Is Financial Management Important For Ecommerce Websites Infographics PDF. You can use this template for your upcoming presentations, as the slides are perfect to represent even the tiniest detail. You can download these templates from the Slidegeeks website and these are easy to edit. So grab these today.

Implementing Lean Production Tool And Techniques Lean Manufacturing Dashboard Showcasing Infographics PDF
This slide represents lean manufacturing dashboard showcasing production progress. It covers production volume, order volume, downtime, returned item etc. Explore a selection of the finest Implementing Lean Production Tool And Techniques Lean Manufacturing Dashboard Showcasing Infographics PDF here. With a plethora of professionally designed and pre made slide templates, you can quickly and easily find the right one for your upcoming presentation. You can use our Implementing Lean Production Tool And Techniques Lean Manufacturing Dashboard Showcasing Infographics PDF to effectively convey your message to a wider audience. Slidegeeks has done a lot of research before preparing these presentation templates. The content can be personalized and the slides are highly editable. Grab templates today from Slidegeeks.

Brand Positioning And Launch Plan For Emerging Markets Best Practices To Follow Infographics PDF
It showcases best practices that can be implemented by organization before expanding through product line extension strategy. Its key elements are monitor existing product line progress, assess competition, get customer feedback and evaluate finance availability. Slidegeeks is one of the best resources for PowerPoint templates. You can download easily and regulate Brand Positioning And Launch Plan For Emerging Markets Best Practices To Follow Infographics PDF for your personal presentations from our wonderful collection. A few clicks is all it takes to discover and get the most relevant and appropriate templates. Use our Templates to add a unique zing and appeal to your presentation and meetings. All the slides are easy to edit and you can use them even for advertisement purposes.

Standard Approaches For Client Onboarding Journey Create Onboarding Checklist Infographics PDF
This slide depicts the customer onboarding checklist to track the status of tasks. The tasks covered are creating welcome emails, sharing questionnaires, schedule calls, sharing product walk-throughs, setting up follow-up reminders and measuring progress. Slidegeeks has constructed Standard Approaches For Client Onboarding Journey Create Onboarding Checklist Infographics PDF after conducting extensive research and examination. These presentation templates are constantly being generated and modified based on user preferences and critiques from editors. Here, you will find the most attractive templates for a range of purposes while taking into account ratings and remarks from users regarding the content. This is an excellent jumping-off point to explore our content and will give new users an insight into our top-notch PowerPoint Templates.
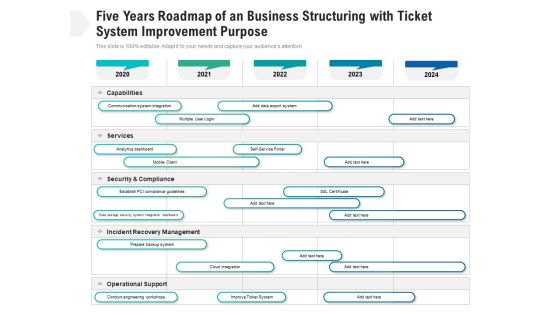
Five Years Roadmap Of An Business Structuring With Ticket System Improvement Purpose Infographics
Introducing our five years roadmap of an business structuring with ticket system improvement purpose infographics. This PPT presentation is Google Slides compatible, therefore, you can share it easily with the collaborators for measuring the progress. Also, the presentation is available in both standard screen and widescreen aspect ratios. So edit the template design by modifying the font size, font type, color, and shapes as per your requirements. As this PPT design is fully editable it can be presented in PDF, JPG and PNG formats.

Successful Initiatives To Identity And Access Management Development Plan Half Yearly Roadmap Infographics
Introducing our successful initiatives to identity and access management development plan half yearly roadmap infographics. This PPT presentation is Google Slides compatible, therefore, you can share it easily with the collaborators for measuring the progress. Also, the presentation is available in both standard screen and widescreen aspect ratios. So edit the template design by modifying the font size, font type, color, and shapes as per your requirements. As this PPT design is fully editable it can be presented in PDF, JPG and PNG formats.
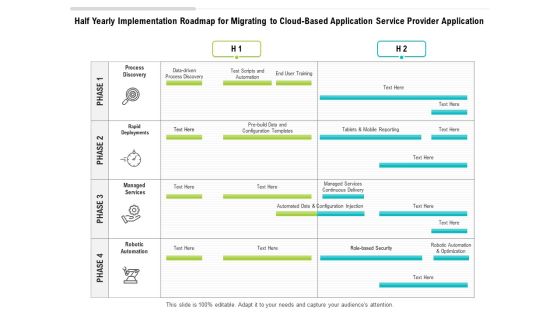
Half Yearly Implementation Roadmap For Migrating To Cloud Based Application Service Provider Application Infographics
Introducing our half yearly implementation roadmap for migrating to cloud based application service provider application infographics. This PPT presentation is Google Slides compatible, therefore, you can share it easily with the collaborators for measuring the progress. Also, the presentation is available in both standard screen and widescreen aspect ratios. So edit the template design by modifying the font size, font type, color, and shapes as per your requirements. As this PPT design is fully editable it can be presented in PDF, JPG and PNG formats.
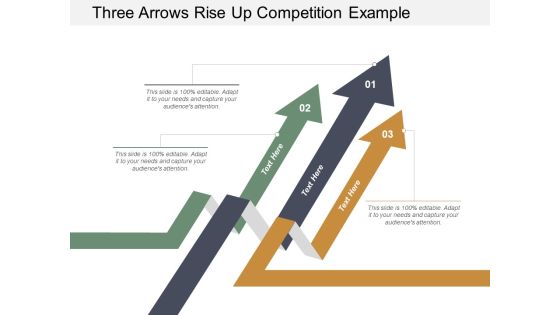
Three Arrows Rise Up Competition Example Ppt PowerPoint Presentation Infographics Ideas
This is a three arrows rise up competition example ppt powerpoint presentation infographics ideas. This is a three stage process. The stages in this process are growth, upward trends, uptrends, upward arrow.
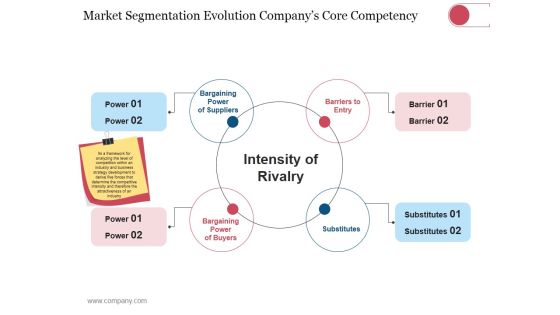
Market Segmentation Evolution Companys Core Competency Template 1 Ppt PowerPoint Presentation Infographics Styles
This is a market segmentation evolution companys core competency template 1 ppt powerpoint presentation infographics styles. This is a four stage process. The stages in this process are bargaining power of suppliers, barriers to entry, bargaining power of buyers, substitutes.

Business Growth Arrow On Blue Background Ppt PowerPoint Presentation Infographics Graphics Pictures
This is a business growth arrow on blue background ppt powerpoint presentation infographics graphics pictures. This is a four stage process. The stages in this process are rising arrow, growing arrow, increasing arrow.

Five Steps Infographics For Business Growth Ppt PowerPoint Presentation Inspiration Shapes
Presenting this set of slides with name five steps infographics for business growth ppt powerpoint presentation inspiration shapes. This is a five stage process. The stages in this process are five steps infographics for business growth. This is a completely editable PowerPoint presentation and is available for immediate download. Download now and impress your audience.

Economic Growth Arrow With Bar Graph On Human Hand Ppt PowerPoint Presentation Infographics Ideas
This is a economic growth arrow with bar graph on human hand ppt powerpoint presentation infographics ideas. This is a four stage process. The stages in this process are rising arrow, growing arrow, increasing arrow.

CIO Evolution To Improve Technology Plan For The Organization Primary Reasons Or CIO Transition Infographics PDF
This slide shows the major reasons for the transition of a CIO changes in companys direction, general dissatisfaction with technology leadership etc.Deliver and pitch your topic in the best possible manner with this CIO Evolution To Improve Technology Plan For The Organization Primary Reasons Or CIO Transition Infographics PDF Use them to share invaluable insights on General Dissatisfaction, Technology Leadership, Achieving The Objectives and impress your audience. This template can be altered and modified as per your expectations. So, grab it now.
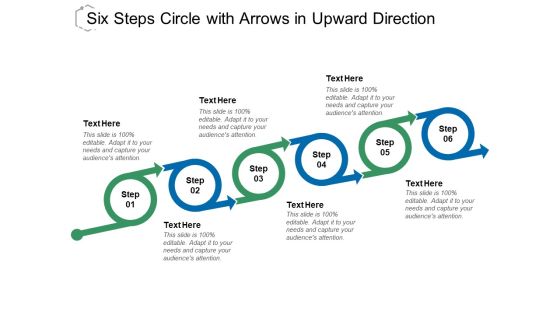
Six Steps Circle With Arrows In Upward Direction Ppt Powerpoint Presentation Infographics Outline
This is a six steps circle with arrows in upward direction ppt powerpoint presentation infographics outline. This is a six stage process. The stages in this process are executive summary, analysis summary, review summary.

Circular Puzzle To Implement Business Plan Ppt PowerPoint Presentation Infographics Professional
Presenting this set of slides with name circular puzzle to implement business plan ppt powerpoint presentation infographics professional. This is a three stage process. The stages in this process are round puzzle, continuous improvement, circular puzzle infographic. This is a completely editable PowerPoint presentation and is available for immediate download. Download now and impress your audience.
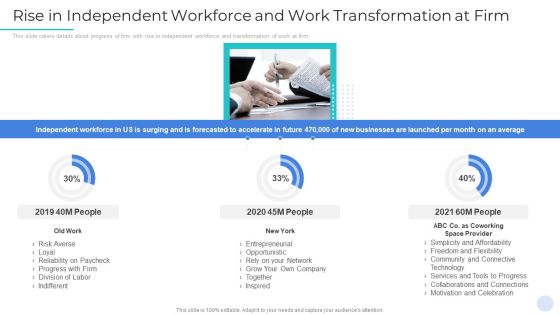
Rise In Independent Workforce And Work Transformation At Firm Infographics PDF
Deliver and pitch your topic in the best possible manner with this rise in independent workforce and work transformation at firm infographics pdf. Use them to share invaluable insights on entrepreneurial, opportunistic, rely on your network and impress your audience. This template can be altered and modified as per your expectations. So, grab it now.
Three Circles With Icons For Strategic Management Ppt PowerPoint Presentation Infographics Deck
Presenting this set of slides with name three circles with icons for strategic management ppt powerpoint presentation infographics deck. This is a three stage process. The stages in this process are 3 step circle diagram, process infographic, business goals. This is a completely editable PowerPoint presentation and is available for immediate download. Download now and impress your audience.
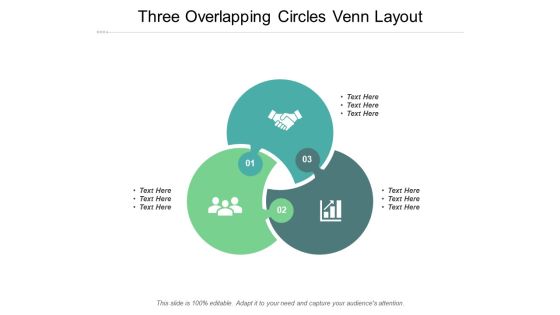
Three Overlapping Circles Venn Layout Ppt PowerPoint Presentation Infographics Designs Download
Presenting this set of slides with name three overlapping circles venn layout ppt powerpoint presentation infographics designs download. This is a three stage process. The stages in this process are 3 step circle diagram, process infographic, business goals. This is a completely editable PowerPoint presentation and is available for immediate download. Download now and impress your audience.
 Home
Home