Progress Infographic
Platform Build On Value Chain Ppt PowerPoint Presentation Infographics
This is a platform build on value chain ppt powerpoint presentation infographics. This is a five stage process. The stages in this process are business, marketing, success, management, table.

Sale And Negotiation Template 2 Ppt PowerPoint Presentation Slides Infographics
This is a sale and negotiation template 2 ppt powerpoint presentation slides infographics. This is a one stage process. The stages in this process are sale and negotiation, meeting, business, marketing, success.

Bulb With Idea Ppt PowerPoint Presentation Styles Infographics
This is a bulb with idea ppt powerpoint presentation styles infographics. This is a five stage process. The stages in this process are bulb with idea, business, marketing, success, technology.

Internal Analysis Workforce Trends Ppt PowerPoint Presentation Model Infographics
This is a internal analysis workforce trends ppt powerpoint presentation model infographics. This is a four stage process. The stages in this process are workforce trends, internal analysis, business, marketing, success.

Competitive Intelligence Template 2 Ppt PowerPoint Presentation Outline Infographics
This is a competitive intelligence template 2 ppt powerpoint presentation outline infographics. This is a seven stage process. The stages in this process are competitive intelligence, business, marketing, success, management.

Market Competitiveness Template 2 Ppt PowerPoint Presentation Model Infographics
This is a market competitiveness template 2 ppt powerpoint presentation model infographics. This is a three stage process. The stages in this process are own, key success factors, ratings, advertising, brand image.

Mobile Customer Retention Ppt PowerPoint Presentation Model Infographics
Presenting this set of slides with name mobile customer retention ppt powerpoint presentation model infographics. This is an editable Powerpoint four stages graphic that deals with topics like mobile customer retention to help convey your message better graphically. This product is a premium product available for immediate download, and is 100 percent editable in Powerpoint. Download this now and use it in your presentations to impress your audience.

Team Building Experiences Ppt PowerPoint Presentation File Infographics
Presenting this set of slides with name team building experiences ppt powerpoint presentation file infographics. This is an editable Powerpoint five stages graphic that deals with topics like team building experiences to help convey your message better graphically. This product is a premium product available for immediate download, and is 100 percent editable in Powerpoint. Download this now and use it in your presentations to impress your audience.

Content Marketing Performance Template 1 Ppt PowerPoint Presentation Styles Infographics
This is a content marketing performance template 1 ppt powerpoint presentation styles infographics. This is a eight stage process. The stages in this process are conversion rate, quality of leads, number of leads, sales revenue, website traffic, subscriber list growth, social media sharing, search engine ranking.
Six Months Cryptocurrency Technology Development Roadmap With Deployment Infographics
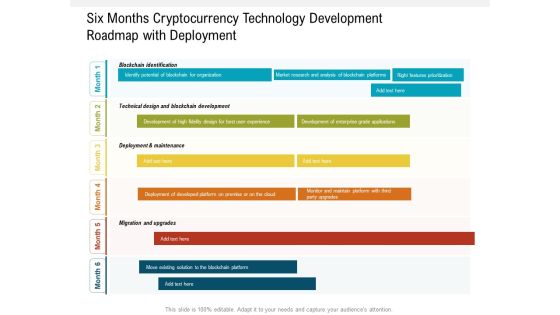
Presenting our jaw-dropping six months cryptocurrency technology development roadmap with deployment infographics. You can alternate the color, font size, font type, and shapes of this PPT layout according to your strategic process. This PPT presentation is compatible with Google Slides and is available in both standard screen and widescreen aspect ratios. You can also download this well-researched PowerPoint template design in different formats like PDF, JPG, and PNG. So utilize this visually-appealing design by clicking the download button given below.
Technical Department Six Months Roadmap For Software Development Infographics
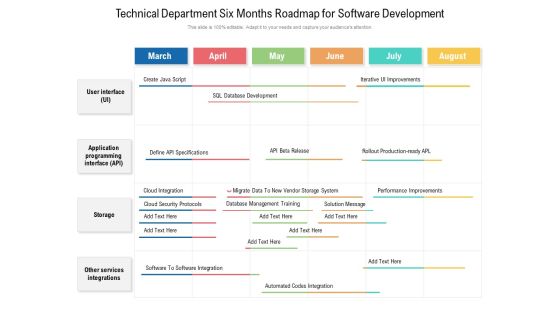
Presenting our jaw dropping technical department six months roadmap for software development infographics. You can alternate the color, font size, font type, and shapes of this PPT layout according to your strategic process. This PPT presentation is compatible with Google Slides and is available in both standard screen and widescreen aspect ratios. You can also download this well researched PowerPoint template design in different formats like PDF, JPG, and PNG. So utilize this visually appealing design by clicking the download button given below.

Six Months Disruptive Automation Testing And Development Roadmap Infographics
Presenting our jaw dropping six months disruptive automation testing and development roadmap infographics. You can alternate the color, font size, font type, and shapes of this PPT layout according to your strategic process. This PPT presentation is compatible with Google Slides and is available in both standard screen and widescreen aspect ratios. You can also download this well researched PowerPoint template design in different formats like PDF, JPG, and PNG. So utilize this visually appealing design by clicking the download button given below.
Quarterly Roadmap To Instantaneous Project Development Tracking Infographics
Presenting our jaw dropping quarterly roadmap to instantaneous project development tracking infographics. You can alternate the color, font size, font type, and shapes of this PPT layout according to your strategic process. This PPT presentation is compatible with Google Slides and is available in both standard screen and widescreen aspect ratios. You can also download this well researched PowerPoint template design in different formats like PDF, JPG, and PNG. So utilize this visually appealing design by clicking the download button given below.

Launch Monitoring And Adjustments Template 2 Ppt PowerPoint Presentation Infographics
This is a launch monitoring and adjustments template 2 ppt powerpoint presentation infographics. This is a two stage process. The stages in this process are product development maturity index, product strategy, portfolio management, process definition.

Sustaining Momentum Template 2 Ppt PowerPoint Presentation Infographics
This is a sustaining momentum template 2 ppt powerpoint presentation infographics. This is a five stage process. The stages in this process are resources for change, support system for change agents, developing new competencies, reinforcing new behaviors, staying the course.

Departments And Teams Template 2 Ppt Powerpoint Presentation Portfolio Infographics
This is a departments and teams template 2 ppt powerpoint presentation portfolio infographics. This is a three stage process. The stages in this process are jenney smith manager, miller smith developer, anita walton president.
Quarterly Incremental Development Strategic Product Manufacturing Roadmap Infographics
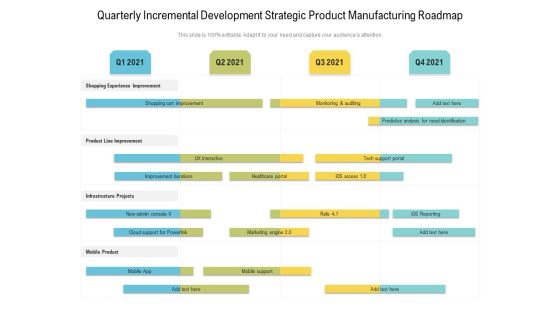
Presenting the quarterly incremental development strategic product manufacturing roadmap infographics. The template includes a roadmap that can be used to initiate a strategic plan. Not only this, the PowerPoint slideshow is completely editable and you can effortlessly modify the font size, font type, and shapes according to your needs. This PPT slide can be easily reached in standard screen and widescreen aspect ratios. The set is also available in various formats like PDF, PNG, and JPG. So download and use it multiple times as per your knowledge.
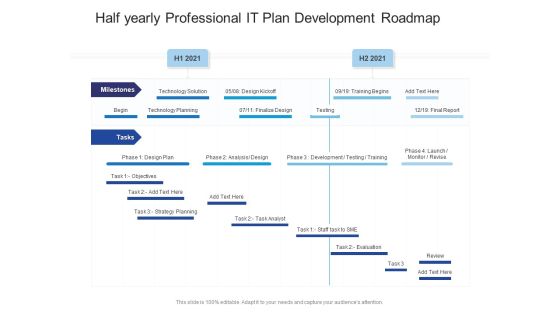
Half Yearly Professional IT Plan Development Roadmap Infographics
Presenting the half yearly professional it plan development roadmap infographics. The template includes a roadmap that can be used to initiate a strategic plan. Not only this, the PowerPoint slideshow is completely editable and you can effortlessly modify the font size, font type, and shapes according to your needs. This PPT slide can be easily reached in standard screen and widescreen aspect ratios. The set is also available in various formats like PDF, PNG, and JPG. So download and use it multiple times as per your knowledge.
Professional Skills Vector Icon Ppt PowerPoint Presentation File Infographics
Presenting this set of slides with name professional skills vector icon ppt powerpoint presentation file infographics. The topics discussed in these slides are interpersonal skills, communication skills, brain development. This is a completely editable PowerPoint presentation and is available for immediate download. Download now and impress your audience.
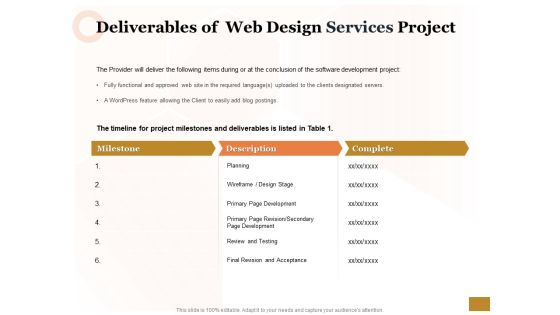
Interface Designing Services Deliverables Of Web Design Services Project Infographics
Presenting this set of slides with name interface designing services deliverables of web design services project infographics. The topics discussed in these slides are planning, design stage, primary page development, review and testing, final revision and acceptance. This is a completely editable PowerPoint presentation and is available for immediate download. Download now and impress your audience.

Business Diagram Four Staged Business Infographics Tags Presentation Template
Download this diagram to display business development strategies, business plans, decisions, and stages. This Business PowerPoint diagram contains graphics of four options text boxes with icons. Present your views using this innovative slide and be assured of leaving a lasting impression.
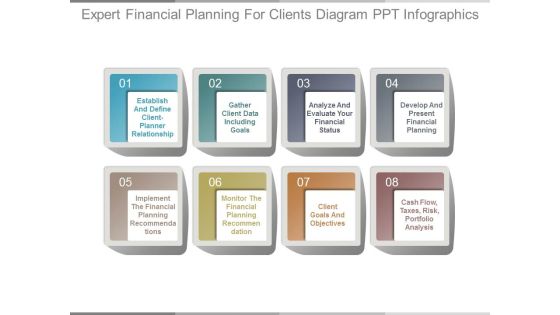
Expert Financial Planning For Clients Diagram Ppt Infographics
This is a expert financial planning for clients diagram ppt infographics. This is a ten stage process. The stages in this process are establish and define client planner relationship, gather client data including goals, analyze and evaluate your financial status, develop and present financial planning, implement the financial planning recommendations, monitor the financial planning recommendation, client goals and objectives, cash flow, taxes, risk, portfolio analysis.

Bar Graph Infographics For Business Analysis Powerpoint Template
This PowerPoint template contains bar graph with icons. This PPT slide helps to exhibit concepts like strategy, direction and success. Use this business slide to make impressive presentations.
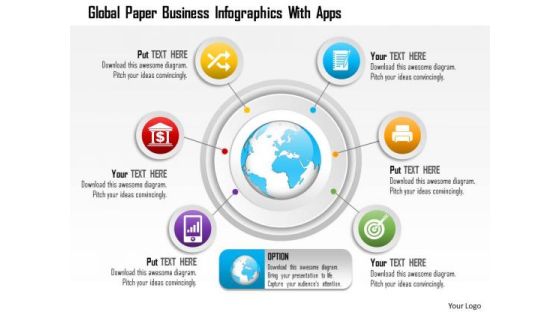
Business Diagram Global Paper Business Infographics With Apps Presentation Template
This power point template diagram has been crafted with graphic of globe and icons around. This PPT diagram contains the concept of marketing strategy and business ideas for global market. Use this PPT for business and marketing related presentations.

Business Daigram Four Staged Colored Clouds Business Infographics Presentation Templets
This business slide contains four colorful icons of cloud. Download our above diagram to express information in a visual way. Use this slide to build quality presentation for your viewers.

Bar Graph Infographics With Success Arrow Powerpoint Slides
This PowerPoint template has been designed with bar graph with success arrow. You may use this PPT slide to display goal achievement and planning. Impress your audiences by using this PPT slide.

Business Diagram Infographics Design With Five Options Presentation Template
Five staged info graphics has been used to craft this power point template diagram. This PPT diagram contains the concept of data flow and data technology. Use this PPT for business and data related presentations.
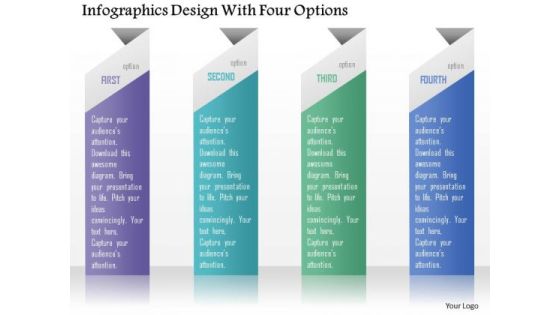
Business Diagram Infographics Design With Four Options Presentation Template
Four staged info graphics has been used to design this power point template. This PPT diagram contains the concept of data flow. Use this PPT for business and marketing data related topics in any presentation.

Business Diagram Infographics Design With Three Options Presentation Template
Three staged info graphics has been used to craft this power point template diagram. This PPT diagram contains the concept of data flow and storage. Use this PPT for business and data related presentations.

Business Diagram Infographics Design With Six Options Presentation Template
Graphic of six staged info graphics has been used to design this power point template. This PPT diagram contains the concept of data flow and representation. Use this PPT for data technology related presentations.

Modern Infographics For Global Business Strategy Powerpoint Template
Have you just gone global or have plans to do so? Nothing says it better than this PowerPoint slide. This PPT template has everything that you might need to explain your future plans and goals to your audience. The creatively designed slide is used by many multinational companies and organizations to convey to their clients and customers their future plans and strategies on an international level. The slide clearly sends out a message of Omni presence of a company. This can be your perfect slide to send out the message of win your customers trust by sending out a message that you are Omni present. The template can also be alternatively used for educational slides about communication. This can also be used to explain process that are universal in nature and happen all over the planet. The design is customizable and enough space has been left to add text to explain your plans or to describe steps of a process. \n

Business Diagram Six Staged Business Infographics Presentation Template
Six staged info graphics has been used to design this PowerPoint template. This slide can be used for text representation. Present your views using this innovative slide and be assured of leaving a lasting impression.
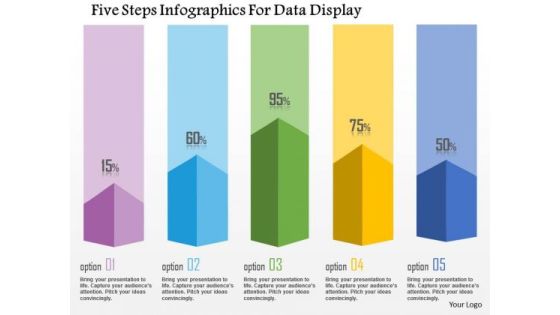
Business Diagram Five Steps Infographics For Data Display Presentation Template
This business diagram has been designed with graphic of five staged info graphics. This diagram can be used to display statistical information. Use this bar graph for your business and sales related presentations.
Business Diagram Three Staged Sequential Infographics With Icons PowerPoint Template
Three staged sequential info graphic with icons has been used to design this power point template. This PPT contains the concept of data flow. Use this PPT diagram to show marketing and business data in any presentation.

Business Diagram Colorful Infographics For Data Representation Presentation Template
This power point template diagram has been crafted with graphic of colorful info graphics. This PPT diagram contains the concept of analysis and data representations. Use this PPT for marketing and business related presentations.

Business Diagram Four Staged Infographics Arrow Diagram Presentation Template
Graphic of four staged info graphics arrow diagram has been used to craft this power point template diagram. This PPT diagram contains the concept of data and text representation. Use this PPT for marketing and business related presentations.

Business Diagram Five Staged Infographics With Stand Design PowerPoint Template
Five staged info graphics with stand has been used to craft this power point template. This PPT contains the concept of data flow. Use this PPT slide for your sales and business data related presentations.

Business Diagram Five Staged Infographics For Text Representation Presentation Template
Five staged info graphics has been used to design this PowerPoint template. This slide can be used for text representation. Present your views using this innovative slide and be assured of leaving a lasting impression.
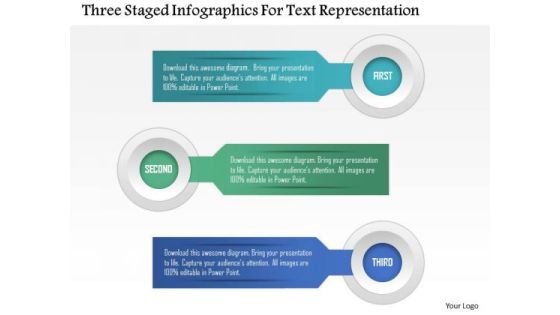
Business Diagram Three Staged Infographics For Text Representation Presentation Template
Three staged info graphics has been used to design this PowerPoint template. This slide can be used for text representation. Present your views using this innovative slide and be assured of leaving a lasting impression.

Business Infographics Cycle Of Five Steps Powerpoint Template
Our above business slide has been designed with cycle diagram of five options. This slide is suitable to present business management and strategy. Use our creative PowerPoint template to lay down your views.

Interviewing Tips Managers Ppt PowerPoint Presentation Show Infographics Cpb
Presenting this set of slides with name interviewing tips managers ppt powerpoint presenta. This is an editable Powerpoint four stages graphic that deals with topics like interviewing tips managers to help convey your message better graphically. This product is a premium product available for immediate download and is 100 percent editable in Powerpoint. Download this now and use it in your presentations to impress your audience.

Business Diagram 3d Circular Infographics With Target Achievement PowerPoint Template
This power point template has been crafted with graphic of 3d circular info graphics. This PPT slide contains the concept of data representation and target achievement. This PPT can be used for target and success related presentations.

Circular Infographics For Financial Idea Generation Powerpoint Template
Our professionally designed circle diagram is as an effective tool for communicating financial ideas. It contains circle design with finance icons. Convey your views with this diagram slide. It will amplify the strength of your logic.
Modifying Banking Functionalities Dashboard Tracking Customer Satisfaction Score Infographics PDF
This slide contains dashboard that depicts the overall customer satisfaction into quantitative form. Deliver an awe inspiring pitch with this creative enhancing financial institution operations dashboard tracking customer satisfaction score icons pdf bundle. Topics like dashboard tracking customer satisfaction score can be discussed with this completely editable template. It is available for immediate download depending on the needs and requirements of the user.

Guide To Overseas Expansion Plan For Corporate Entity Target Market Size And Growth Rate Ppt Infographics Infographics PDF
Deliver and pitch your topic in the best possible manner with this guide to overseas expansion plan for corporate entity target market size and growth rate ppt infographics infographics pdf. Use them to share invaluable insights on target market size and growth rate and impress your audience. This template can be altered and modified as per your expectations. So, grab it now.

SPI Methodology Project Improvement Milestone Schedule Ppt PowerPoint Presentation File Infographics PDF
This slide provides the glimpse about the project improvement milestone schedule which focuses on various process areas such as project kick off, initial assessment, process areas implementation, progress assessment, formal project assessment and project closeout. Deliver and pitch your topic in the best possible manner with this spi methodology project improvement milestone schedule ppt powerpoint presentation file infographics pdf. Use them to share invaluable insights on process areas, implementation and support, project assessment, progress assessment and impress your audience. This template can be altered and modified as per your expectations. So, grab it now.
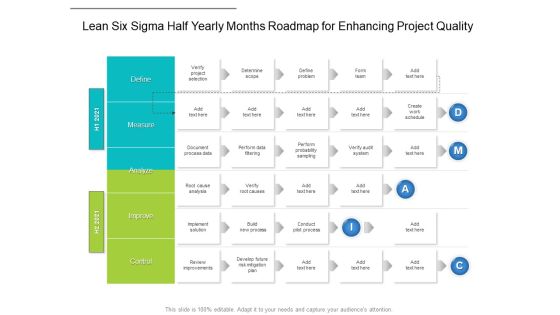
Lean Six Sigma Half Yearly Months Roadmap For Enhancing Project Quality Infographics
Presenting our innovatively structured lean six sigma half yearly months roadmap for enhancing project quality infographics Template. Showcase your roadmap process in different formats like PDF, PNG, and JPG by clicking the download button below. This PPT design is available in both Standard Screen and Widescreen aspect ratios. It can also be easily personalized and presented with modified font size, font type, color, and shapes to measure your progress in a clear way.
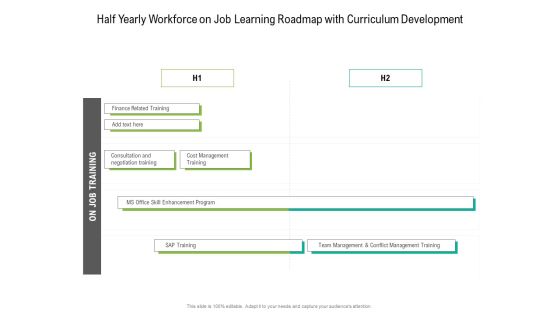
Half Yearly Workforce On Job Learning Roadmap With Curriculum Development Infographics
Presenting our innovatively structured half yearly workforce on job learning roadmap with curriculum development infographics Template. Showcase your roadmap process in different formats like PDF, PNG, and JPG by clicking the download button below. This PPT design is available in both Standard Screen and Widescreen aspect ratios. It can also be easily personalized and presented with modified font size, font type, color, and shapes to measure your progress in a clear way.

Five Yearly Planning And Development For The To Be Roadmap Infographics
Presenting our innovatively structured five yearly planning and development for the to be roadmap infographics Template. Showcase your roadmap process in different formats like PDF, PNG, and JPG by clicking the download button below. This PPT design is available in both Standard Screen and Widescreen aspect ratios. It can also be easily personalized and presented with modified font size, font type, color, and shapes to measure your progress in a clear way.
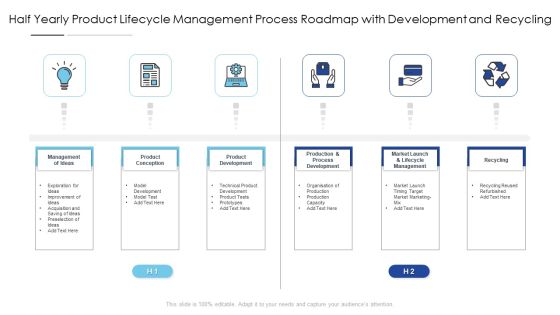
Half Yearly Product Lifecycle Management Process Roadmap With Development And Recycling Infographics
Presenting our innovatively structured half yearly product lifecycle management process roadmap with development and recycling infographics Template. Showcase your roadmap process in different formats like PDF, PNG, and JPG by clicking the download button below. This PPT design is available in both Standard Screen and Widescreen aspect ratios. It can also be easily personalized and presented with modified font size, font type, color, and shapes to measure your progress in a clear way.

Successful Initiatives To Identity And Access Management Development Plan Four Quarter Roadmap Infographics
Presenting our innovatively-structured successful initiatives to identity and access management development plan four quarter roadmap infographics Template. Showcase your roadmap process in different formats like PDF, PNG, and JPG by clicking the download button below. This PPT design is available in both Standard Screen and Widescreen aspect ratios. It can also be easily personalized and presented with modified font size, font type, color, and shapes to measure your progress in a clear way.
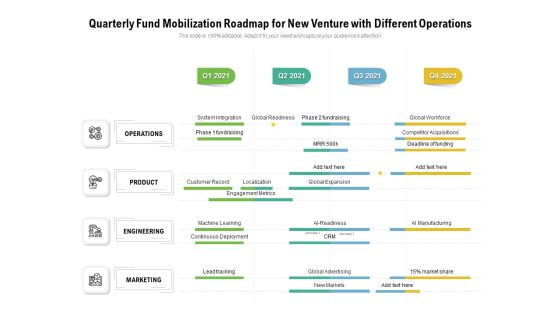
Quarterly Fund Mobilization Roadmap For New Venture With Different Operations Infographics
Presenting our innovatively structured quarterly fund mobilization roadmap for new venture with different operations infographics Template. Showcase your roadmap process in different formats like PDF, PNG, and JPG by clicking the download button below. This PPT design is available in both Standard Screen and Widescreen aspect ratios. It can also be easily personalized and presented with modified font size, font type, color, and shapes to measure your progress in a clear way.
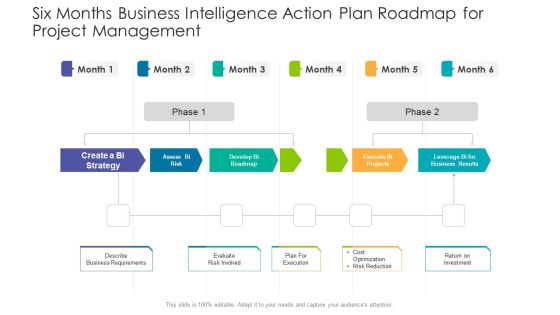
Six Months Business Intelligence Action Plan Roadmap For Project Management Infographics
Presenting our innovatively structured six months business intelligence action plan roadmap for project management infographics Template. Showcase your roadmap process in different formats like PDF, PNG, and JPG by clicking the download button below. This PPT design is available in both Standard Screen and Widescreen aspect ratios. It can also be easily personalized and presented with modified font size, font type, color, and shapes to measure your progress in a clear way.
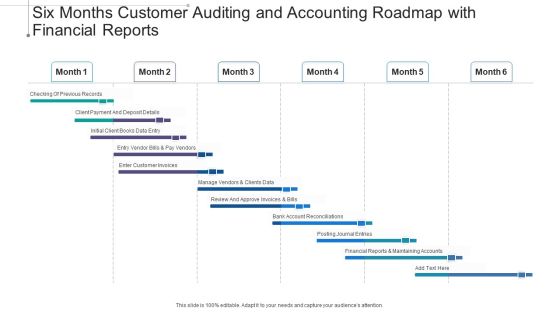
Six Months Customer Auditing And Accounting Roadmap With Financial Reports Infographics
Presenting our innovatively structured six months customer auditing and accounting roadmap with financial reports infographics Template. Showcase your roadmap process in different formats like PDF, PNG, and JPG by clicking the download button below. This PPT design is available in both Standard Screen and Widescreen aspect ratios. It can also be easily personalized and presented with modified font size, font type, color, and shapes to measure your progress in a clear way.

Post Merger Integration Plan Audit Checklist For Mergers And Acquisitions Infographics PDF
This slide provides post merger integration plan of the acquiring firm. It includes details such as deliverable, status, owner, progress and month. Deliver an awe inspiring pitch with this creative post merger integration plan audit checklist for mergers and acquisitions infographics pdf bundle. Topics like strategy, plan, process can be discussed with this completely editable template. It is available for immediate download depending on the needs and requirements of the user.

Payment Gateway Firm Addressing Financial Projections Of Digital Payment Platform Infographics PDF
This slide caters details about financial projections of digital payment platform progress for next 5 years with net profit, EBITDA and net cash flow. Deliver an awe inspiring pitch with this creative Payment Gateway Firm Addressing Financial Projections Of Digital Payment Platform Infographics PDF bundle. Topics like Gross Margin, Profit Before, Net Profit, Employee can be discussed with this completely editable template. It is available for immediate download depending on the needs and requirements of the user.

Multiplayer Gameplay System Venture Capitalist PPT Various Metrics Determining Video Game Platform Performance Infographics PDF
This slide caters details about various metrics portraying video game platform progress in terms of rise in subscribers, rise in average revenue per user, and overall revenue.Deliver an awe inspiring pitch with this creative multiplayer gameplay system venture capitalist ppt various metrics determining video game platform performance infographics pdf bundle. Topics like rise in subscribers, rise in average revenue, rise in overall revenue can be discussed with this completely editable template. It is available for immediate download depending on the needs and requirements of the user.
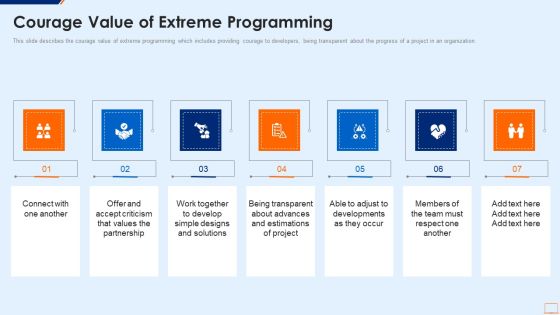
Extreme Programming Methodology IT Courage Value Of Extreme Programming Infographics PDF
This slide describes the courage value of extreme programming which includes providing courage to developers, being transparent about the progress of a project in an organization. Presenting extreme programming methodology it courage value of extreme programming infographics pdf to provide visual cues and insights. Share and navigate important information on seven stages that need your due attention. This template can be used to pitch topics like connect with one another, work together to develop, being transparent about advances In addtion, this PPT design contains high resolution images, graphics, etc, that are easily editable and available for immediate download.

Corporate Finance Stages Of Career Ladder With Salary Growth Infographics PDF
This slide illustrates a career progress hierarchy for corporate finance. It includes different stages of the finance ladder such as CFO, VP finance, director, finance manager, Sr. finance analyst, etc.Presenting Corporate Finance Stages Of Career Ladder With Salary Growth Infographics PDF to dispense important information. This template comprises one stages. It also presents valuable insights into the topics including Finance Manager, Financial Analyst, Director. This is a completely customizable PowerPoint theme that can be put to use immediately. So, download it and address the topic impactfully.

Consolidated Cycle For Physical And Digital Loops Ppt PowerPoint Presentation File Infographics PDF
This slide exhibits integrated project control cycle with development and management. It includes major elements such as- schedule and resource management, develop project work progress etc. Presenting consolidated cycle for physical and digital loops ppt powerpoint presentation file infographics pdf to dispense important information. This template comprises three stages. It also presents valuable insights into the topics including generate movement, analyze and visualize, establish a digital record. This is a completely customizable PowerPoint theme that can be put to use immediately. So, download it and address the topic impactfully.
 Home
Home