AI PPT Maker
Templates
PPT Bundles
Design Services
Business PPTs
Business Plan
Management
Strategy
Introduction PPT
Roadmap
Self Introduction
Timelines
Process
Marketing
Agenda
Technology
Medical
Startup Business Plan
Cyber Security
Dashboards
SWOT
Proposals
Education
Pitch Deck
Digital Marketing
KPIs
Project Management
Product Management
Artificial Intelligence
Target Market
Communication
Supply Chain
Google Slides
Research Services
 One Pagers
All Categories
-
Home
- Customer Favorites
- Profit Icon
Profit Icon

Five Sequential Text Boxes For Information Display Powerpoint Slides
This PowerPoint template has been creatively designed with the right amount of colors. The slide has a lot of space for text. The slide can be used to explain a 5 steps or changes occurring. While this slide can be used for graphically present a comparison between different variants of the same product, it can also be used to compare different products as well. The biggest advantage that you have with this slide is that you can explain the features or the differences in detail all thanks to the space available to add as much text as you want. Use this professionally made slide to demonstrate a sequence or a planned or proposed sequence to your audience. The slide is completely customizable and you can add colors, font and icons of your choice as per your needs and convenience. One of the tags has been highlighted and can be used to demonstrate the primary or the best package or the value for money product or service package.
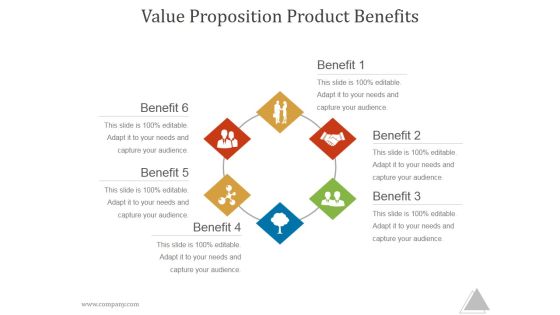
Value Proposition Product Benefits Slide2 Ppt PowerPoint Presentation Ideas
This is a value proposition product benefits slide2 ppt powerpoint presentation ideas. This is a four stage process. The stages in this process are product benefit, icons, strategy, management.

Initial Phase Investor Value For New Business Factors That Influence Startup Valuation Structure PDF
This slide shows the factors that influence the startup company which includes paying customers who use the products, profitability, brand values, etc. This is a initial phase investor value for new business factors that influence startup valuation structure pdf template with various stages. Focus and dispense information on four stages using this creative set, that comes with editable features. It contains large content boxes to add your information on topics like profitability, customers, value, consumers. You can also showcase facts, figures, and other relevant content using this PPT layout. Grab it now.
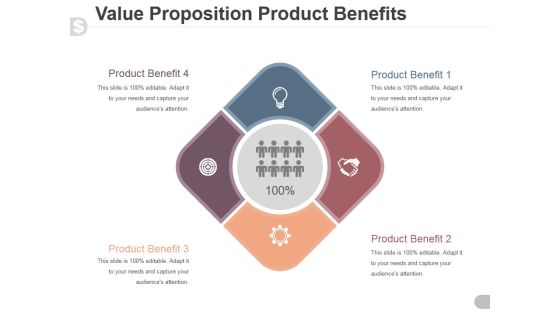
Value Proposition Product Benefits Template 1 Ppt PowerPoint Presentation Slide
This is a value proposition product benefits template 1 ppt powerpoint presentation slide. This is a four stage process. The stages in this process are business, marketing, product, icon, innovation.

Digital Products Company Outline Executive Summary Designs PDF
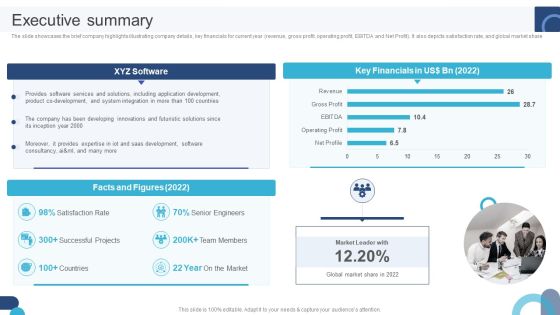
The slide showcases the brief company highlights illustrating company details, key financials for current year revenue, gross profit, operating profit, EBITDA and Net Profit. It also depicts satisfaction rate, and global market share. Do you know about Slidesgeeks Digital Products Company Outline Executive Summary Designs PDF These are perfect for delivering any kind od presentation. Using it, create PowerPoint presentations that communicate your ideas and engage audiences. Save time and effort by using our pre designed presentation templates that are perfect for a wide range of topic. Our vast selection of designs covers a range of styles, from creative to business, and are all highly customizable and easy to edit. Download as a PowerPoint template or use them as Google Slides themes.
Digital Application Software Development Business Profile Executive Summary Structure PDF
The slide showcases the brief company highlights illustrating company details, key financials for current year revenue, gross profit, operating profit, EBITDA and Net Profit. It also depicts satisfaction rate, and global market share. If you are looking for a format to display your unique thoughts, then the professionally designed Digital Application Software Development Business Profile Executive Summary Structure PDF is the one for you. You can use it as a Google Slides template or a PowerPoint template. Incorporate impressive visuals, symbols, images, and other charts. Modify or reorganize the text boxes as you desire. Experiment with shade schemes and font pairings. Alter, share or cooperate with other people on your work. Download Digital Application Software Development Business Profile Executive Summary Structure PDF and find out how to give a successful presentation. Present a perfect display to your team and make your presentation unforgettable.
Strategic Business Plan Effective Tools Organization Triple Bottom Line Social Sustainability Rules PDF
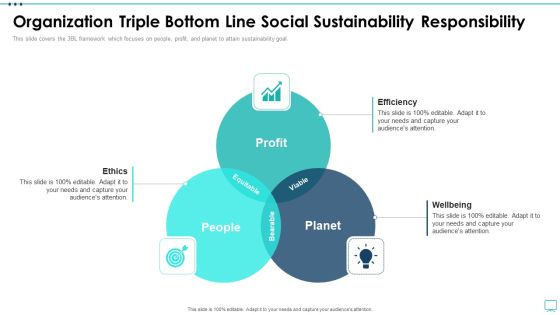
This slide covers the 3BL framework which focuses on people, profit, and planet to attain sustainability goal. Presenting strategic business plan effective tools organization triple bottom line social sustainability rules pdf to provide visual cues and insights. Share and navigate important information on three stages that need your due attention. This template can be used to pitch topics like efficiency, wellbeing, ethics, profit, planet, people. In addtion, this PPT design contains high resolution images, graphics, etc, that are easily editable and available for immediate download.

5 Years Comparative Analysis Chart Of Companys Financial Position Ppt Layouts Structure PDF
This slide represents the table showing the five comparison of financial position of a company. It includes details related to income and profitability, cash flow and investments and financial position of the company. Showcasing this set of slides titled 5 Years Comparative Analysis Chart Of Companys Financial Position Ppt Layouts Structure PDF. The topics addressed in these templates are Income And Profitability, Financial Position, Balance Sheet Total. All the content presented in this PPT design is completely editable. Download it and make adjustments in color, background, font etc. as per your unique business setting.

Dashboard For Budget Monitoring And Supervision To Track Income And Expenses Guidelines PDF
The following slide showcases the budget dashboard that enables to track whether or not project spending remains within budgeted limits. It includes elements like revenues, profitability, liquidity, months etc. Pitch your topic with ease and precision using this Dashboard For Budget Monitoring And Supervision To Track Income And Expenses Guidelines PDF. This layout presents information on Revenues, Profitability, Liquidity . It is also available for immediate download and adjustment. So, changes can be made in the color, design, graphics or any other component to create a unique layout.
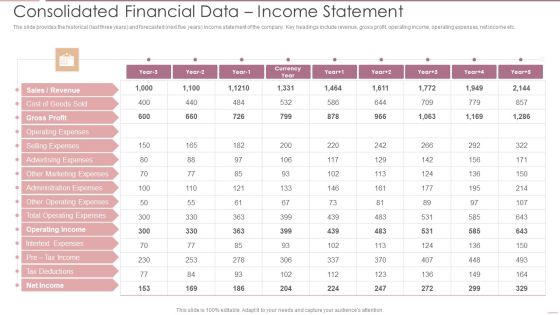
Investment Banking Security Underwriting Pitchbook Consolidated Financial Data Income Statement Diagrams PDF
The slide provides the historical last three years and forecasted next five years income statement of the company. Key headings include revenue, gross profit, operating income, operating expenses, net income etc.Deliver and pitch your topic in the best possible manner with this Investment Banking Security Underwriting Pitchbook Consolidated Financial Data Income Statement Diagrams PDF Use them to share invaluable insights on Gross Profit, Operating Expenses, Advertising Expenses and impress your audience. This template can be altered and modified as per your expectations. So, grab it now.
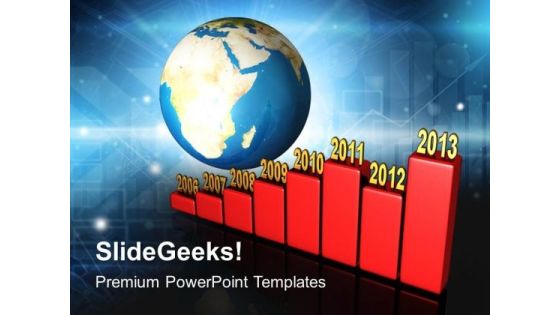
Bar Graph Yearly Along Earth PowerPoint Templates And PowerPoint Themes 1012
Bar Graph Yearly Along Earth PowerPoint Templates And PowerPoint Themes 1012-This PowerPoint Template shows the Annual growth Chart from 2006 to 2013 in the Graphical manner. It imitates the concept of Money, Business, Profit, Loss etc. Use this Template for Increasing and decreasing Bar Graph. Clarity of thought has been the key to your growth. Use our templates to illustrate your ability-Bar Graph Yearly Along Earth PowerPoint Templates And PowerPoint Themes 1012-This PowerPoint template can be used for presentations relating to-Bar graph showing the growth of profits, business, finance, success, earth, globe
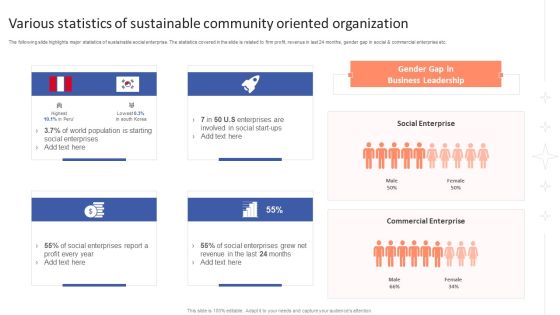
Various Statistics Of Sustainable Community Oriented Organization Themes PDF
The following slide highlights major statistics of sustainable social enterprise. The statistics covered in the slide is related to firm profit, revenue in last 24 months, gender gap in social and commercial enterprise etc. Persuade your audience using this Various Statistics Of Sustainable Community Oriented Organization Themes PDF. This PPT design covers four stages, thus making it a great tool to use. It also caters to a variety of topics including Social Enterprises, Enterprises, Profit. Download this PPT design now to present a convincing pitch that not only emphasizes the topic but also showcases your presentation skills.

Six Different Types Of B2B Market Division Themes PDF
This slide represents the types of B2B market segmentation to increase the sales for organization. It includes types such as segmenting by the organization, decision-maker, needs and attitudes, jobs to be done, behavior, profitability. Persuade your audience using this Six Different Types Of B2B Market Division Themes PDF. This PPT design covers six stages, thus making it a great tool to use. It also caters to a variety of topics including Organization, Profitability, Behavior. Download this PPT design now to present a convincing pitch that not only emphasizes the topic but also showcases your presentation skills.

Product Development Business Drivers Employee Ranking System Themes PDF
The purpose of this slide is to analyze the various business drivers by comparing the relative importance of each driver against the other drivers. This includes shortening market rate, global competition, mass customization, secure product, and maximizing profitability. Pitch your topic with ease and precision using this Product Development Business Drivers Employee Ranking System Themes PDF. This layout presents information on Maximize Profitability, Secure Product, Global Competition. It is also available for immediate download and adjustment. So, changes can be made in the color, design, graphics or any other component to create a unique layout.
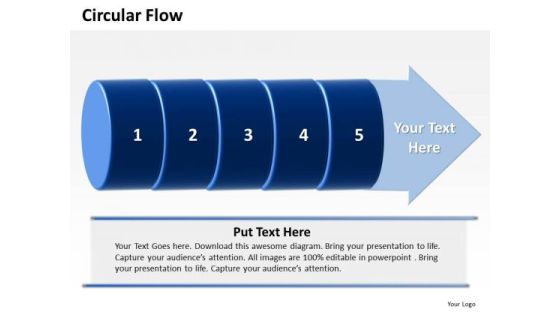
Ppt Circular Motion PowerPoint Flow Of 5 Steps Involved Development Templates
PPT circular motion powerpoint flow of 5 steps involved development Templates-The Business PowerPoint Diagram shows Circular flow of 5 steps involved in development of Business. It includes adding to, addition, adulthood, advance, advancement, advancing, augmentation, augmenting, boost, buildup, chrysalis etc.-PPT circular motion powerpoint flow of 5 steps involved development Templates-Affiliate, Affiliation, Arrow, Business, Chart, Circular, Commerce, Concept, Contribution, Cycle, Development, Diagram, Idea, Informative, Internet, Join, Making, Manage, Management, Market, Marketing, Member, Money, Network, Partner, Partnership, Pay, Paying, Performance, Plans, Process, Productive, Productivity, Profit, Profitable, Project, Recruit, Recruiting, Recruitment, Refer, Referral, Referring, Revenue, Sales, Socialize, Steps, Strategy
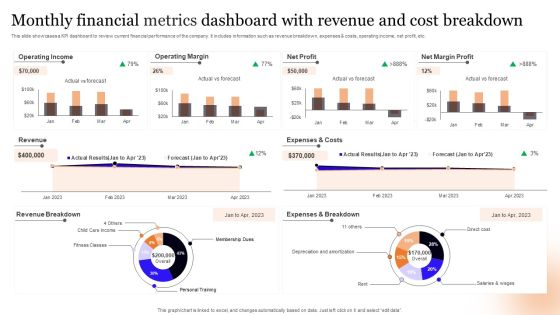
Monthly Financial Metrics Dashboard With Revenue And Cost Breakdown Information PDF
This slide showcases a KPI dashboard to review current financial performance of the company. It includes information such as revenue breakdown, expenses and costs, operating income, net profit, etc. Pitch your topic with ease and precision using this Monthly Financial Metrics Dashboard With Revenue And Cost Breakdown Information PDF. This layout presents information on Operating Income, Operating Margin, Net Profit. It is also available for immediate download and adjustment. So, changes can be made in the color, design, graphics or any other component to create a unique layout.

Monthly Customer Acquisition Business Cost Comparison Table Diagrams PDF
This slide covers comparison table based on cost to acquire new customers. It includes elements such as average contract value, gross margin and profits, customer acquisition cost, sales and marketing expenses, addition of new customers, customer churn rates, lifetime value, etc. Pitch your topic with ease and precision using this Monthly Customer Acquisition Business Cost Comparison Table Diagrams PDF. This layout presents information on Gross Profit, Gross Margin, Customer Churn Rate. It is also available for immediate download and adjustment. So, changes can be made in the color, design, graphics or any other component to create a unique layout.

Pitch Deck To Raise Capital From Commercial Financial Institution Using Bonds Companys Interest Coverage Ratio Table Themes PDF
This slide shows companys Interest Coverage Ratio for a particular year and also includes Gross Profit, Total Expenses, Operating Profit, Net Income etc.Deliver and pitch your topic in the best possible manner with this pitch deck to raise capital from commercial financial institution using bonds companys interest coverage ratio table themes pdf. Use them to share invaluable insights on total expenses, interest expense, sales revenue and impress your audience. This template can be altered and modified as per your expectations. So, grab it now.

Sales Performance Monitoring Dashboard With Revenue And Cost Metric Ppt Portfolio Good PDF
This slide illustrates sales revenue and costs tracking dashboard. It provides information about sales count, profit, expenses, sales revenue, expenses breakdown, up or cross selling, etc. Showcasing this set of slides titled Sales Performance Monitoring Dashboard With Revenue And Cost Metric Ppt Portfolio Good PDF. The topics addressed in these templates are Sales Count, Revenue, Profit, Expenses. All the content presented in this PPT design is completely editable. Download it and make adjustments in color, background, font etc. as per your unique business setting.

Evaluating Price Efficiency In Organization Role Of Customer Demand In Pricing Analysis Infographics PDF
This slide covers the relationship between price and other factors such as customer demand, sales revenues, product costs, gross profits, and product positioning. Deliver and pitch your topic in the best possible manner with this evaluating price efficiency in organization role of customer demand in pricing analysis infographics pdf. Use them to share invaluable insights on customer demand, sales revenues, product costs, gross profits, product positioning and impress your audience. This template can be altered and modified as per your expectations. So, grab it now.
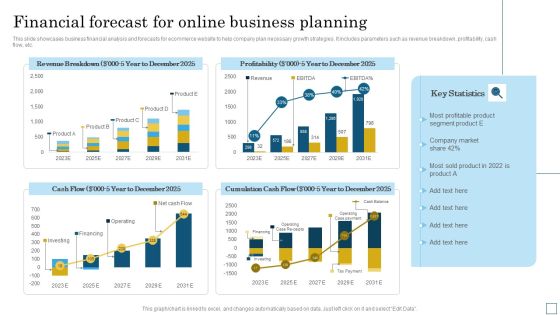
Financial Forecast For Online Business Planning Pictures PDF
This slide showcases business financial analysis and forecasts for ecommerce website to help company plan necessary growth strategies. It includes parameters such as revenue breakdown, profitability, cash flow, etc. Pitch your topic with ease and precision using this Financial Forecast For Online Business Planning Pictures PDF. This layout presents information on Cumulation Cash Flow, Profitability, Revenue Breakdown. It is also available for immediate download and adjustment. So, changes can be made in the color, design, graphics or any other component to create a unique layout.
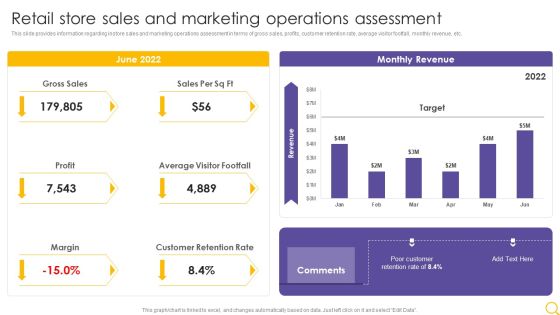
Retail Outlet Operational Efficiency Analytics Retail Store Sales And Marketing Operations Assessment Designs PDF
This slide provides information regarding instore sales and marketing operations assessment in terms of gross sales, profits, customer retention rate, average visitor footfall, monthly revenue, etc. Deliver and pitch your topic in the best possible manner with this Retail Outlet Operational Efficiency Analytics Retail Store Sales And Marketing Operations Assessment Designs PDF. Use them to share invaluable insights on Gross Sales, Profit, Average Visitor Footfall and impress your audience. This template can be altered and modified as per your expectations. So, grab it now.
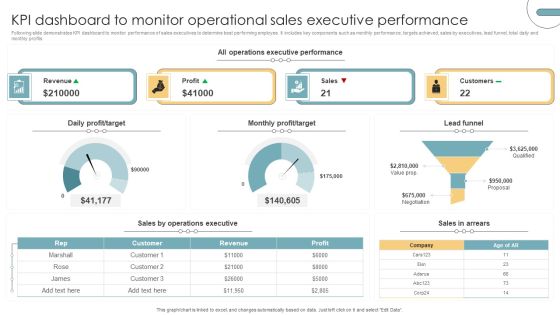
KPI Dashboard To Monitor Operational Sales Executive Performance Portrait PDF
Following slide demonstrates KPI dashboard to monitor performance of sales executives to determine best performing employee. It includes key components such as monthly performance, targets achieved, sales by executives, lead funnel, total daily and monthly profits. Pitch your topic with ease and precision using this KPI Dashboard To Monitor Operational Sales Executive Performance Portrait PDF. This layout presents information on Revenue, Profit, Sales, Customers. It is also available for immediate download and adjustment. So, changes can be made in the color, design, graphics or any other component to create a unique layout.

Clothing Business Market Entry Strategy Company Key Figures For Past 5 Years Infographics PDF
This slide covers the dashboard with major values for the last five years. It includes KPIs such as sales, net operating profit, sales by geographic areas, and number of employees. Deliver an awe inspiring pitch with this creative Clothing Business Market Entry Strategy Company Key Figures For Past 5 Years Infographics PDF bundle. Topics like Geographical Area, Operating Profit, Billions Of Euros can be discussed with this completely editable template. It is available for immediate download depending on the needs and requirements of the user.

Current Culture Followed By The Company Grid Template PDF
The purpose of this slide is to create a graph which focus on the current culture followed within the company such as internal communication, micromanagement, focus on profits, department autonomy etc. Deliver and pitch your topic in the best possible manner with this current culture followed by the company grid template pdf. Use them to share invaluable insights on departmental autonomy, focus on profit, internal communication, mivromanagement and impress your audience. This template can be altered and modified as per your expectations. So, grab it now.

Data Analytics IT Dashboard For Data Science Implementation Ppt Portfolio Pictures PDF
This slide depicts the dashboard for data integration in the business, and it is showing real-time details about expenses, profits, margins percentage, and new addition projects. Deliver and pitch your topic in the best possible manner with this data analytics it dashboard for data science implementation ppt portfolio pictures pdf. Use them to share invaluable insights on data and analytics, margin percentage, profits, expenses, new additions projects and impress your audience. This template can be altered and modified as per your expectations. So, grab it now.

Infrastructure Expansion KPI Dashboard For Investment Project Management Inspiration PDF
This slide covers management dashboard for analyzing the project performance and progress. It include KPIs such as total claims to date, total costs to date, project status, profits, number of days left, etc. Showcasing this set of slides titled Infrastructure Expansion KPI Dashboard For Investment Project Management Inspiration PDF. The topics addressed in these templates are Claims And Costs, Project Status, Profits. All the content presented in this PPT design is completely editable. Download it and make adjustments in color, background, font etc. as per your unique business setting.

KPI Dashboard To Track Beauty Care Products Sales Performance Ppt Outline Pictures PDF
This slide shows the key performance indicators dashboard which can be used to analyze current financial position of cosmetic business. It includes metrics such as sales, expenses, profit, cash in hand, etc. Showcasing this set of slides titled KPI Dashboard To Track Beauty Care Products Sales Performance Ppt Outline Pictures PDF. The topics addressed in these templates are Sales Number, Total Sales, Total Profit, Cost. All the content presented in this PPT design is completely editable. Download it and make adjustments in color, background, font etc. as per your unique business setting.

Stocks Market Capitalization Fundamental Trend Analysis Dashboard Designs PDF
This slide represents the dashboard showing the fundamental analysis of the stock market. It includes data related to top 10 stock market capitalization, top 10 stocks by EPS and top 5 stocks by net profit.Showcasing this set of slides titled Stocks Market Capitalization Fundamental Trend Analysis Dashboard Designs PDF. The topics addressed in these templates are Market Capitalization, Net Profit. All the content presented in this PPT design is completely editable. Download it and make adjustments in color, background, font etc. as per your unique business setting.

Small Business Financial Statement Analysis For Future Endeavors Mockup PDF
The following slide depicts the assessment of financial statement to formulate upcoming strategies and framework. It constitutes of elements such as gross profit, total expenses, profit, loss, assets and liabilities etc. Showcasing this set of slides titled Small Business Financial Statement Analysis For Future Endeavors Mockup PDF. The topics addressed in these templates are Small Business, Financial Statement Analysis. All the content presented in this PPT design is completely editable. Download it and make adjustments in color, background, font etc. as per your unique business setting.

Brand Value Ppt PowerPoint Presentation Layouts Portfolio
This is a brand value ppt powerpoint presentation layouts portfolio. This is a four stage process. The stages in this process are value, business, marketing, strategy, icons.
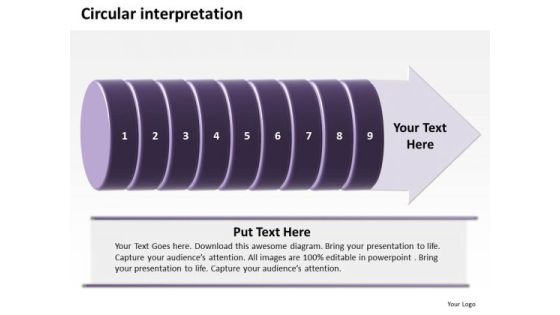
Ppt Circular Interpretation Of 9 Create PowerPoint Macro Involved Procedure Templates
PPT circular interpretation of 9 create powerpoint macro involved procedure Templates-The Business PowerPoint Diagram shows Circular interpretation of 5 steps involved in procedure of Business. It Signifies elaborating, enlargement, evolution, evolvement, evolving, expansion, flowering, hike, improvement, increase, increasing, making progress etc.-PPT circular interpretation of 9 create powerpoint macro involved procedure Templates-Affiliate, Affiliation, Arrow, Business, Chart, Circular, Commerce, Concept, Contribution, Cycle, Development, Diagram, Idea, Informative, Internet, Join, Making, Manage, Management, Market, Marketing, Member, Money, Network, Partner, Partnership, Pay, Paying, Performance, Plans, Process, Productive, Productivity, Profit, Profitable, Project, Recruit, Recruiting, Recruitment, Refer, Referral, Referring, Revenue, Sales, Socialize, Steps, Strategy
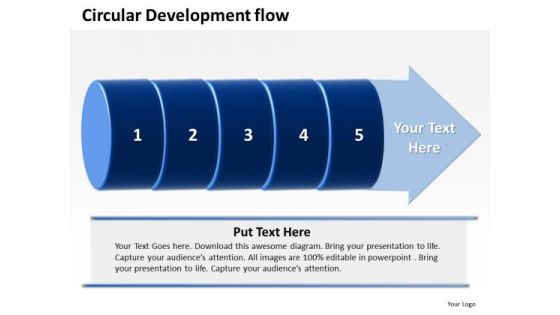
Ppt PowerPoint Presentation Circular Flow Of 5 Steps Involved Development Templates
PPT powerpoint presentation circular flow of 5 steps involved development Templates-The Business PowerPoint Diagram shows Circular flow of 5 steps involved in development of Business. It includes adding to, addition, adulthood, advance, advancement, advancing, augmentation, augmenting, boost, buildup, chrysalis etc.-PPT powerpoint presentation circular flow of 5 steps involved development Templates-Affiliate, Affiliation, Arrow, Business, Chart, Circular, Commerce, Concept, Contribution, Cycle, Development, Diagram, Idea, Informative, Internet, Join, Making, Manage, Management, Market, Marketing, Member, Money, Network, Partner, Partnership, Pay, Paying, Performance, Plans, Process, Productive, Productivity, Profit, Profitable, Project, Recruit, Recruiting, Recruitment, Refer, Referral, Referring, Revenue, Sales, Socialize, Steps, Strategy

Business Charts PowerPoint Templates Steps To Reach The Top Editable Sales
Business Charts PowerPoint templates steps to reach the top editable Sales-This PowerPoint Diagram shows the doorsteps to reach the door that is Success. It portrays the concept of accomplishment, achievement, attainment, benefit, big hit, eminence, fame, flying colors, fortune, gain, good luck, good times, grand slam, lap of luxury, laughter, maturation, profit, progress, prosperity, realization, reward, triumph, and victory.

Business Vision Values And Pledge Ppt Templates
This is a business vision values and pledge ppt templates. This is a four stage process. The stages in this process are vision, management, icons, arrows, strategy.

Corporate Vision Values Powerpoint Slide Background Image
This is a corporate vision values powerpoint slide background image. This is a four stage process. The stages in this process are corporate, vision, icon, business, marketing.
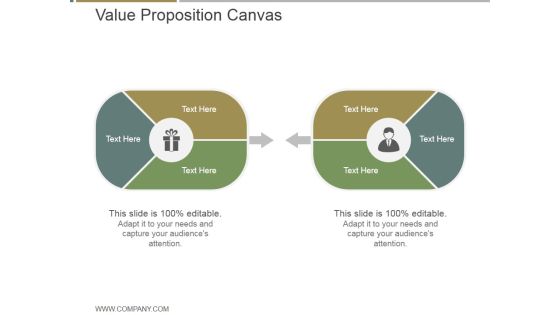
Value Proposition Canvas Ppt PowerPoint Presentation Rules
This is a value proposition canvas ppt powerpoint presentation rules. This is a two stage process. The stages in this process are business, marketing, success, steps, icons.
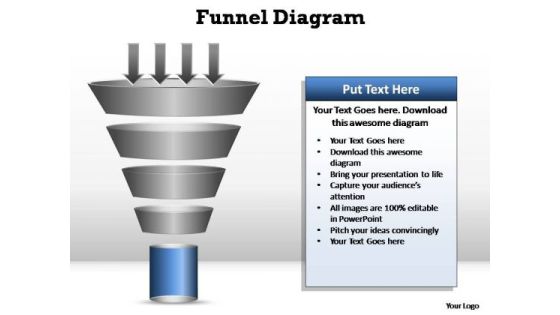
PowerPoint Themes Marketing Funnel Diagram Ppt Presentation
PowerPoint Themes Marketing Funnel Diagram PPT Presentation-You have the product you need. Now funnel your marketing strategies down the cone,stage by stage, refining as you go along. Enlighten others on the process with this innovative graphic to authenticate your plan of acheiving the goal of added value/profit.-PowerPoint Themes Marketing Funnel Diagram PPT Presentation

PowerPoint Themes Success Funnel Diagram Ppt Designs
PowerPoint Themes Success Funnel Diagram PPT Designs-You have the product you need. Now funnel your marketing strategies down the cone,stage by stage, refining as you go along. Enlighten others on the process with this innovative graphic to authenticate your plan of acheiving the goal of added value/profit.-PowerPoint Themes Success Funnel Diagram PPT Designs

Best Outcomes Of Growth And Development Practices Template PDF
The following slide showcases some statistical insights of employee learning and development to gauge its impact. It includes key results such as increase in revenue, productivity, net profit, decrease in absenteeism, reduced employee turnover etc. Presenting Best Outcomes Of Growth And Development Practices Template PDF to dispense important information. This template comprises six stages. It also presents valuable insights into the topics including Revenue, Absenteeism, Profit. This is a completely customizable PowerPoint theme that can be put to use immediately. So, download it and address the topic impactfully.
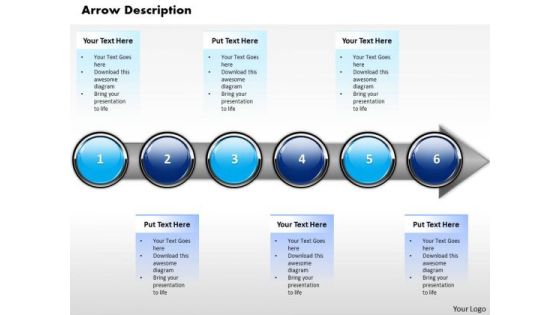
Ppt Horizontal Illustration Of Financial Process Using 6 State Diagram PowerPoint Templates
PPT horizontal illustration of financial process using 6 state diagram PowerPoint Templates-This diagram can be used in analyzing, designing, documenting or managing a process or program in various fields.-PPT horizontal illustration of financial process using 6 state diagram PowerPoint Templates-Abstract, Achievement, Aim, Arrow, Background, Business, Chart, Communication, Company, Competition, Concept, Design, Development, Diagram, Direction, Finance, Financial, Forecast, Forward, Goal, Graph, Graphic, Growth, Icon, Illustration, Increase, Investment, Leader, Leadership, Marketing, Motion, Moving, Orange, Path, Price, Process, Profit, Progress, Shape, Sign, Success, Symbol, Target, Team, Teamwork, Up, Upwards

Segmentation Targeting Positioning Marketing Analysis Ideas PDF
This slide covers the marketing analysis on step approach. it helps the company to segment, target and position its product in the market in such a way that it will lead to huge profits. Presenting segmentation targeting positioning marketing analysis ideas pdf to dispense important information. This template comprises three stages. It also presents valuable insights into the topics including frequent purchasers, profitability, symbolic positioning This is a completely customizable PowerPoint theme that can be put to use immediately. So, download it and address the topic impactfully.

Business Key Goals And Objectives Ppt PowerPoint Presentation Gallery Graphics PDF
This slide contains both goals and objectives of the business that helps to clarify the purpose of the business and help identify necessary actions. It includes business profitability, improve customer service, business growth, etc. Presenting Business Key Goals And Objectives Ppt PowerPoint Presentation Gallery Graphics PDF to dispense important information. This template comprises three stages. It also presents valuable insights into the topics including Boost Business Profitability, Improve Customer Service, Foster Business Growth. This is a completely customizable PowerPoint theme that can be put to use immediately. So, download it and address the topic impactfully.

Ways To Funding Business Merger And Acquisition Formats PDF
The following slide depicts some ways to finance business acquisition and gain competitive edge in the market. It includes six modes namely equity, company profits, seller note, seller equity, banks, private equity firms etc. Presenting Ways To Funding Business Merger And Acquisition Formats PDF to dispense important information. This template comprises six stages. It also presents valuable insights into the topics including Only Equity, Company Profits, Seller Equity. This is a completely customizable PowerPoint theme that can be put to use immediately. So, download it and address the topic impactfully.
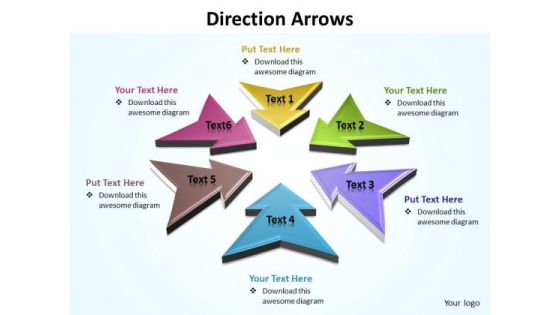
Ppt Direction Arrows Diagram PowerPoint Free Editable Templates
PPT direction arrows diagram powerpoint free editable templates-Create stunning Microsoft office PPT Presentations with our professional templates containing a graphic of multicolored arrows. This image has been professionally designed to emphasize the concept of interrelated business issues. This awesome image makes your presentations simpler and professional. This PPT image is an effective tool to make your clients understand the concept.-PPT direction arrows diagram powerpoint free editable templates-Abstract, Achievement, Aim, Arrow, Background, Business, Chart, Communication, Competition, Concept, Design, Direction, Development, Diagram, Direction, Finance, Financial, Forecast, Forward, Goal, Graph, Graphic, Growth, Icon, Illustration, Increase, Investment, Leader, Leadership, Design, Marketing, Price, Process, Profit, Progress, Progress, Shape, Sign, Success, Symbol, Target, Team, Teamwork
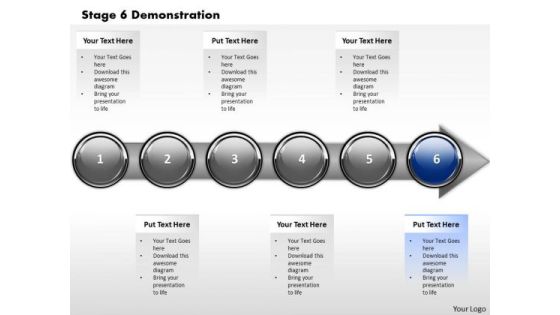
Ppt Linear Abstraction Of Financial Layouts Process Using Stage 6 PowerPoint Templates
PPT linear abstraction of financial layouts process using stage 6 PowerPoint Templates-The theme of this PowerPoint template is linear arrow. Use this slide to detail and highlight your thought process, your views and your positive expectations.-PPT linear abstraction of financial layouts process using stage 6 PowerPoint Templates-Abstract, Achievement, Aim, Arrow, Background, Business, Chart, Communication, Company, Competition, Concept, Design, Development, Diagram, Direction, Finance, Financial, Forecast, Forward, Goal, Graph, Graphic, Growth, Icon, Illustration, Increase, Investment, Leader, Leadership, Marketing, Motion, Moving, Orange, Path, Price, Process, Profit, Progress, Shape, Sign, Success, Symbol, Target, Team, Teamwork, Up, Upwards

Ppt Homogeneous Demonstration Of Financial Process Using Stage 3 PowerPoint Templates
PPT homogeneous demonstration of financial process using stage 3 PowerPoint Templates-With this pre-designed process arrows diagram you can visualize almost any type of concept, chronological process or steps of your strategies.-PPT homogeneous demonstration of financial process using stage 3 PowerPoint Templates-Abstract, Achievement, Aim, Arrow, Background, Business, Chart, Communication, Company, Competition, Concept, Design, Development, Diagram, Direction, Finance, Financial, Forecast, Forward, Goal, Graph, Graphic, Growth, Icon, Illustration, Increase, Investment, Leader, Leadership, Marketing, Motion, Moving, Orange, Path, Price, Process, Profit, Progress, Shape, Sign, Success, Symbol, Target, Team, Teamwork, Up, Upwards

Ppt Horizontal Abstraction Of Financial Process Using Stage 4 PowerPoint Templates
PPT horizontal abstraction of financial process using stage 4 PowerPoint Templates-This diagram can be used in analyzing, designing, documenting or managing a process or program in various fields.-PPT horizontal abstraction of financial process using stage 4 PowerPoint Templates-Abstract, Achievement, Aim, Arrow, Background, Business, Chart, Communication, Company, Competition, Concept, Design, Development, Diagram, Direction, Finance, Financial, Forecast, Forward, Goal, Graph, Graphic, Growth, Icon, Illustration, Increase, Investment, Leader, Leadership, Marketing, Motion, Moving, Orange, Path, Price, Process, Profit, Progress, Shape, Sign, Success, Symbol, Target, Team, Teamwork, Up, Upwards

Ppt Sequential Demonstration Of Arrow Process Step 1 PowerPoint Templates
PPT sequential demonstration of arrow process step 1 PowerPoint Templates-With this pre-designed process arrows diagram you can visualize almost any type of concept, chronological process or steps of your strategies-PPT sequential demonstration of arrow process step 1 PowerPoint Templates-Abstract, Achievement, Aim, Arrow, Background, Business, Chart, Communication, Company, Competition, Concept, Design, Development, Diagram, Direction, Finance, Financial, Forecast, Forward, Goal, Graph, Graphic, Growth, Icon, Illustration, Increase, Investment, Leader, Leadership, Marketing, Motion, Moving, Orange, Path, Price, Process, Profit, Progress, Shape, Sign, Success, Symbol, Target, Team, Teamwork, Up, Upwards
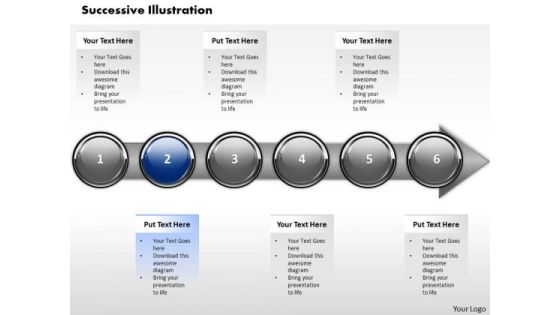
Ppt Sequential Illustration Of Financial PowerPoint Presentation Process Step 2 Templates
PPT sequential illustration of financial powerpoint presentation process step 2 Templates-This diagram helps to determine your targets and you can sequence them as per your priorities. Educate your listeners on the relevance and importance of each one as per your plan.-PPT sequential illustration of financial powerpoint presentation process step 2 Templates-Abstract, Achievement, Aim, Arrow, Background, Business, Chart, Communication, Company, Competition, Concept, Design, Development, Diagram, Direction, Finance, Financial, Forecast, Forward, Goal, Graph, Graphic, Growth, Icon, Illustration, Increase, Investment, Leader, Leadership, Marketing, Motion, Moving, Orange, Path, Price, Process, Profit, Progress, Shape, Sign, Success, Symbol, Target, Team, Teamwork, Up, Upwards
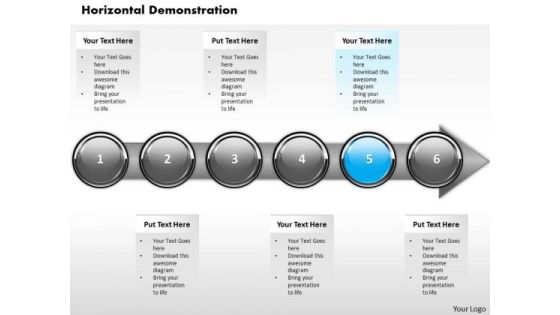
Ppt Consistent Demonstration Of Financial Process Using Stage 5 PowerPoint Templates
PPT consistent demonstration of financial process using stage 5 PowerPoint Templates-Highlight the key components of your entire financial process. Illustrate how each element flows seamlessly onto the next stage.-PPT consistent demonstration of financial process using stage 5 PowerPoint Templates-Abstract, Achievement, Aim, Arrow, Background, Business, Chart, Communication, Company, Competition, Concept, Design, Development, Diagram, Direction, Finance, Financial, Forecast, Forward, Goal, Graph, Graphic, Growth, Icon, Illustration, Increase, Investment, Leader, Leadership, Marketing, Motion, Moving, Orange, Path, Price, Process, Profit, Progress, Shape, Sign, Success, Symbol, Target, Team, Teamwork, Up, Upwards
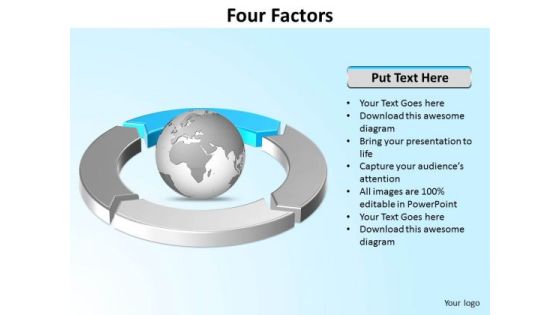
Ppt Four Segments Around Globe PowerPoint Presentation Circle Blue Templates
PPT four segments around globe powerpoint presentation circle blue Templates-This PowerPoint Diagram can be used to represent worldwide business issues such as financial data, stock market Exchange, increase in sales, corporate presentations and more. It illustrates the blue component of this worldwide PowerPoint Diagram.-Can be used for presentations on abstract, achievement, aim, arrow, background, business, chart, communication, company, competition, concept, design, development, diagram, direction, finance, financial, forecast, forward, goal, graph, graphic, growth, icon, illustration, increase, investment, leader, leadership, marketing, motion, moving, path, price, process, profit, progress, progress bar, shape, sign, success, symbol, target, team, teamwork, turquoise blue, up, upward-PPT four segments around globe powerpoint presentation circle blue Templates
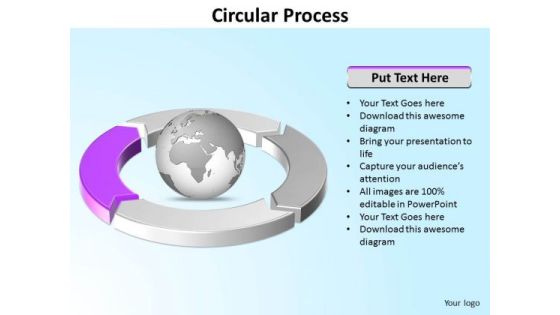
Ppt Four Segments Around Microsoft PowerPoint Backgrounds Circle Purple Templates
PPT four segments around microsoft powerpoint backgrounds circle purple Templates-This PowerPoint Diagram can be used to represent worldwide business issues such as financial data, stock market Exchange, increase in sales, corporate presentations and more. It illustrates the purple component. This Diagram will fit for Business Presentations.-Can be used for presentations on abstract, achievement, aim, arrow, background, business, chart, communication, company, competition, concept, design, development, diagram, direction, finance, financial, forecast, forward, goal, graph, graphic, growth, icon, illustration, increase, investment, leader, leadership, marketing, motion, moving, path, price, process, profit, progress, progress bar, shape, sign, success, symbol, target, team, teamwork, turquoise blue, up, upward-PPT four segments around microsoft powerpoint backgrounds circle purple Templates

Ppt Four Segments Around Spinning Globe PowerPoint Template Circle Green Templates
PPT four segments around spinning globe powerpoint template circle green Templates-This PowerPoint Diagram can be used to represent worldwide issues such as Global warming, Acid Rain, Poverty, Racism,Obesity, overpopulation. It is illustrated by Green component. This Diagram will fit for Business Presentations.-Can be used for presentations on abstract, achievement, aim, arrow, background, business, chart, communication, company, competition, concept, design, development, diagram, direction, finance, financial, forecast, forward, goal, graph, graphic, growth, icon, illustration, increase, investment, leader, leadership, marketing, motion, moving, path, price, process, profit, progress, progress bar, shape, sign, success, symbol, target, team, teamwork, turquoise blue, up, upward-PPT four segments around spinning globe powerpoint template circle green Templates

Ppt Four Segments Around Spinning Globe PowerPoint Template Circle Red Templates
PPT four segments around spinning globe powerpoint template circle red Templates-This PowerPoint Diagram can be used to represent worldwide issues such as Global warming, Acid Rain, Poverty, Racism,Obesity, overpopulation etc. It is illustrated by Red component. This Diagram will fit for Business Presentations.-Can be used for presentations on abstract, achievement, aim, arrow, background, business, chart, communication, company, competition, concept, design, development, diagram, direction, finance, financial, forecast, forward, goal, graph, graphic, growth, icon, illustration, increase, investment, leader, leadership, marketing, motion, moving, path, price, process, profit, progress, progress bar, shape, sign, success, symbol, target, team, teamwork, turquoise blue, up, upward-PPT four segments around spinning globe powerpoint template circle red Templates
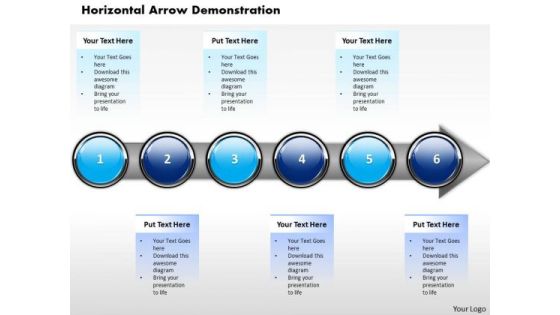
Ppt Horizontal Demonstration Of Finance Process Using 6 Stages PowerPoint Templates
PPT horizontal demonstration of finance process using 6 stages PowerPoint Templates-Use This Horizontally Demonstrated PowerPoint Diagram having six circular boxes on the arrow pointing towards east direction signifying his completion of the process and leading towards success.-PPT horizontal demonstration of finance process using 6 stages PowerPoint Templates-Abstract, Achievement, Aim, Arrow, Background, Business, Chart, Communication, Company, Competition, Concept, Design, Development, Diagram, Direction, Finance, Financial, Forecast, Forward, Goal, Graph, Graphic, Growth, Icon, Illustration, Increase, Investment, Leader, Leadership, Marketing, Motion, Moving, Orange, Path, Price, Process, Profit, Progress, Shape, Sign, Success, Symbol, Target, Team, Teamwork, Up, Upwards

Ppt Four Segments Around Globe In Circle PowerPoint Presentation Templates
PPT four segments around globe in circle powerpoint presentation Templates-Use this graphical approach to represent global business issues such as financial data, stock market Exchange, increase in sales, corporate presentations and more. It Signifies common, comprehensive, extensive, global, international, multinational, omnipresent, planetary, ubiquitous, universal etc.-Can be used for presentations on abstract, achievement, aim, arrow, background, business, chart, communication, company, competition, concept, design, development, diagram, direction, finance, financial, forecast, forward, goal, graph, graphic, growth, icon, illustration, increase, investment, leader, leadership, marketing, motion, moving, path, price, process, profit, progress, progress bar, shape, sign, success, symbol, target, team, teamwork, turquoise blue, up, upward-PPT four segments around globe in circle powerpoint presentation Templates

Ppt Direction Arrows Of Layout Editable PowerPoint World Map Templates
PPT direction arrows of layout editable powerpoint world map Templates-The above template contains a graphic of arrows pointing towards the center. Clarity of thought has been the key to your growth. Use our templates to illustrate your ability.-PPT direction arrows of layout editable powerpoint world map Templates-Abstract, Achievement, Aim, Arrow, Background, Business, Chart, Communication, Competition, Concept, Design, Direction, Development, Diagram, Direction, Finance, Financial, Forecast, Forward, Goal, Graph, Graphic, Growth, Icon, Illustration, Increase, Investment, Leader, Leadership, Design, Marketing, Price, Process, Profit, Progress, Progress, Shape, Sign, Success, Symbol, Target, Team, Teamwork

Ppt Parallel Steps Plan Toward Meeting The Goal Business PowerPoint Templates
PPT parallel steps plan toward meeting the goal Business PowerPoint Templates-This PowerPoint Diagram shows the steps towards meeting the goal. This PowerPoint Diagram represents fortune, gain, good luck, good times, grand slam, and lap of luxury, laughter, maturation, profit, progress, prosperity, realization, reward, triumph, and victory.-PPT parallel steps plan toward meeting the goal Business PowerPoint Templates
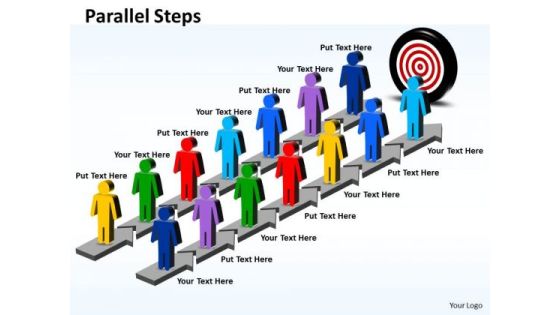
Business Charts PowerPoint Templates Corrective Action Plan
Business Charts PowerPoint templates corrective action plan-This PowerPoint Diagram shows the steps to reach the Destination. It portrays the concept of accomplishment, achievement, attainment, benefit, big hit, eminence, fame, flying colors, fortune, gain, good luck, good times, grand slam, and lap of luxury, laughter, maturation, profit, progress, prosperity, realization, reward, triumph, and victory.-Business Charts PowerPoint templates corrective action plan
