AI PPT Maker
Templates
PPT Bundles
Design Services
Business PPTs
Business Plan
Management
Strategy
Introduction PPT
Roadmap
Self Introduction
Timelines
Process
Marketing
Agenda
Technology
Medical
Startup Business Plan
Cyber Security
Dashboards
SWOT
Proposals
Education
Pitch Deck
Digital Marketing
KPIs
Project Management
Product Management
Artificial Intelligence
Target Market
Communication
Supply Chain
Google Slides
Research Services
 One Pagers
All Categories
-
Home
- Customer Favorites
- Profit Icon
Profit Icon
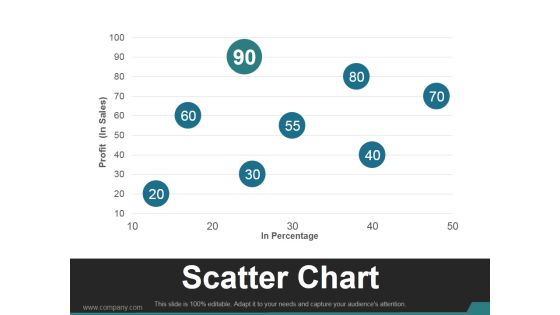
Scatter Chart Template 2 Ppt PowerPoint Presentation Slides
This is a scatter chart template 2 ppt powerpoint presentation slides. This is a eight stage process. The stages in this process are business, marketing, scatter chart, profit, management.

Bubble Chart Ppt PowerPoint Presentation Layouts Design Ideas
This is a bubble chart ppt powerpoint presentation layouts design ideas. This is a eight stage process. The stages in this process are in percentage, profit, bubble chart, business, marketing.

Stacked Line Chart Ppt PowerPoint Presentation Outline Examples
This is a stacked line chart ppt powerpoint presentation outline examples. This is a two stage process. The stages in this process are product, stacked line chart, business, marketing, profit.

Stacked Line Chart Ppt PowerPoint Presentation Pictures Elements
This is a stacked line chart ppt powerpoint presentation pictures elements. This is a two stage process. The stages in this process are product, profit, stacked line chart, year, business.

Scatter Bubble Chart Ppt PowerPoint Presentation Professional Model
This is a scatter bubble chart ppt powerpoint presentation professional model. This is a six stage process. The stages in this process are sales in profit, financial year, growth, business, marketing, strategy.
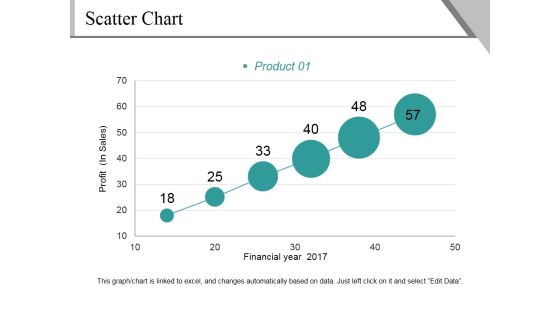
Scatter Chart Ppt PowerPoint Presentation File Background Image
This is a scatter chart ppt powerpoint presentation file background image. This is a six stage process. The stages in this process are profit, financial year, product, growth, success.
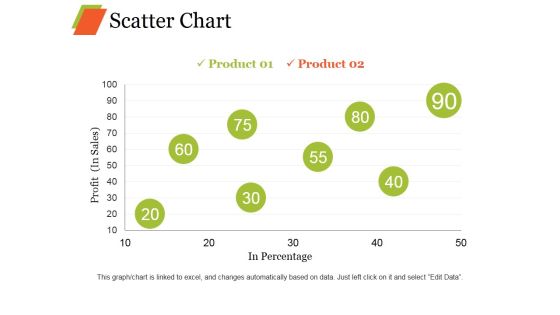
Scatter Chart Ppt PowerPoint Presentation Professional Graphic Images
This is a scatter chart ppt powerpoint presentation professional graphic images. This is a eight stage process. The stages in this process are product, profit, in percentage growth, business.
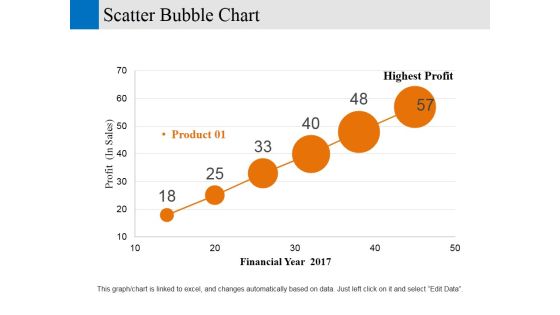
Scatter Bubble Chart Ppt PowerPoint Presentation Gallery Designs Download
This is a scatter bubble chart ppt powerpoint presentation gallery designs download. This is a six stage process. The stages in this process are financial year, profit, business, marketing, strategy.

Bubble Chart Ppt PowerPoint Presentation Layouts Clipart Images
This is a bubble chart ppt powerpoint presentation layouts clipart images. This is a two stage process. The stages in this process are business, marketing, profit, innovation, technology, idea bulb.

Manufacturing Schedule Cycle Diagram Sample
This is a manufacturing schedule cycle diagram sample. This is a six stage process. The stages in this process are delivery product on time, satisfy customer, improve customer retention, increase sales, drive revenue growth, deliver profit.
Revenue Lifecycle Diagram Powerpoint Slides Designs
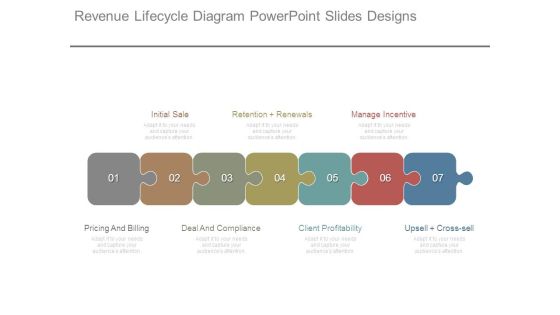
This is a revenue lifecycle diagram powerpoint slides designs. This is a seven stage process. The stages in this process are initial sale, pricing and billing, deal and compliance, client profitability, upsell cross sell, manage incentive, retention renewals.

Accounting Tips Diagram Powerpoint Slide Background
This is a accounting tips diagram powerpoint slide background. This is a eight stage process. The stages in this process are accounting, financial, verification, report, expenses, taxes, income, profits, customer.

Banking Performance Management Diagram Good Ppt Example
This is a banking performance management diagram good ppt example. This is a four stage process. The stages in this process are management information system, profitability, performance management, commercial net income forecast.

Commercial Banking Diagram Presentation Ideas
This is a commercial banking diagram presentation ideas. This is a five stage process. The stages in this process are risk management, customization, architecture services, profitability, compliance, commercial banking diagram.

Benefits Of Value Chain Analysis Diagram Slides Download
This is a benefits of value chain analysis diagram slides download. This is a six stage process. The stages in this process are improved logistics, roi, profit, globalization of supply chain and production, enhanced customer order, increasing coopetition.

Marketing Objectives Diagram Presentation Portfolio
This is a marketing objectives diagram presentation portfolio. This is a six stage process. The stages in this process are diversification, human resource, finance, improving profitability, corporate objectives, market share.

Planning Logistic Technique Superior Supply Chain Execution Roi After Successful Logistic Strategy Plan Themes PDF
This slide shows the ROI after successful logistic strategy plan which includes increasing sales revenue, bringing more profits, provide adequate budge, etc. Deliver an awe-inspiring pitch with this creative planning logistic technique superior supply chain execution roi after successful logistic strategy plan themes pdf bundle. Topics like sales revenue, profits, provide adequate budge can be discussed with this completely editable template. It is available for immediate download depending on the needs and requirements of the user.

Comparison Based On Criteria Ppt PowerPoint Presentation Gallery Themes
This is a comparison based on criteria ppt powerpoint presentation gallery themes. This is a seven stage process. The stages in this process are revenue, profit, market share, main activity, product quality.

Manufacturing Schedule Cycle Diagram Ppt Sample
This is a manufacturing schedule cycle diagram ppt sample. This is a six stage process. The stages in this process are delivery product on time, satisfy customer, improve customer retention, increase sales, drive revenue growth, deliver profit.

Sales Effectiveness Administration Diagram Powerpoint Layout
This is a sales effectiveness administration diagram powerpoint layout. This is a four stage process. The stages in this process are reduced cost of sales, increased profitability, revenue growth, increased sales effectiveness.
Product Cost Planning Sample Diagram Powerpoint Show
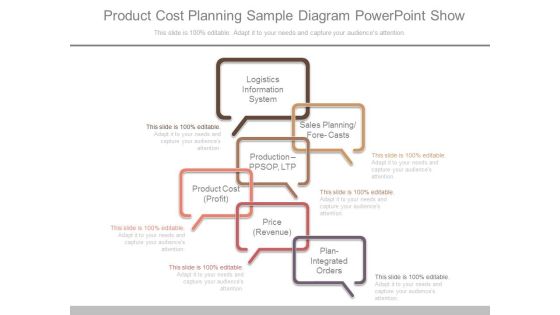
This is a product cost planning sample diagram powerpoint show. This is a six stage process. The stages in this process are logistics information system, sales planning, forecasts, production ppsop, ltp, product cost profit, price revenue, plan integrated orders.
Management Financial Report Ppt PowerPoint Presentation Diagrams
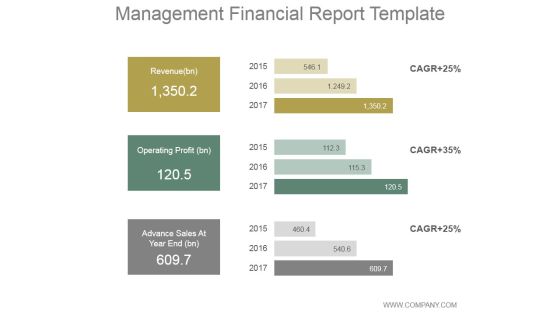
This is a management financial report ppt powerpoint presentation diagrams. This is a three stage process. The stages in this process are revenue, operating profit, advance sales at year end.

Executive Summary Ppt PowerPoint Presentation Outline Diagrams
This is a executive summary ppt powerpoint presentation outline diagrams. This is a two stage process. The stages in this process are revenue, profits, operational cost, total customers, marketing channels.

Example Of Optimized Investment Sample Diagram Powerpoint Graphics
This is a example of optimized investment sample diagram powerpoint graphics. This is a eight stage process. The stages in this process are customer, performance, profit, capital protection, leverage, yield enhancement, sales, brand growth.

Customer Satisfaction Rate Diagram Presentation Outline
This is a customer satisfaction rate diagram presentation outline. This is a six stage process. The stages in this process are idea generation, customer gets value, higher profit, customer satisfaction scores, market share increases, project delivery.

Bar Graph Finance Success PowerPoint Templates And PowerPoint Themes 0512
Microsoft Powerpoint Templates and Background with business graph with arrow showing profits-These templates can be used for presentations relating to-Business Graph, finance, money, success, shapes, arrows-Bar Graph Finance Success PowerPoint Templates And PowerPoint Themes 0512

Business Management Information Systems Diagram Presentation Deck
This is a business management information systems diagram presentation deck. This is a seven stage process. The stages in this process are corporations, consulting with a firm or as a freelancer, government, education, technology entrepreneurship, healthcare, non profits.

Leadership Development Process Diagram Ppt Images
This is a leadership development process diagram ppt images. This is a seven stage process. The stages in this process are individual coaching, evaluation, greater profit, team training, assess needs, build rapport, set context.

Reputation Management Strategy Diagram Presentation Backgrounds
This is a reputation management strategy diagram presentation backgrounds. This is a twelve stage process. The stages in this process are create massage, market, execution of strategy, customer, service, reputation, design, sales, loyalty, profit, growth, brand positioning.
Retail Banking Strategies Diagram Ppt Slide Templates
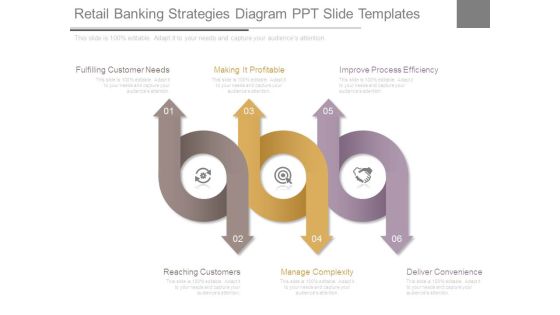
This is a retail banking strategies diagram ppt slide templates. This is a six stage process. The stages in this process are fulfilling customer needs, making it profitable, improve process efficiency, reaching customers, manage complexity, deliver convenience.
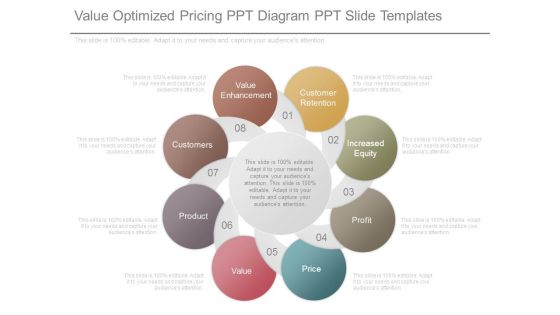
Value Optimized Pricing Ppt Diagram Ppt Slide Templates
This is a value optimized pricing ppt diagram ppt slide templates. This is a eight stage process. The stages in this process are value enhancement, customers, product, value, customer retention, increased equity, profit, price.

Components Of Brand Strength Assessment Diagram Presentation Ideas
This is a components of brand strength assessment diagram presentation ideas. This is a seven stage process. The stages in this process are benefits, experience, attitudes, strategy, positioning, brand value, profitability.

Cost And Income Optimization Impact On Companys Revenues Rules PDF
This slide covers the impact of choosing the right price optimization strategy for our company which increases companys sales and profits. Deliver an awe inspiring pitch with this creative cost and income optimization impact on companys revenues rules pdf bundle. Topics like volume, profit, revenue, 2021 to 2022 can be discussed with this completely editable template. It is available for immediate download depending on the needs and requirements of the user.

Strategic Investment Options Diagram Powerpoint Slide Design Templates
This is a strategic investment options diagram powerpoint slide design templates. This is a eight stage process. The stages in this process are value and risk modeling, asset aware investments, values, performance, investment lifecycle management, profit, growth, result.
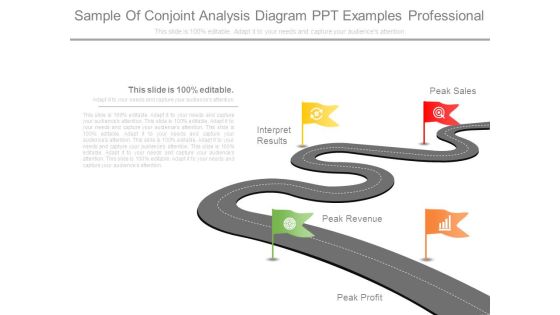
Sample Of Conjoint Analysis Diagram Ppt Examples Professional
This is a sample of conjoint analysis diagram ppt examples professional. This is a four stage process. The stages in this process are peak profit, peak revenue, interpret results, peak sales.

Competitor Analysis Template Ppt PowerPoint Presentation Pictures Diagrams
This is a competitor analysis template ppt powerpoint presentation pictures diagrams. This is a seven stage process. The stages in this process are revenue, profit, market share, number of employee, product quality, main activity.
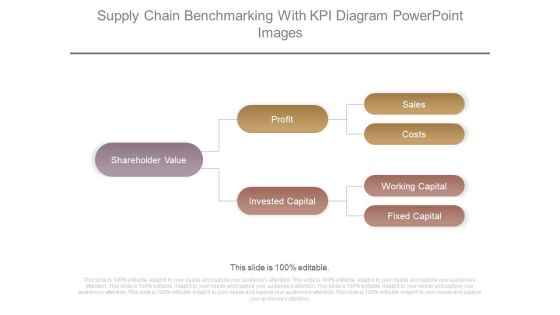
Supply Chain Benchmarking With Kpi Diagram Powerpoint Images
This is a supply chain benchmarking with kpi diagram powerpoint images. This is a three stage process. The stages in this process are shareholder value, profit, invested capital, sales, costs, working capital, fixed capital.

Business Diagram Roulette Wheel For Business Risk Presentation Template
Our above slide displays graphics of roulette wheel. Download our above diagram to express views on gambling, business risk and profit. Use this diagram to get good comments from viewers.

Business Management Information Systems Diagram Powerpoint Slide Ideas
This is a business management information systems diagram powerpoint slide ideas. This is a seven stage process. The stages in this process are corporations, non profit, healthcare, technology entrepreneurship, consulting with affirm or as a freelancer, government, education.

E Commerce Strategy Layout Sample Diagram Powerpoint Ideas
This is a e commerce strategy layout sample diagram powerpoint ideas. This is a six stage process. The stages in this process are people and culture, the offer, infrastructure, customers, channels, profit, strategy.\n\n\n\n
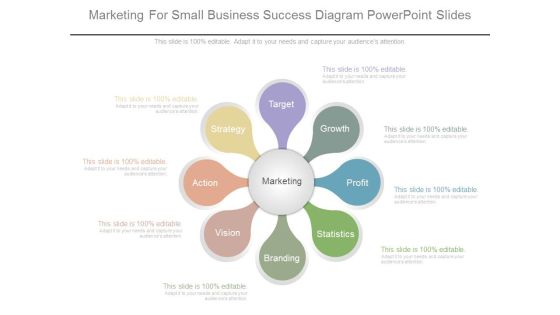
Marketing For Small Business Success Diagram Powerpoint Slides
This is a marketing for small business success diagram powerpoint slides. This is a eight stage process. The stages in this process are target, growth, profit, statistics, branding, vision, action, strategy, marketing.

Cash Flow Problems Business Diagram Ppt Sample Presentations
This is a cash flow problems business diagram ppt sample presentations. This is a five stage process. The stages in this process are overdraft at limit, taxation arrears, no working capital, creditor arrears, lack of profitability.

Process Of In Store Marketing Sample Diagram Ppt Inspiration
This is a process of in store marketing sample diagram ppt inspiration. This is a six stage process. The stages in this process are end result, improve customer service, your store front, increase sales and profits, survey responses, email marketing.
Quality Assurance In Customer Service Diagram Powerpoint Slide Show
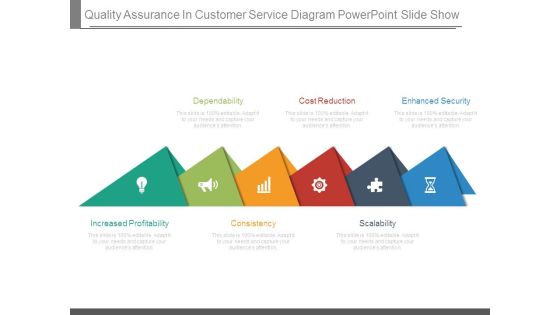
This is a quality assurance in customer service diagram powerpoint slide show. This is a six stage process. The stages in this process are dependability, cost reduction, enhanced security, scalability, consistency, increased profitability.
Cost And Income Optimization Role Of Customer Demand In Pricing Analysis Topics PDF
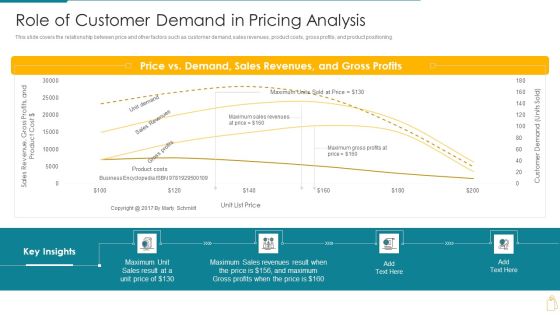
This slide covers the relationship between price and other factors such as customer demand, sales revenues, product costs, gross profits, and product positioning. Deliver an awe inspiring pitch with this creative cost and income optimization role of customer demand in pricing analysis topics pdf bundle. Topics like gross profits, sales revenues, price vs demand can be discussed with this completely editable template. It is available for immediate download depending on the needs and requirements of the user.

Tips For Effective Internal Communications Template Ppt Layout
This is a tips for effective internal communications template ppt layout. This is a five stage process. The stages in this process are informing employee, obtaining feedback, executive, strategy, profits.
Summary Financials Revenue Ebitda Pat Ppt PowerPoint Presentation Outline Infographics
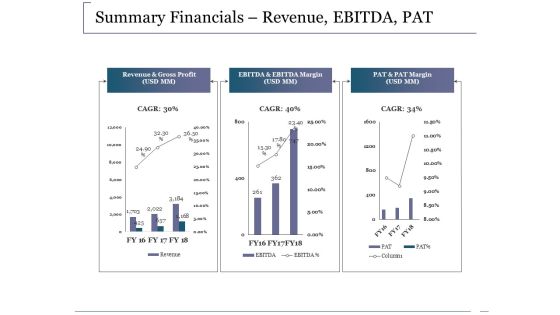
This is a summary financials revenue ebitda pat ppt powerpoint presentation outline infographics. This is a three stage process. The stages in this process are revenue and gross profit, ebitda and ebitda margin, pat and pat margin, business, marketing.

Summary Financials Revenue Ebitda Pat Ppt PowerPoint Presentation Visuals
This is a summary financials revenue ebitda pat ppt powerpoint presentation visuals. This is a three stage process. The stages in this process are revenue and gross profit, pat and pat margin, ebitda and ebitda margin.
Summary Financials Revenue Ebitda Pat Ppt PowerPoint Presentation Inspiration Templates
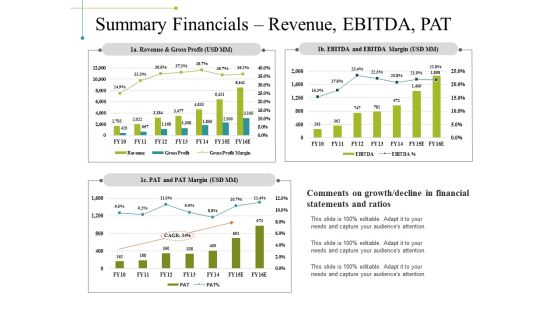
This is a summary financials revenue ebitda pat ppt powerpoint presentation inspiration templates. This is a three stage process. The stages in this process are revenue and gross profit, pat and pat margin, ebitda and ebitda margin, business, marketing.
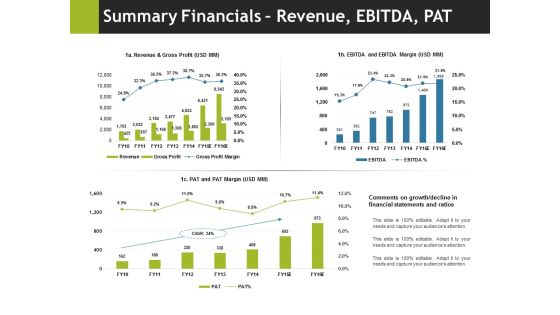
Summary Financials Revenue Ebitda Pat Ppt PowerPoint Presentation Pictures Outline
This is a summary financials revenue ebitda pat ppt powerpoint presentation pictures outline. This is a three stage process. The stages in this process are business, marketing, pat and pat margin, ebitda and ebitda margin, revenue and gross profit.

Survey With Factors To Business Corporate Success Measurement Themes PDF
The following slide illustrates customer questionnaire for measuring business success. It provides information about service quality, recognition, profitability, market share, etc. Pitch your topic with ease and precision using this Survey With Factors To Business Corporate Success Measurement Themes PDF. This layout presents information on Business And Brand, Profitability, Stock Market Performance. It is also available for immediate download and adjustment. So, changes can be made in the color, design, graphics or any other component to create a unique layout.

Consulting Slides Increasing Percentage Growth Of Sales Business Presentation
This diagram is designed with graphics of text boxes showing percentage growth. Use this diagram in presentations to display growth in sales or profit. This diagram is editable and can be easily adjusted.

Industry Overview Template 1 Ppt PowerPoint Presentation Deck
This is a industry overview template 1 ppt powerpoint presentation deck. This is a six stage process. The stages in this process are revenue, profit, annual growth, wages, annual growth, businesses.

Current State Analysis Financial Comparison Ppt Powerpoint Presentation File Graphic Tips
This is a current state analysis financial comparison ppt powerpoint presentation file graphic tips. This is a five stage process. The stages in this process are revenue, profits, cash balance.
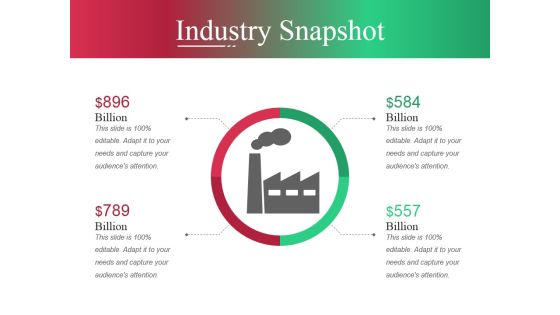
Industry Snapshot Template Ppt PowerPoint Presentation Slides Shapes
This is a industry snapshot template ppt powerpoint presentation slides shapes. This is a two stage process. The stages in this process are revenue, profit, annual growth, wages, annual growth, business.
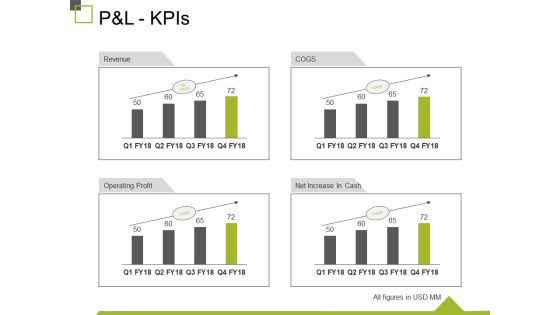
P And L Kpis Ppt PowerPoint Presentation Show Design Inspiration
This is a p and l kpis ppt powerpoint presentation show design inspiration. This is a four stage process. The stages in this process are revenue, operating profit, cogs, net increase in cash, business.

Sales Performance Dashboard Template Ppt PowerPoint Presentation Professional Elements
This is a sales performance dashboard template ppt powerpoint presentation professional elements. This is a eight stage process. The stages in this process are sales comparison, sales by product category, sales by month, brand profitability, revenue.
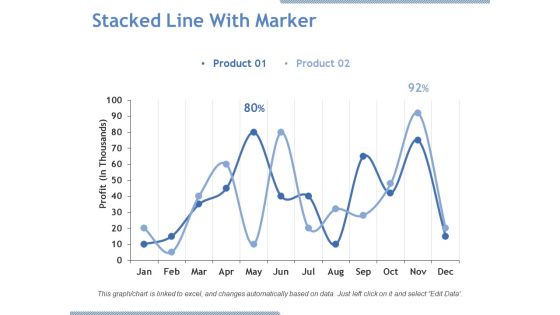
Stacked Line With Marker Ppt PowerPoint Presentation Pictures Graphics Download
This is a stacked line with marker ppt powerpoint presentation pictures graphics download. This is a two stage process. The stages in this process are product, profit, line chart, business, growth.

Three Dashboard With Percentage Value Growth Powerpoint Slides
This PowerPoint template has been designed with three dashboards. Use this PPT slide to depict rise in business profit. This professional diagram slide will help you express your views to target audience.
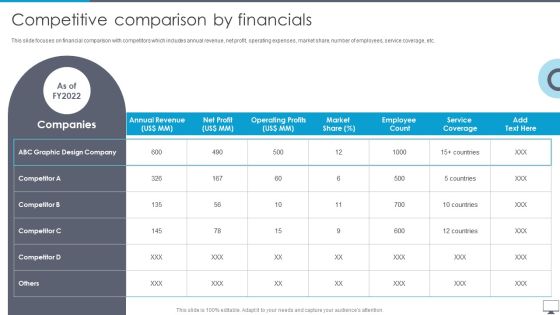
Graphic Designing And Visual Arts Company Profile Competitive Comparison By Financials Themes PDF
This slide focuses on financial comparison with competitors which includes annual revenue, net profit, operating expenses, market share, number of employees, service coverage, etc. Deliver an awe inspiring pitch with this creative Graphic Designing And Visual Arts Company Profile Competitive Comparison By Financials Themes PDF bundle. Topics like Annual Revenue, Operating Profits, Service Coverage can be discussed with this completely editable template. It is available for immediate download depending on the needs and requirements of the user.
