Process Chart
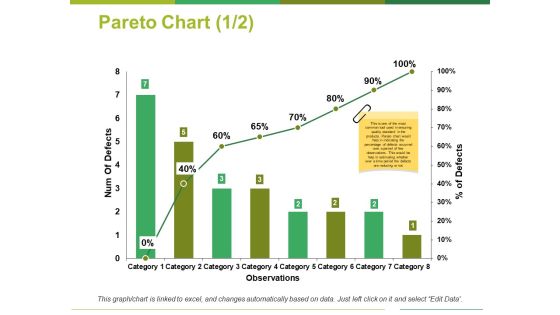
Pareto Chart Template 1 Ppt PowerPoint Presentation Outline Show
This is a pareto chart template 1 ppt powerpoint presentation outline show. This is a eight stage process. The stages in this process are num of defects, percentage of defects, observations, category.

Combo Chart Ppt PowerPoint Presentation File Visual Aids
This is a combo chart ppt powerpoint presentation file visual aids. This is a two stage process. The stages in this process are bar graph, business, marketing, finance, planning.
Scatter Chart Template 2 Ppt PowerPoint Presentation Slides Icons
This is a scatter chart template 2 ppt powerpoint presentation slides icons. This is a two stage process. The stages in this process are business, marketing, graph, in percentage, finance.

Column Chart Ppt PowerPoint Presentation Infographic Template Icon
This is a column chart ppt powerpoint presentation infographic template icon. This is a two stage process. The stages in this process are business, marketing, sales in percentage, financial year, graph.

Column Chart Finance Ppt Powerpoint Presentation Infographic Template Icon
This is a column chart finance ppt powerpoint presentation infographic template icon. This is a three stage process. The stages in this process are finance, marketing, management, investment, analysis.

Column Chart Ppt PowerPoint Presentation Slides Visual Aids
This is a column chart ppt powerpoint presentation slides visual aids. This is a six stage process. The stages in this process are bar graph, growth, success, sales in percentage, financial year.

Column Chart Ppt PowerPoint Presentation Portfolio Slide Download
This is a column chart ppt powerpoint presentation portfolio slide download. This is a two stage process. The stages in this process are product, year, bar graph, success, business.

Column Chart Ppt PowerPoint Presentation Layouts Graphics Example
This is a column chart ppt powerpoint presentation layouts graphics example. This is a two stage process. The stages in this process are product, year, bar graph, business, finance.

Combo Chart Ppt PowerPoint Presentation Pictures Graphic Images
This is a combo chart ppt powerpoint presentation pictures graphic images. This is a three stage process. The stages in this process are bar graph, growth, market size, growth rate, success.

High Low Close Chart Ppt PowerPoint Presentation Portfolio Topics
This is a high low close chart ppt powerpoint presentation portfolio topics. This is a three stage process. The stages in this process are product, market size, in years, success, bar graph.

Column Chart Ppt PowerPoint Presentation Pictures Graphic Images
This is a column chart ppt powerpoint presentation pictures graphic images. This is a two stage process. The stages in this process are product, years, growth, success, bar graph.

Column Chart Ppt PowerPoint Presentation Infographics Design Inspiration
This is a column chart ppt powerpoint presentation infographics design inspiration. This is a two stage process. The stages in this process are slide bar, marketing, strategy, finance, planning.
Donut Pie Chart Marketing Ppt PowerPoint Presentation Infographic Template Icon
This is a donut pie chart marketing ppt powerpoint presentation infographic template icon. This is a five stage process. The stages in this process are finance, marketing, analysis, business, investment.
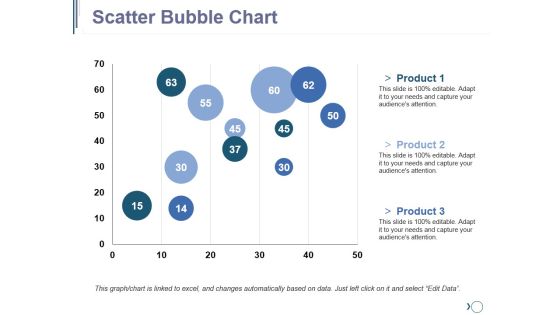
Scatter Bubble Chart Ppt PowerPoint Presentation Outline Graphics Pictures
This is a scatter bubble chart ppt powerpoint presentation outline graphics pictures. This is a three stage process. The stages in this process are finance, planning, business, marketing, strategy.
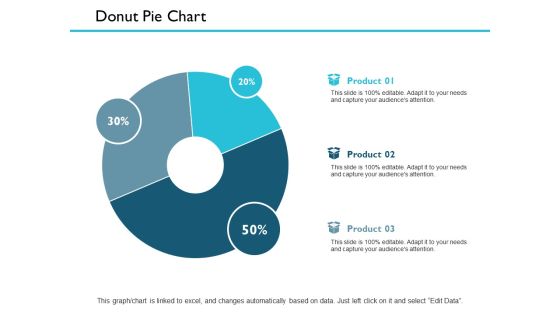
Donut Pie Chart Finance Ppt PowerPoint Presentation Outline Smartart
This is a donut pie chart finance ppt powerpoint presentation outline smartart. This is a three stage process. The stages in this process are management, marketing, business, strategy, finance.
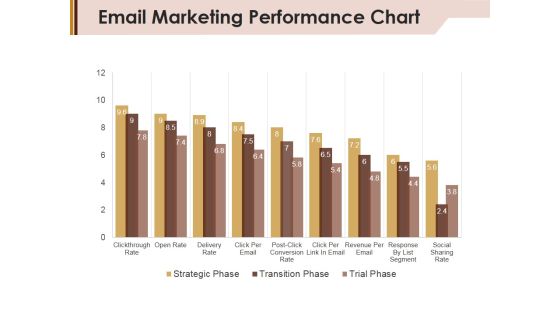
Email Marketing Performance Chart Ppt Powerpoint Presentation Layouts Graphics Pictures
This is a email marketing performance chart ppt powerpoint presentation layouts graphics pictures. This is a nine stage process. The stages in this process are strategic phase, transition phase, trial phase.

Clustered Column Line Chart Ppt PowerPoint Presentation Professional Slides
This is a clustered column line chart ppt powerpoint presentation professional slides. This is a four stage process. The stages in this process are bar, finance, business, marketing, growth.

Area Chart Marketing Finance Ppt PowerPoint Presentation Ideas Elements
This is a area chart marketing finance ppt powerpoint presentation ideas elements. This is a two stage process. The stages in this process are finance, analysis, business, investment, marketing.

Combo Chart Ppt PowerPoint Presentation Outline Graphics Tutorials
This is a combo chart ppt powerpoint presentation outline graphics tutorials. This is a three stage process. The stages in this process are units sold, years, business, marketing, graph.

Column Chart Ppt PowerPoint Presentation Outline Design Ideas
This is a column chart ppt powerpoint presentation outline design ideas. This is a two stage process. The stages in this process are business, years, expenditure in, marketing, finance.

Area Chart Ppt PowerPoint Presentation Outline Graphics Pictures
This is a area chart ppt powerpoint presentation outline graphics pictures. This is a two stage process. The stages in this process are financial year, in percentage, business, marketing, finance.

Area Chart Growth Strategy Ppt PowerPoint Presentation Infographics Themes
This is a area chart growth strategy ppt powerpoint presentation infographics themes. This is a two stage process. The stages in this process are finance, marketing, management, investment, analysis.

Pareto Chart Ppt PowerPoint Presentation File Infographic Template
This is a pareto chart ppt powerpoint presentation file infographic template. This is a six stage process. The stages in this process are number of defects, business, marketing, graph.

Scatter Chart Template 1 Ppt PowerPoint Presentation Inspiration Guidelines
This is a scatter chart template 1 ppt powerpoint presentation inspiration guidelines. This is a one stage process. The stages in this process are business, marketing, graph, values, growth.

Combo Chart Ppt PowerPoint Presentation Ideas Infographic Template
This is a combo chart ppt powerpoint presentation ideas infographic template. This is a three stage process. The stages in this process are market size growth rate, graph, business, strategy.
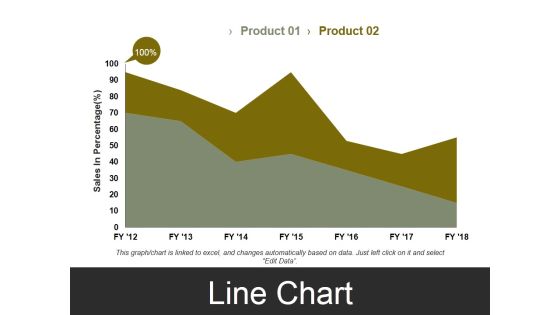
Line Chart Template 3 Ppt PowerPoint Presentation Styles Visual Aids
This is a line chart template 3 ppt powerpoint presentation styles visual aids. This is a two stage process. The stages in this process are sales in percentage, business, marketing, finance, graph.
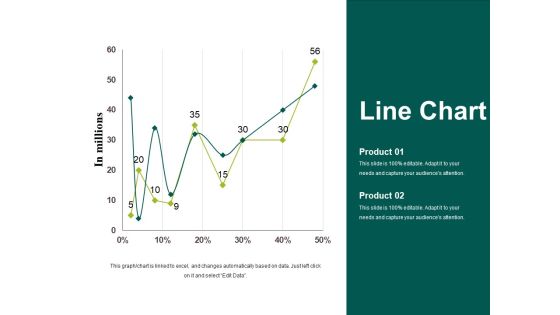
Line Chart Template 1 Ppt PowerPoint Presentation Styles Graphics Tutorials
This is a line chart template 1 ppt powerpoint presentation styles graphics tutorials. This is a two stage process. The stages in this process are in millions, business, marketing, strategy, graph.
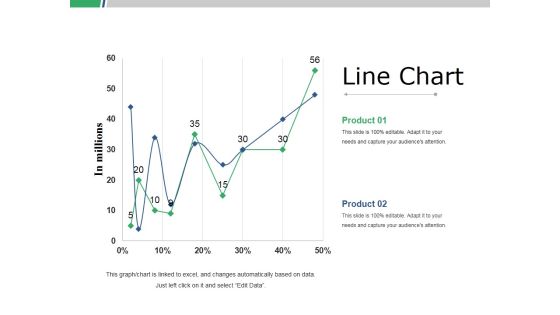
Line Chart Ppt PowerPoint Presentation Slides Graphics Template
This is a line chart ppt powerpoint presentation slides graphics template. This is a two stage process. The stages in this process are business, marketing, strategy, line graph, finance.
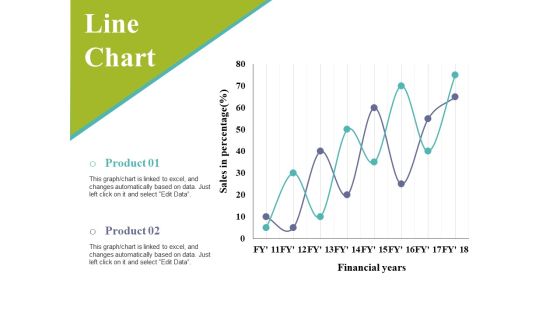
Line Chart Ppt PowerPoint Presentation Infographic Template Slides
This is a line chart ppt powerpoint presentation infographic template slides. This is a two stage process. The stages in this process are sales in percentage, financial years, business, marketing, graph.
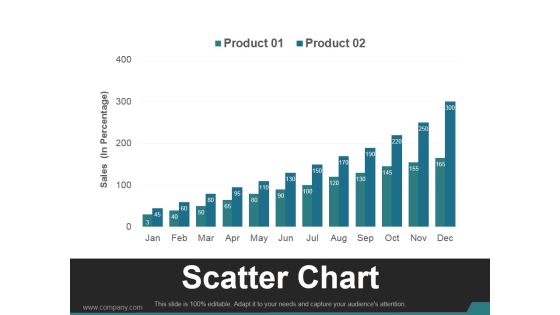
Scatter Chart Template 1 Ppt PowerPoint Presentation Visual Aids
This is a scatter chart template 1 ppt powerpoint presentation visual aids. This is a twelve stage process. The stages in this process are business, marketing, growth, finance, management.

Combo Chart Finance Ppt PowerPoint Presentation Infographic Template Microsoft
This is a combo chart finance ppt powerpoint presentation infographic template microsoft. This is a three stage process. The stages in this process are finance, marketing, management, investment, analysis.

Combo Chart Finance Ppt PowerPoint Presentation Infographic Template Graphics
This is a combo chart finance ppt powerpoint presentation infographic template graphics. This is a two stage process. The stages in this process are growth, finance, marketing, management, investment.

Area Chart Finance Ppt PowerPoint Presentation Summary Design Templates
This is a area chart finance ppt powerpoint presentation summary design templates. This is a two stage process. The stages in this process are finance, marketing, management, investment, analysis.

Donut Pie Chart Ppt PowerPoint Presentation Infographic Template Slides
This is a donut pie chart ppt powerpoint presentation infographic template slides. This is a three stage process. The stages in this process are percentage, product, business, management, marketing.

Combo Chart Product Ppt PowerPoint Presentation Professional Graphics Template
This is a combo chart product ppt powerpoint presentation professional graphics template. This is a three stage process. The stages in this process are finance, marketing, management, investment, product.
Open High Low Close Chart Ppt PowerPoint Presentation Icon Portrait
This is a open high low close chart ppt powerpoint presentation icon portrait. This is a two stage process. The stages in this process are business, management, marketing, percentage, product.
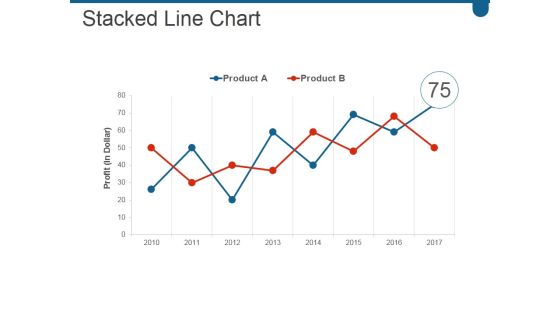
Stacked Line Chart Ppt PowerPoint Presentation Infographic Template Show
This is a stacked line chart ppt powerpoint presentation infographic template show. This is a two stage process. The stages in this process are business, marketing, growth, success, line.

Combo Chart Ppt PowerPoint Presentation Infographic Template Deck
This is a combo chart ppt powerpoint presentation infographic template deck. This is a eight stage process. The stages in this process are business, strategy, marketing, analysis, growth strategy, market size.

Combo Chart Ppt PowerPoint Presentation Infographic Template Influencers
This is a combo chart ppt powerpoint presentation infographic template influencers. This is a three stage process. The stages in this process are market size rmb million, growth rate.

Scatter Bubble Chart Ppt PowerPoint Presentation Infographic Template Examples
This is a scatter bubble chart ppt powerpoint presentation infographic template examples. This is a two stage process. The stages in this process are highest sale, product, in price, finance, business.

Line Chart Ppt PowerPoint Presentation Infographic Template Master Slide
This is a line chart ppt powerpoint presentation infographic template master slide. This is a two stage process. The stages in this process are product, financial years, sales in percentage.

Pareto Chart Template 1 Ppt PowerPoint Presentation File Ideas
This is a pareto chart template 1 ppt powerpoint presentation file ideas. This is a eight stage process. The stages in this process are business, finance, marketing, strategy, analysis.
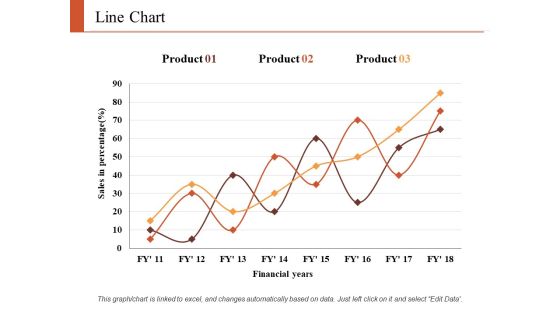
Line Chart Finance Ppt PowerPoint Presentation Infographic Template Graphics Tutorials
This is a line chart finance ppt powerpoint presentation infographic template graphics tutorials. This is a three stage process. The stages in this process are finance, marketing, analysis, business, investment.

Daunt Pie Chart Investment Ppt PowerPoint Presentation Infographic Template Aids
This is a daunt pie chart investment ppt powerpoint presentation infographic template aids. This is a four stage process. The stages in this process are finance, analysis, business, investment, marketing.

Clustered Column Chart Investment Ppt PowerPoint Presentation Infographic Template Clipart
This is a clustered column chart investment ppt powerpoint presentation infographic template clipart. This is a four stage process. The stages in this process are finance, analysis, business, investment, marketing.

Column Chart Finance Investment Ppt PowerPoint Presentation Inspiration Template
This is a column chart finance investment ppt powerpoint presentation inspiration template. This is a two stage process. The stages in this process are finance, analysis, business, investment, marketing.

Column Chart Marketing Finance Ppt PowerPoint Presentation Infographic Template Rules
This is a column chart marketing finance ppt powerpoint presentation infographic template rules. This is a two stage process. The stages in this process are finance, analysis, business, investment, marketing.

Combo Chart Investment Ppt PowerPoint Presentation Summary Infographic Template
This is a combo chart investment ppt powerpoint presentation summary infographic template. This is a three stage process. The stages in this process are finance, analysis, business, investment, marketing.
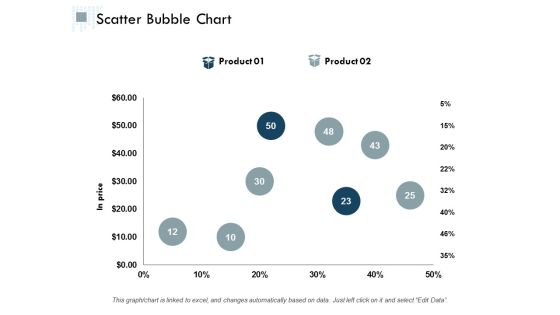
Scatter Bubble Chart Ppt PowerPoint Presentation Infographic Template Graphics Design
This is a scatter bubble chart ppt powerpoint presentation infographic template graphics design. This is a two stage process. The stages in this process are finance, analysis, business, investment, marketing.
Open High Low Close Chart Ppt PowerPoint Presentation Gallery Icons
This is a open high low close chart ppt powerpoint presentation gallery icons. This is a five stage process. The stages in this process are business, marketing, finance, planning, strategy.

Clustered Column Chart Planning Ppt PowerPoint Presentation Portfolio Information
This is a clustered column chart planning ppt powerpoint presentation portfolio information. This is a four stage process. The stages in this process are finance, marketing, analysis, business, investment.
Donut Pie Chart Ppt PowerPoint Presentation Icon Background Designs
This is a donut pie chart ppt powerpoint presentation icon background designs. This is a four stage process. The stages in this process are product, percentage, finance, donut, business.

cost volume profit analysis chart ppt powerpoint presentation icon slideshow
This is a cost volume profit analysis chart ppt powerpoint presentation icon slideshow. This is a three stage process. The stages in this process are break even point,break even analysis,break even level.
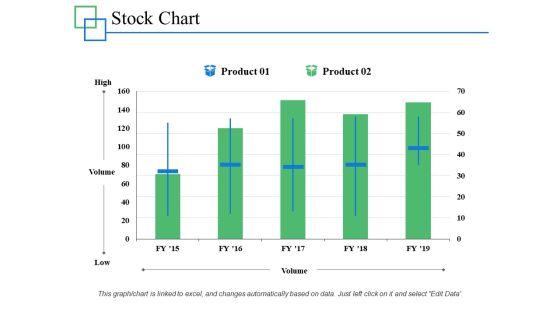
Stock Chart Management Investment Ppt PowerPoint Presentation Infographics Professional
This is a stock chart management investment ppt powerpoint presentation infographics professional. This is a two stage process. The stages in this process are marketing, business, management, percentage, product.
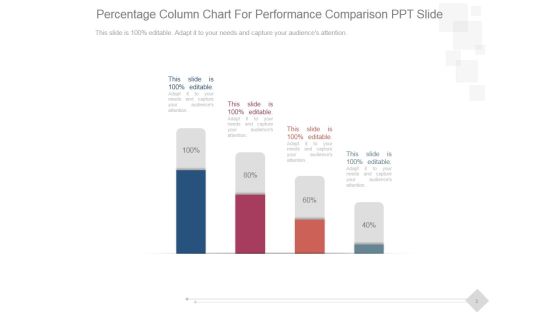
Percentage Column Chart For Performance Comparison Ppt PowerPoint Presentation Good
This is a percentage column chart for performance comparison ppt powerpoint presentation good. This is a four stage process. The stages in this process are business, marketing, technology, presentation, management.
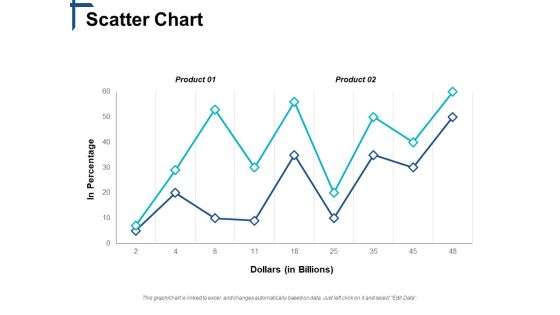
Scatter Chart Competitive Differentiation Ppt PowerPoint Presentation Show Slides
This is a scatter chart competitive differentiation ppt powerpoint presentation show slides. This is a two stage process. The stages in this process are business, management, marketing, strategy, sales.
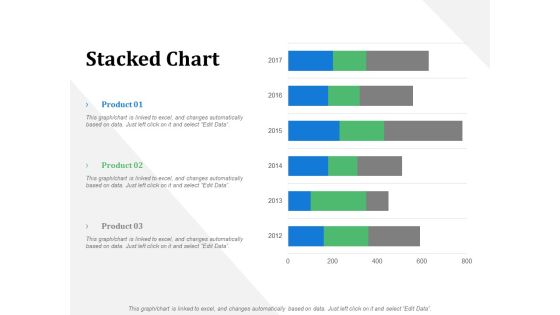
Stacked Chart Business Marketing Ppt PowerPoint Presentation File Design Ideas
This is a stacked chart business marketing ppt powerpoint presentation file design ideas. This is a three stage process. The stages in this process are business, management, marketing, product, percentage.

Bubble Chart Percentage Product Ppt PowerPoint Presentation Ideas Aids
This is a bubble chart percentage product ppt powerpoint presentation ideas aids. This is a two stage process. The stages in this process are business, management, marketing, percentage, product.

Combo Chart Ppt PowerPoint Presentation Summary Graphics Tutorials
This is a combo chart ppt powerpoint presentation summary graphics tutorials. This is a eight stage process. The stages in this process are product, growth rate, market size, business.

High Low Close Chart Ppt Powerpoint Presentation Gallery Slides
This is a high low close chart ppt powerpoint presentation gallery slides. This is a five stage process. The stages in this process are close, volume, high, low, graph.
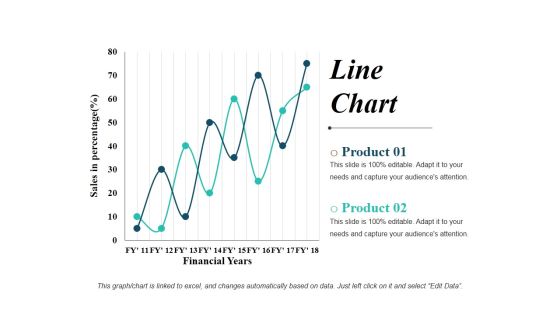
Line Chart Ppt PowerPoint Presentation Show Graphics Design
This is a line chart ppt powerpoint presentation show graphics design. This is a two stage process. The stages in this process are line graph, business, marketing, finance, planning.

Open High Low Close Chart Ppt PowerPoint Presentation Styles Example
This is a open high low close chart ppt powerpoint presentation styles example. This is a four stage process. The stages in this process are business, marketing, finance, strategy, planning.
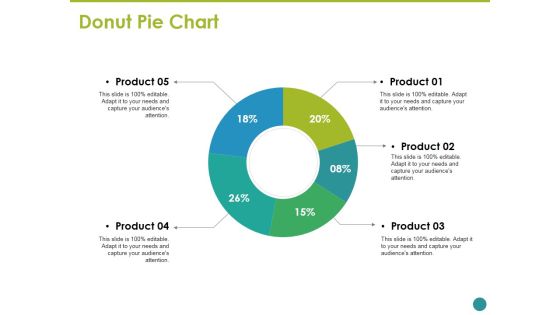
Donut Pie Chart Ppt PowerPoint Presentation Inspiration Graphic Images
This is a donut pie chart ppt powerpoint presentation inspiration graphic images. This is a five stage process. The stages in this process are business, marketing, strategy, planning, donut.

Clustered Column Line Chart Ppt PowerPoint Presentation Inspiration Graphics Pictures
This is a clustered column line chart ppt powerpoint presentation inspiration graphics pictures. This is a four stage process. The stages in this process are business, marketing, strategy, planning, finance.
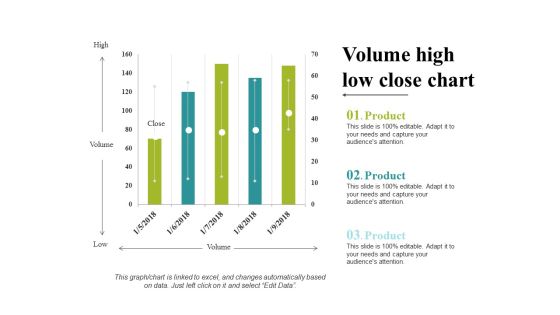
Volume High Low Close Chart Ppt PowerPoint Presentation Portfolio Clipart
This is a volume high low close chart ppt powerpoint presentation portfolio clipart. This is a five stage process. The stages in this process are business, marketing, strategy, planning, finance.
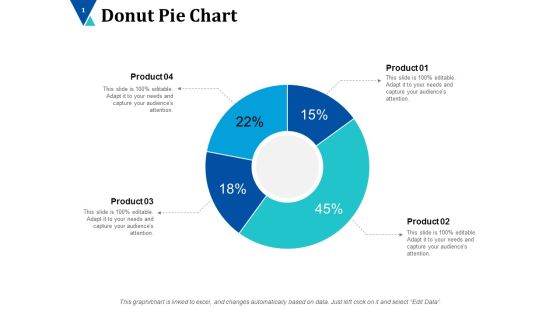
Donut Pie Chart Ppt PowerPoint Presentation Inspiration Designs Download
This is a donut pie chart ppt powerpoint presentation inspiration designs download. This is a four stage process. The stages in this process are donut, business, planning, marketing, finance.
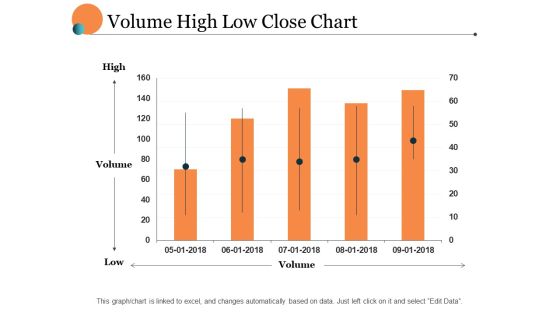
Volume High Low Close Chart Ppt PowerPoint Presentation Portfolio Layout
This is a volume high low close chart ppt powerpoint presentation portfolio layout. This is a five stage process. The stages in this process are finance, marketing, management, investment, analysis.
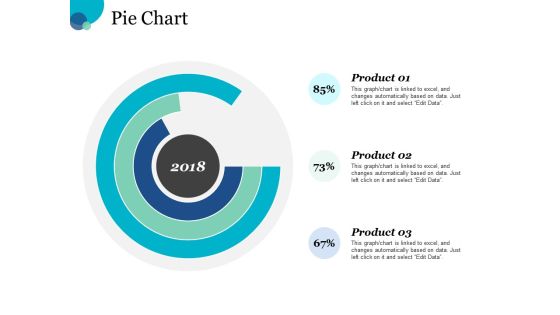
Pie Chart Finance Ppt PowerPoint Presentation Slides Graphic Images
This is a pie chart finance ppt powerpoint presentation slides graphic images. This is a three stage process. The stages in this process are finance, marketing, management, investment, analysis.
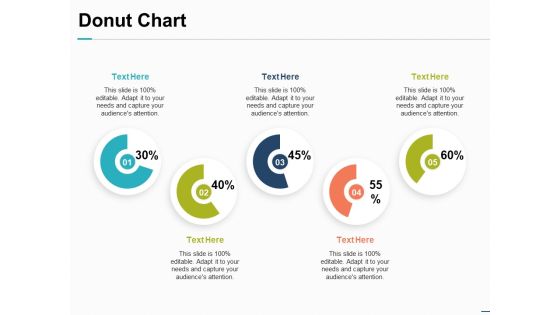
Donut Chart Financial Investment Ppt PowerPoint Presentation Inspiration Introduction
This is a donut chart financial investment ppt powerpoint presentation inspiration introduction. This is a five stage process. The stages in this process are finance, marketing, management, investment, analysis.

Area Chart Investment Ppt PowerPoint Presentation Summary Design Inspiration
This is a area chart investment ppt powerpoint presentation summary design inspiration. This is a three stage process. The stages in this process are finance, marketing, management, investment, analysis.

Donut Chart Marketing Product Ppt PowerPoint Presentation Slides Background Designs
This is a donut chart marketing product ppt powerpoint presentation slides background designs. This is a three stage process. The stages in this process are business, management, marketing, percentage, product.

Bubble Chart Product Ppt PowerPoint Presentation Inspiration Design Ideas
This is a bubble chart product ppt powerpoint presentation inspiration design ideas. This is a one stage process. The stages in this process are business, management, marketing, product, percentage.
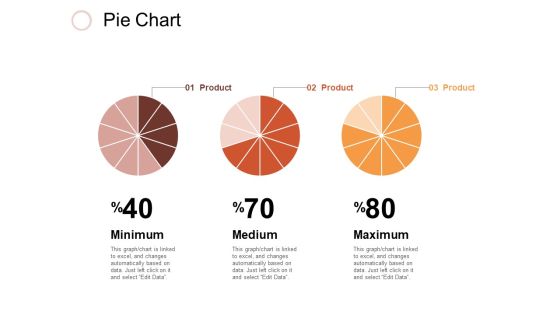
Pie Chart Investment Ppt PowerPoint Presentation Inspiration Design Inspiration
This is a pie chart investment ppt powerpoint presentation inspiration design inspiration. This is a three stage process. The stages in this process are business, management, marketing, percentage, product.

Bubble Chart Percentage Ppt PowerPoint Presentation File Layouts
This is a bubble chart percentage ppt powerpoint presentation file layouts. This is a two stage process. The stages in this process are finance, marketing, management, investment, product, percentage.

Column Chart Marketing Strategy Ppt PowerPoint Presentation Layouts Slide Portrait
This is a column chart marketing strategy ppt powerpoint presentation layouts slide portrait. This is a two stage process. The stages in this process are percentage, product, business, management, marketing.
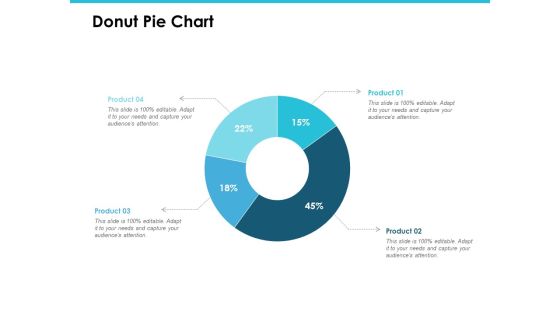
Donut Pie Chart Investment Analysis Ppt PowerPoint Presentation Gallery Introduction
This is a donut pie chart investment analysis ppt powerpoint presentation gallery introduction. This is a four stage process. The stages in this process are finance, marketing, management, investment, analysis.

Column Chart Ppt PowerPoint Presentation Show Background Images
This is a column chart ppt powerpoint presentation show background images. This is a nine stage process. The stages in this process are business, strategy, marketing, analysis, growth strategy.

Scatter Bubble Chart Ppt PowerPoint Presentation Pictures Show
This is a scatter bubble chart ppt powerpoint presentation pictures show. This is a eight stage process. The stages in this process are business, strategy, analysis, pretention, highest sale.

High Low Close Chart Ppt PowerPoint Presentation Layouts Guide
This is a high low close chart ppt powerpoint presentation layouts guide. This is a ten stage process. The stages in this process are high, volume, low, business, marketing, finance.

Area Chart Ppt PowerPoint Presentation Inspiration Slide Download
This is a area chart ppt powerpoint presentation inspiration slide download. This is a two stage process. The stages in this process are product, in percentage, business, growth, strategy, finance.

High Low Close Chart Ppt PowerPoint Presentation Ideas Brochure
This is a high low close chart ppt powerpoint presentation ideas brochure. This is a three stage process. The stages in this process are in percentage, product, business, marketing, finance.
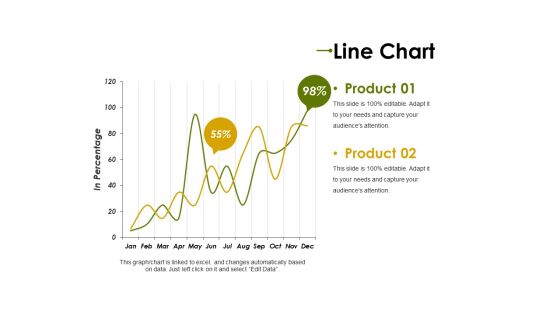
Line Chart Ppt PowerPoint Presentation Professional Clipart Images
This is a line chart ppt powerpoint presentation professional clipart images. This is a two stage process. The stages in this process are product, in percentage, graph, percentage, finance, business.

Line Chart Ppt PowerPoint Presentation Show Background Designs
This is a line chart ppt powerpoint presentation show background designs. This is a two stage process. The stages in this process are product, in months, in percentage, business.
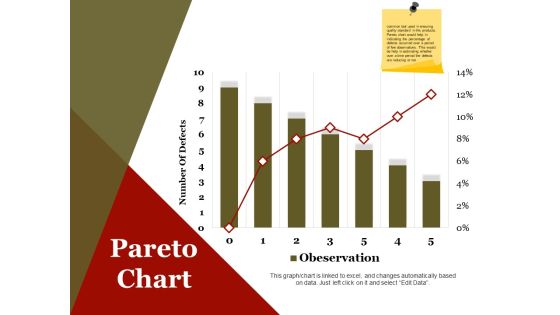
Pareto Chart Ppt PowerPoint Presentation Infographics Design Inspiration
This is a pareto chart ppt powerpoint presentation infographics design inspiration. This is a seven stage process. The stages in this process are number of defects, business, marketing, finance.

Combo Chart Ppt PowerPoint Presentation Professional Slide Download
This is a combo chart ppt powerpoint presentation professional slide download. This is a three stage process. The stages in this process are market size, growth rate, product, graph, growth.
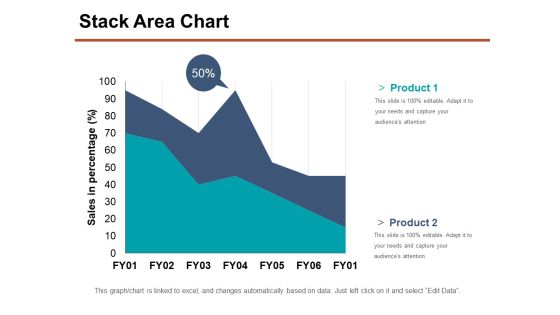
Stack Area Chart Ppt PowerPoint Presentation Show Samples
This is a stack area chart ppt powerpoint presentation show samples. This is a two stage process. The stages in this process are product, sales in percentage, business, marketing, percentage.

High Low Close Chart Ppt PowerPoint Presentation Layouts Objects
This is a high low close chart ppt powerpoint presentation layouts objects. This is a five stage process. The stages in this process are high, volume, low, business, marketing.
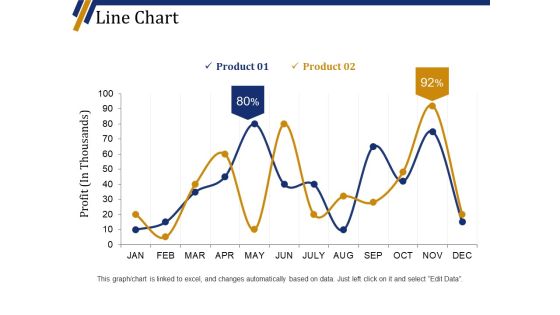
Line Chart Ppt PowerPoint Presentation Portfolio Background Designs
This is a line chart ppt powerpoint presentation portfolio background designs. This is a two stage process. The stages in this process are product, business, finance, marketing, profit in thousands.
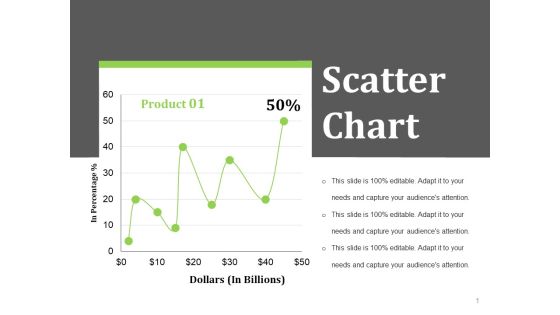
Scatter Chart Ppt PowerPoint Presentation Styles Layout Ideas
This is a scatter chart ppt powerpoint presentation styles layout ideas. This is a one stage process. The stages in this process are dollars in billions, in percentage, business, finance.
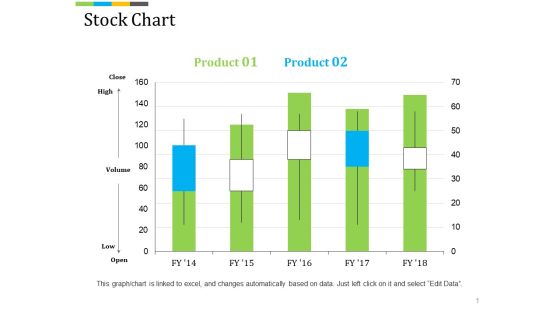
Stock Chart Ppt PowerPoint Presentation Professional Background Image
This is a stock chart ppt powerpoint presentation professional background image. This is a five stage process. The stages in this process are high, volume, low, finance, business, marketing.

Combo Chart Ppt PowerPoint Presentation Infographics Example Introduction
This is a combo chart ppt powerpoint presentation infographics example introduction. This is a four stage process. The stages in this process are units sold, business, marketing, graph, growth.
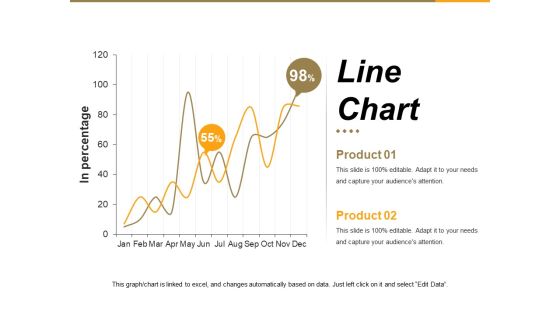
Line Chart Ppt PowerPoint Presentation Summary File Formats
This is a line chart ppt powerpoint presentation summary file formats. This is a two stage process. The stages in this process are in percentage, graph, business, marketing, growth.

Stock Chart Ppt PowerPoint Presentation Summary File Formats
This is a stock chart ppt powerpoint presentation summary file formats. This is a five stage process. The stages in this process are high, volume, low, business, graph, finance.

Column Chart Ppt PowerPoint Presentation Show Master Slide
This is a column chart ppt powerpoint presentation show master slide. This is a six stage process. The stages in this process are financial, years, business, marketing, finance, graph.
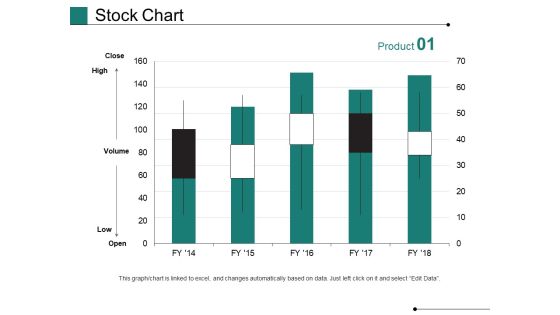
Stock Chart Ppt PowerPoint Presentation Pictures Graphics Design
This is a stock chart ppt powerpoint presentation pictures graphics design. This is a five stage process. The stages in this process are high, volume, low, business, marketing, graph.

Scatter Bubble Chart Ppt PowerPoint Presentation Gallery Example Introduction
This is a scatter bubble chart ppt powerpoint presentation gallery example introduction. This is a eight stage process. The stages in this process are business, marketing, finance, bubble, scatter.
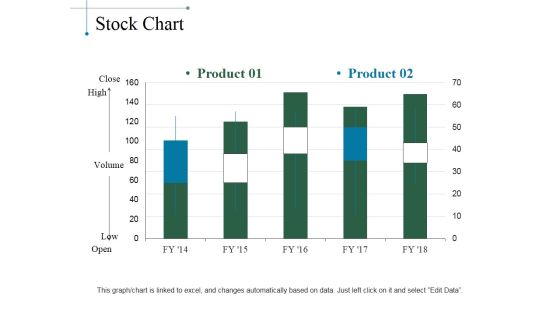
Stock Chart Ppt PowerPoint Presentation Layouts Designs Download
This is a stock chart ppt powerpoint presentation layouts designs download. This is a five stage process. The stages in this process are product, close, high, volume, low, open.

Line Chart Ppt PowerPoint Presentation Infographics Graphic Images
This is a line chart ppt powerpoint presentation infographics graphic images. This is a two stage process. The stages in this process are sales in percentage, financial years, growth, business, marketing.

Line Chart Ppt PowerPoint Presentation Professional Graphics Design
This is a line chart ppt powerpoint presentation professional graphics design. This is a two stage process. The stages in this process are financial years, sales in percentage, product, growth, success.
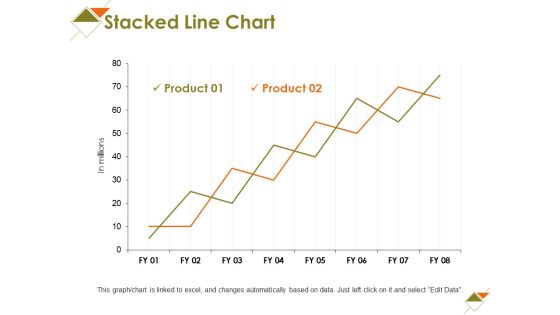
Stacked Line Chart Ppt PowerPoint Presentation File Display
This is a stacked line chart ppt powerpoint presentation file display. This is a two stage process. The stages in this process are business, marketing, graph, strategy, in millions.

Volume High Low Close Chart Ppt PowerPoint Presentation Slides Styles
This is a volume high low close chart ppt powerpoint presentation slides styles. This is a two stage process. The stages in this process are high, volume, low, business, marketing.

Column Chart Ppt PowerPoint Presentation Infographics Layout Ideas
This is a column chart ppt powerpoint presentation infographics layout ideas. This is a two stage process. The stages in this process are financial year in, business, marketing, growth, graph.
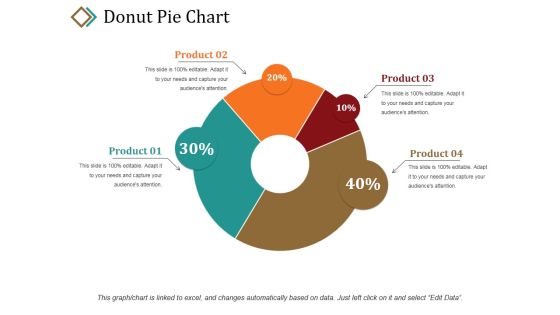
Donut Pie Chart Ppt PowerPoint Presentation Portfolio Graphic Tips
This is a donut pie chart ppt powerpoint presentation portfolio graphic tips. This is a four stage process. The stages in this process are product, percentage, business, marketing, donut.

Line Chart Ppt PowerPoint Presentation File Example File
This is a line chart ppt powerpoint presentation file example file. This is a two stage process. The stages in this process are product, in percentage, in years, growth, success.

Clustered Column Chart Ppt PowerPoint Presentation Show Slideshow
This is a clustered column chart ppt powerpoint presentation show slideshow. This is a six stage process. The stages in this process are financial year in, sales in percentage, business, marketing, finance.

Column Chart Ppt PowerPoint Presentation Layouts Background Images
This is a column chart ppt powerpoint presentation layouts background images. This is a two stage process. The stages in this process are product, in months, graph, growth, success.

Line Chart Ppt PowerPoint Presentation Gallery Example Topics
This is a line chart ppt powerpoint presentation gallery example topics. This is a two stage process. The stages in this process are in millions, business, marketing, strategy, graph.
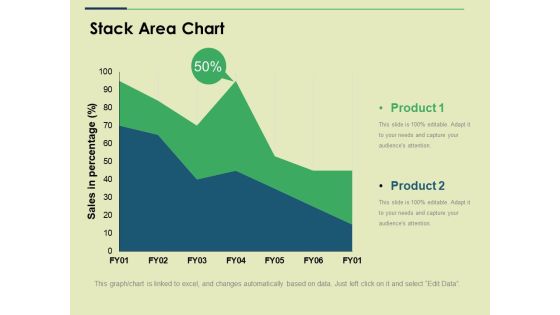
Stack Area Chart Ppt PowerPoint Presentation Show Slide
This is a stack area chart ppt powerpoint presentation show slide. This is a two stage process. The stages in this process are sales in percentage, business, marketing, strategy, graph.
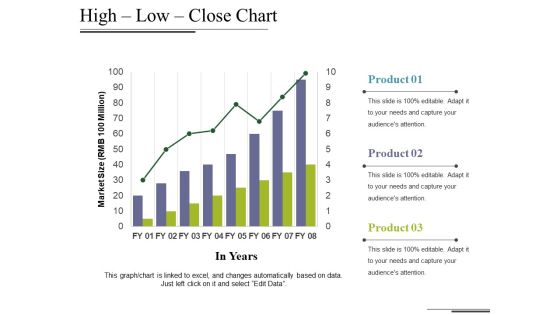
High Low Close Chart Ppt PowerPoint Presentation Styles Maker
This is a high low close chart ppt powerpoint presentation styles maker. This is a three stage process. The stages in this process are market size, in years, growth, business, marketing, graph.
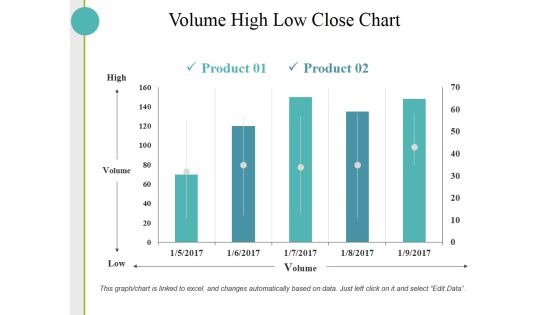
Volume High Low Close Chart Ppt PowerPoint Presentation Inspiration Skills
This is a volume high low close chart ppt powerpoint presentation inspiration skills. This is a two stage process. The stages in this process are high, volume, low, business.
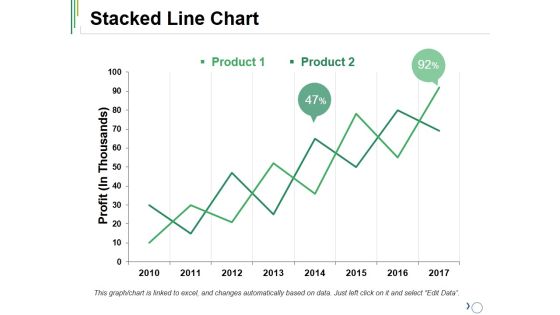
Stacked Line Chart Ppt PowerPoint Presentation Ideas Outfit
This is a stacked line chart ppt powerpoint presentation ideas outfit. This is a two stage process. The stages in this process are product, stacked line, profit, growth, success.

Combo Chart Ppt PowerPoint Presentation Styles Example Introduction
This is a combo chart ppt powerpoint presentation styles example introduction. This is a three stage process. The stages in this process are product, growth rate, market size, growth, success.

Column Chart Ppt PowerPoint Presentation Styles Graphics Design
This is a column chart ppt powerpoint presentation styles graphics design. This is a two stage process. The stages in this process are expenditure in, product, years, growth, success.

Scatter Bubble Chart Ppt PowerPoint Presentation Gallery Show
This is a scatter bubble chart ppt powerpoint presentation gallery show. This is a two stage process. The stages in this process are profit, in percentage, finance, marketing, business.

Area Chart Ppt PowerPoint Presentation Portfolio Graphics Design
This is a area chart ppt powerpoint presentation portfolio graphics design. This is a two stage process. The stages in this process are business, marketing, in percentage, graph, finance.
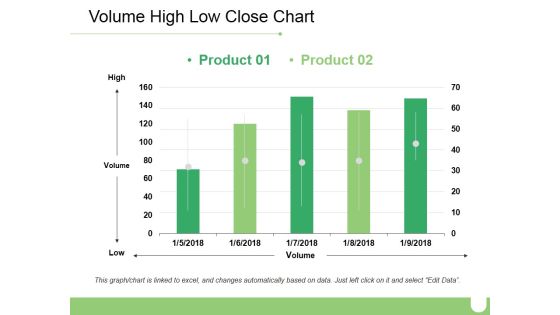
Volume High Low Close Chart Ppt PowerPoint Presentation Inspiration Brochure
This is a volume high low close chart ppt powerpoint presentation inspiration brochure. This is a two stage process. The stages in this process are business, high, volume, low, marketing.
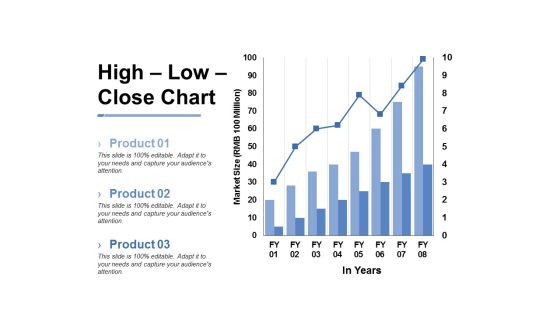
High Low Close Chart Ppt PowerPoint Presentation Inspiration Slide
This is a high low close chart ppt powerpoint presentation inspiration slide. This is a three stage process. The stages in this process are business, marketing, market size, in years, graph.
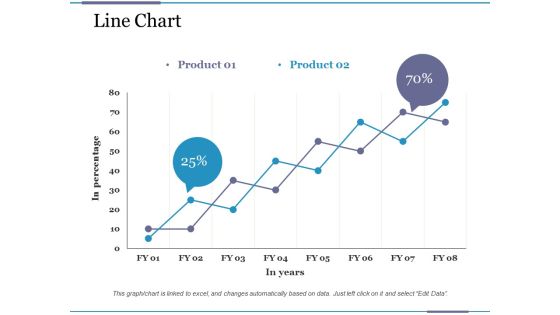
Line Chart Ppt PowerPoint Presentation Pictures File Formats
This is a line chart ppt powerpoint presentation pictures file formats. This is a two stage process. The stages in this process are business, financial, in percentage, in years, graph.

Column Chart Ppt PowerPoint Presentation Layouts Graphic Images
This is a column chart ppt powerpoint presentation layouts graphic images. This is a two stage process. The stages in this process are business, finance, years, graph, expenditure in, marketing.

Combo Chart Ppt PowerPoint Presentation Gallery Design Ideas
This is a combo chart ppt powerpoint presentation gallery design ideas. This is a three stage process. The stages in this process are business, financial years, sales in percentage, finance, graph.

Donut Pie Chart Ppt PowerPoint Presentation Pictures Layout Ideas
This is a donut pie chart ppt powerpoint presentation pictures layout ideas. This is a four stage process. The stages in this process are percentage, finance, donut, business, product.

Combo Chart Ppt PowerPoint Presentation Summary Background Images
This is a combo chart ppt powerpoint presentation summary background images. This is a two stage process. The stages in this process are business, marketing, financial year, in percentage, graph.

Area Chart Ppt PowerPoint Presentation Layouts Graphic Images
This is a area chart ppt powerpoint presentation layouts graphic images. This is a three stage process. The stages in this process are business, in years, marketing, in percentage, finance, graph.

Regression Line Chart Ppt PowerPoint Presentation Visual Aids Summary
This is a regression line chart ppt powerpoint presentation visual aids summary. This is a two stage process. The stages in this process are linear periodization, linear growth, linear progression.
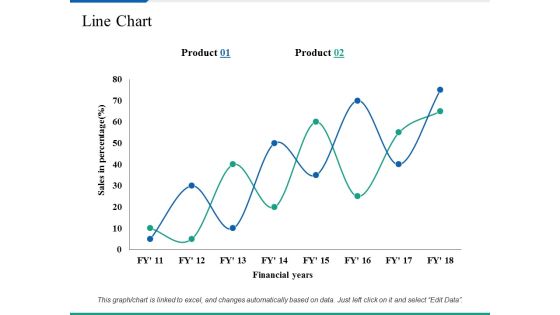
Line Chart Ppt PowerPoint Presentation Summary Clipart Images
This is a line chart ppt powerpoint presentation summary clipart images. This is a two stage process. The stages in this process are business, marketing, sales in percentage, financial years, strategy.

Clustered Column Chart Ppt PowerPoint Presentation Professional Ideas
This is a clustered column chart ppt powerpoint presentation professional ideas. This is a three stage process. The stages in this process are product, sales in percentage, column, years.

Pie Chart Finance Ppt PowerPoint Presentation Styles File Formats
This is a pie chart finance ppt powerpoint presentation styles file formats. This is a four stage process. The stages in this process are finance, analysis, business, investment, marketing.

Pie Chart Marketing Finance Ppt PowerPoint Presentation Gallery Good
This is a pie chart marketing finance ppt powerpoint presentation gallery good. This is a three stage process. The stages in this process are finance, analysis, business, investment, marketing.

Donut Pie Chart Finance Ppt PowerPoint Presentation Inspiration Graphics
This is a donut pie chart finance ppt powerpoint presentation inspiration graphics. This is a three stage process. The stages in this process are finance, analysis, business, investment, marketing.

Combo Chart Finance Marketing Ppt PowerPoint Presentation File Guidelines
This is a combo chart finance marketing ppt powerpoint presentation file guidelines. This is a three stage process. The stages in this process are finance, analysis, business, investment, marketing.

Area Chart Finance Ppt PowerPoint Presentation Styles Designs Download
This is a area chart finance ppt powerpoint presentation styles designs download. This is a three stage process. The stages in this process are finance, analysis, business, investment, marketing.

Clustered Column Chart Finance Ppt PowerPoint Presentation Gallery Styles
This is a clustered column chart finance ppt powerpoint presentation gallery styles. This is a three stage process. The stages in this process are finance, analysis, business, investment, marketing.
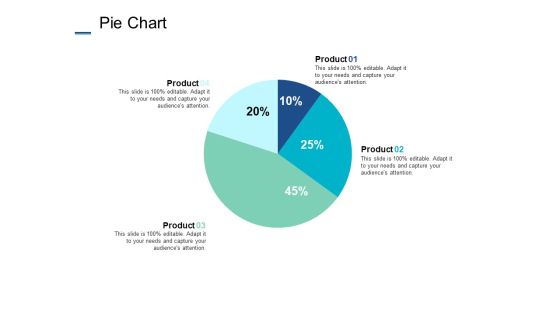
Pie Chart Finance Marketing Ppt PowerPoint Presentation Styles Outfit
This is a pie chart finance marketing ppt powerpoint presentation styles outfit. This is a four stage process. The stages in this process are finance, analysis, business, investment, marketing.

Pie Chart Marketing Finance Ppt PowerPoint Presentation File Guidelines
This is a pie chart marketing finance ppt powerpoint presentation file guidelines. This is a three stage process. The stages in this process are finance, analysis, business, investment, marketing.

Area Chart Finance Marketing Ppt PowerPoint Presentation Gallery Graphics Design
This is a area chart finance marketing ppt powerpoint presentation gallery graphics design. This is a three stage process. The stages in this process are finance, analysis, business, investment, marketing.
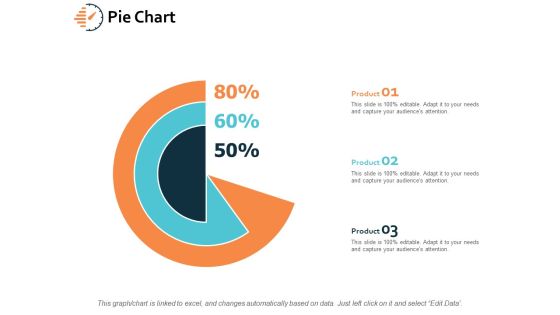
Pie Chart Investment Finance Ppt PowerPoint Presentation File Influencers
This is a pie chart investment finance ppt powerpoint presentation file influencers. This is a three stage process. The stages in this process are finance, analysis, business, investment, marketing.

Clustered Chart Finance Marketing Ppt PowerPoint Presentation Layouts Outfit
This is a clustered chart finance marketing ppt powerpoint presentation layouts outfit. This is a four stage process. The stages in this process are finance, analysis, business, investment, marketing.

Email Marketing Performance Chart Ppt PowerPoint Presentation Model Topics
This is a email marketing performance chart ppt powerpoint presentation model topics. This is a three stage process. The stages in this process are strategic phase, transition phase, trial phase.

Bar Chart Ppt PowerPoint Presentation Icon Design Templates
This is a bar chart ppt powerpoint presentation icon design templates. This is a nine stage process. The stages in this process are sales in percentage, bar graph, business, marketing, growth.

Bar Chart Ppt PowerPoint Presentation Infographic Template Brochure
This is a bar chart ppt powerpoint presentation infographic template brochure. This is a seven stage process. The stages in this process are bar graph, finance, marketing, strategy, analysis, business.
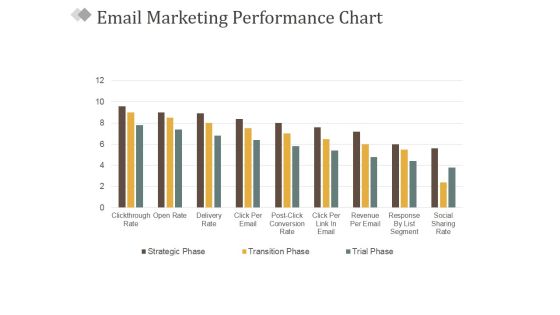
Email Marketing Performance Chart Ppt PowerPoint Presentation Gallery Elements
This is a email marketing performance chart ppt powerpoint presentation gallery elements. This is a nine stage process. The stages in this process are business, marketing, success, management, bar graph.

Column Chart Financial Ppt PowerPoint Presentation Outline Design Templates
This is a column chart financial ppt powerpoint presentation outline design templates. This is a two stage process. The stages in this process are financial, business, marketing, planning, strategy.

Clustered Column Line Chart Ppt PowerPoint Presentation File Pictures
This is a clustered column line chart ppt powerpoint presentation file pictures. This is a four stage process. The stages in this process are clustered bar, product, planning, business, sales in percentage.

Area Chart Financial Ppt PowerPoint Presentation Outline Professional
This is a area chart financial ppt powerpoint presentation outline professional. This is a four stage process. The stages in this process are product, sales in percentage, financial year.
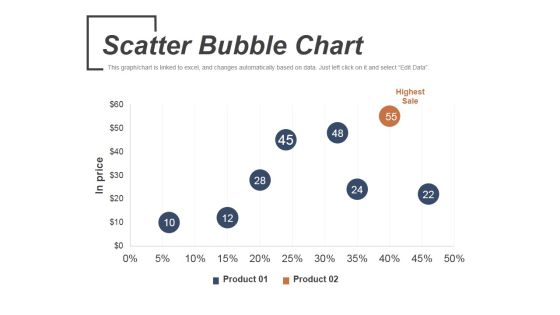
Scatter Bubble Chart Ppt PowerPoint Presentation Infographic Template Graphics
This is a scatter bubble chart ppt powerpoint presentation infographic template graphics. This is a two stage process. The stages in this process are highest sale, product, in price.

Competitive Analysis Template 6 Scatter Chart Ppt PowerPoint Presentation Slides
This is a competitive analysis template 6 scatter chart ppt powerpoint presentation slides. This is a eight stage process. The stages in this process are users interface, data import, example, pricing, support, update, tutorials, easy to use, table.

Competitive Analysis Template 7 Bubble Chart Ppt PowerPoint Presentation Deck
This is a competitive analysis template 7 bubble chart ppt powerpoint presentation deck. This is a six stage process. The stages in this process are users interface, data import, example, pricing, support, update, tutorials, easy to use, table.
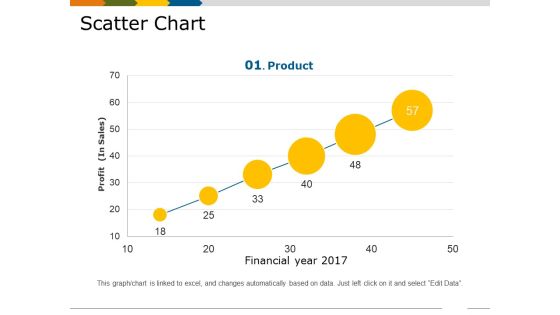
Scatter Chart Template 1 Ppt PowerPoint Presentation Show Slides
This is a scatter chart template 1 ppt powerpoint presentation show slides. This is a six stage process. The stages in this process are financial year, profit in sales, growth, business, marketing, product.

Scatter Chart Template 2 Ppt PowerPoint Presentation Styles Visual Aids
This is a scatter chart template 2 ppt powerpoint presentation styles visual aids. This is a two stage process. The stages in this process are product, business, marketing, in percentage, growth.

Volume Open High Low Close Chart Ppt PowerPoint Presentation Sample
This is a volume open high low close chart ppt powerpoint presentation sample. This is a five stage process. The stages in this process are close, volume, high, low, open.
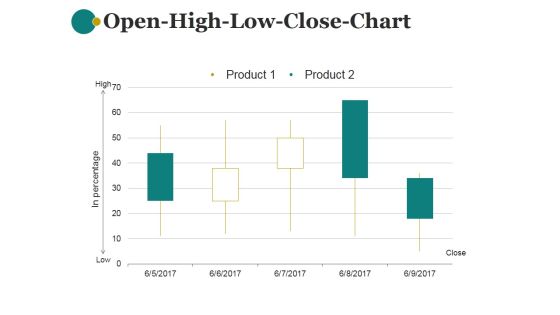
Open High Low Close Chart Ppt PowerPoint Presentation Information
This is a open high low close chart ppt powerpoint presentation information. This is a five stage process. The stages in this process are product, in percentage, close, low, high.
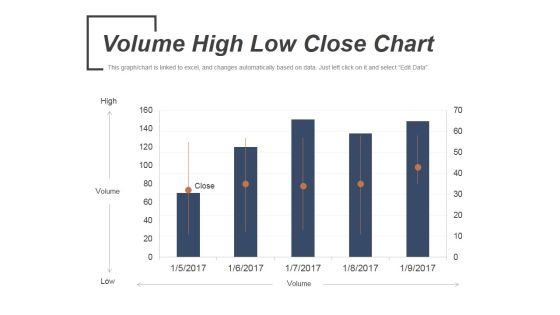
Volume High Low Close Chart Ppt PowerPoint Presentation Slides Portrait
This is a volume high low close chart ppt powerpoint presentation slides portrait. This is a five stage process. The stages in this process are volume, low, high, open, close.

High Low Close Chart Ppt PowerPoint Presentation Inspiration Professional
This is a high low close chart ppt powerpoint presentation inspiration professional. This is a ten stage process. The stages in this process are business, strategy, analysis, planning, high, volume, low.
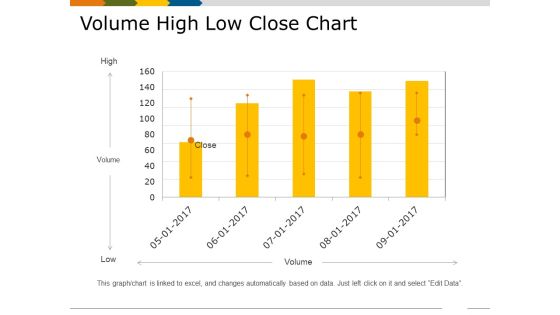
Volume High Low Close Chart Ppt PowerPoint Presentation Gallery Ideas
This is a volume high low close chart ppt powerpoint presentation gallery ideas. This is a five stage process. The stages in this process are high, volume, low, graph, business.

Pie Chart With Multiple Percentage Values Ppt PowerPoint Presentation Show
This is a pie chart with multiple percentage values ppt powerpoint presentation show. This is a six stage process. The stages in this process are pie, finance, people, silhouettes, communication.

Line Bubble Chart Ppt PowerPoint Presentation Portfolio Slide Portrait
This is a line bubble chart ppt powerpoint presentation portfolio slide portrait. This is a six stage process. The stages in this process are highest profit, financial year, profit in sales, growth, business.

Combo Chart Ppt PowerPoint Presentation Infographic Template Graphic Images
This is a combo chart ppt powerpoint presentation infographic template graphic images. This is a three stage process. The stages in this process are market size, growth rate, percentage, business, marketing.

Scatter Chart Template 3 Ppt PowerPoint Presentation Styles Demonstration
This is a scatter chart template 3 ppt powerpoint presentation styles demonstration. This is a one stage process. The stages in this process are sales in percentage, finance, business, marketing, growth.

Column Chart Ppt PowerPoint Presentation Layouts Design Inspiration
This is a column chart ppt powerpoint presentation layouts design inspiration. This is a two stage process. The stages in this process are sales in percentage, financial year in, graph, business, finance, marketing.
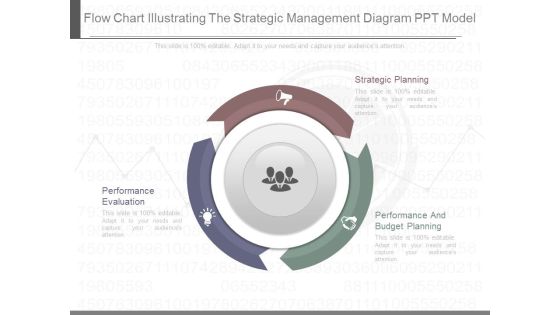
Flow Chart Illustrating The Strategic Management Diagram Ppt Model
This is a flow chart illustrating the strategic management diagram ppt model. This is a three stage process. The stages in this process are strategic planning, performance and budget planning, performance evaluation.

Conversion Rate Optimization Flow Chart Sample Diagram Powerpoint Slides Images
This is a conversion rate optimization flow chart sample diagram powerpoint slides images. This is a five stage process. The stages in this process are gather insights, measure, unique, pitch, status, future.

Conversion Rate Optimization Flow Chart Sample Diagram Example Ppt
This is a conversion rate optimization flow chart sample diagram example ppt. This is a four stage process. The stages in this process are measure, gather insights, test, form hypothesis.

Flow Chart Of Rapid Prototyping Diagram Ppt Samples
This is a flow chart of rapid prototyping diagram ppt samples. This is a three stage process. The stages in this process are build prototype, prototype, refine and iterate.

Cash Payment Management Flow Chart Ppt PowerPoint Presentation Styles Professional
This is a cash payment management flow chart ppt powerpoint presentation styles professional. This is a seven stage process. The stages in this process are liquidity, cash assets, solvency.
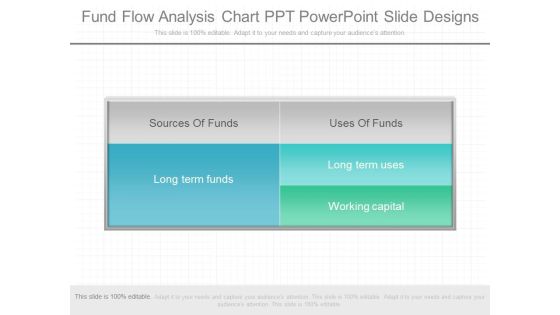
Fund Flow Analysis Chart Ppt Powerpoint Slide Designs
This is a fund flow analysis chart ppt powerpoint slide designs. This is a five stage process. The stages in this process are sources of funds, long term funds, uses of funds, long term uses, working capital.
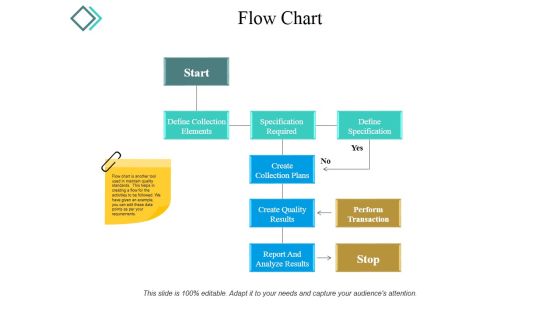
Flow Chart Ppt PowerPoint Presentation Styles Example Topics
This is a flow chart ppt powerpoint presentation styles example topics. This is a nine stage process. The stages in this process are start, create collection plans, define specification, specification required.

Flow Chart Ppt PowerPoint Presentation File Infographic Template
This is a flow chart ppt powerpoint presentation file infographic template. This is a seven stage process. The stages in this process are start, define specifications, perform transaction, create collection plans, report and analyze results.

Area Chart Talent Mapping Ppt PowerPoint Presentation Ideas Vector
This is a area chart talent mapping ppt powerpoint presentation ideas vector. This is a three stage process. The stages in this process are business, management, strategy, analysis, marketing.

Combo Chart Talent Mapping Ppt PowerPoint Presentation Inspiration Display
This is a combo chart talent mapping ppt powerpoint presentation inspiration display. This is a three stage process. The stages in this process are business, management, strategy, analysis, marketing.

Organization Chart Ppt PowerPoint Presentation Model Graphic Images
This is a organization chart ppt powerpoint presentation model graphic images. This is a six stage process. The stages in this process are editor, sales marketing, assistant manager, manager, web designer.
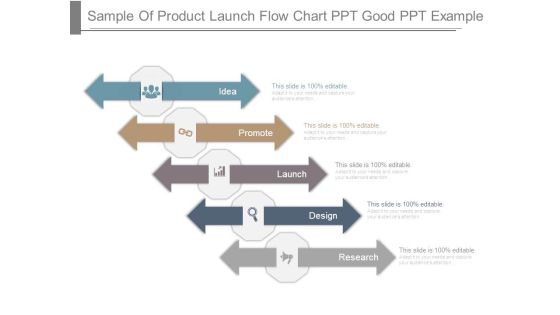
Sample Of Product Launch Flow Chart Ppt Good Ppt Example
This is a sample of product launch flow chart ppt good ppt example. This is a five stage process. The stages in this process are idea, promote, launch, design, research.

Approve Leads Flow Chart Powerpoint Slide Presentation Tips
This is a approve leads flow chart powerpoint slide presentation tips. This is a seven stage process. The stages in this process are awareness, interest, decision, action, permission, engagement, call to action.
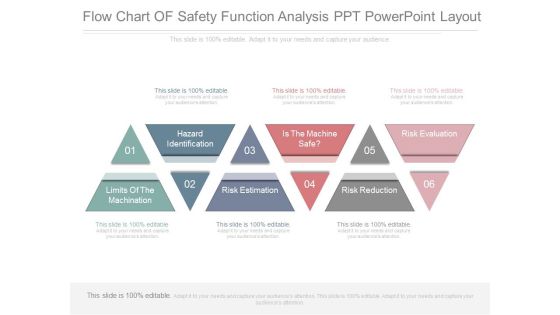
Flow Chart Of Safety Function Analysis Ppt Powerpoint Layout
This is a flow chart of safety function analysis ppt powerpoint layout. This is a six stage process. The stages in this process are hazard identification, limits of the machination, risk estimation, is the machine safe, risk reduction, risk evaluation.

Succession Planning Modelling Chart Ppt PowerPoint Presentation Professional Gridlines
This is a succession planning modelling chart ppt powerpoint presentation professional gridlines. This is a three stage process. The stages in this process are compare, marketing, business, management, planning.

Activity Planning Chart Ppt PowerPoint Presentation Visual Aids Model
This is a activity planning chart ppt powerpoint presentation visual aids model. This is a six stage process. The stages in this process are activities, business, management, table, planning.

Staked Line Chart Ppt PowerPoint Presentation Model Graphics Download
This is a staked line chart ppt powerpoint presentation model graphics download. This is a two stage process. The stages in this process are business, marketing, growth, finance, management.

3D Pie Chart Business Plan Ppt PowerPoint Presentation Model Guidelines
This is a 3d pie chart business plan ppt powerpoint presentation model guidelines. This is a four stage process. The stages in this process are art, colouring, paint brush.
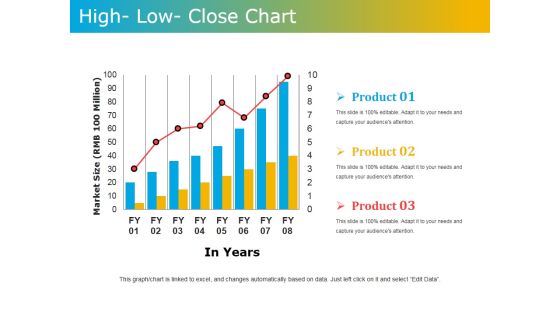
High Low Close Chart Ppt PowerPoint Presentation Model Graphics Tutorials
This is a high low close chart ppt powerpoint presentation model graphics tutorials. This is a three stage process. The stages in this process are market size, in years, product.

Bubble Chart Marketing Business Ppt PowerPoint Presentation Model Sample
This is a bubble chart marketing business ppt powerpoint presentation model sample. This is a two stage process. The stages in this process are finance, business, management, strategy, analysis.

Column Chart Ppt PowerPoint Presentation Model Graphics Download
This is a column chart ppt powerpoint presentation model graphics download. This is a two stage process. The stages in this process are product, financial year, sales in percentage, bar graph, success.

 Home
Home