Process Chart

Volume High Low Close Chart Ppt PowerPoint Presentation Pictures Objects
This is a volume high low close chart ppt powerpoint presentation pictures objects. This is a one stage process. The stages in this process are finance, marketing, management, investment, analysis.
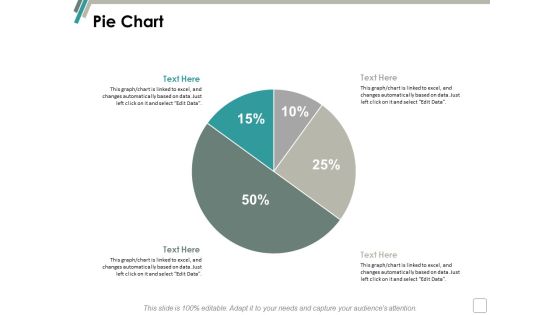
Pie Chart Finance Marketing Ppt Powerpoint Presentation Infographics Background
This is a pie chart finance marketing ppt powerpoint presentation infographics background. This is a two stage process. The stages in this process are finance, marketing, management, investment, analysis.

Volume High Low Close Chart Ppt Powerpoint Presentation Slides Images
This is a volume high low close chart ppt powerpoint presentation slides images. This is a five stage process. The stages in this process are finance, marketing, management, investment, analysis.

Area Chart Finance Marketing Ppt Powerpoint Presentation Gallery Slides
This is a area chart finance marketing ppt powerpoint presentation gallery slides. This is a three stage process. The stages in this process are finance, marketing, management, investment, analysis.
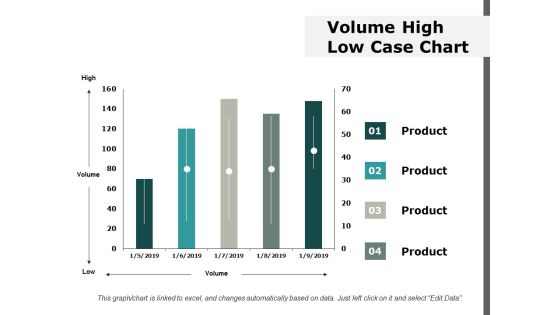
Volume High Low Case Chart Ppt Powerpoint Presentation Ideas Information
This is a volume high low case chart ppt powerpoint presentation ideas information. This is a four stage process. The stages in this process are finance, marketing, management, investment, analysis.

Scatter Chart Analysis Marketing Ppt Powerpoint Presentation Summary Infographic Template
This is a scatter chart analysis marketing ppt powerpoint presentation summary infographic template. This is a two stage process. The stages in this process are finance, marketing, management, investment, analysis.

Stacked Column Chart Analysis Ppt PowerPoint Presentation Slides Graphics Design
This is a stacked column chart analysis ppt powerpoint presentation slides graphics design. This is a three stage process. The stages in this process are finance, marketing, management, investment, analysis.

Bar Chart Finance Marketing Ppt Powerpoint Presentation Gallery Grid
This is a bar chart finance marketing ppt powerpoint presentation gallery grid. This is a three stage process. The stages in this process are finance, marketing, management, investment, analysis.

area chart finance ppt powerpoint presentation portfolio graphics download
This is a area chart finance ppt powerpoint presentation portfolio graphics download. This is a two stage process. The stages in this process are finance, marketing, management, investment, analysis.

Pie Chart Finance Ppt Powerpoint Presentation Layouts Design Ideas
This is a pie chart finance ppt powerpoint presentation layouts design ideas. This is a four stage process. The stages in this process are finance, marketing, management, investment, analysis.

Area Chart Finance Marketing Ppt Powerpoint Presentation Show Grid
This is a area chart finance marketing ppt powerpoint presentation show grid. This is a three stage process. The stages in this process are finance, marketing, management, investment, analysis.

Pie Chart Finance Ppt PowerPoint Presentation Infographics Mockup
This is a pie chart finance ppt powerpoint presentation infographics mockup . This is a four stage process. The stages in this process are finance, marketing, management, investment, analysis.

Combo Chart Marketing Ppt Powerpoint Presentation Ideas Format Ideas Cpb
This is a combo chart marketing ppt powerpoint presentation ideas format ideas cpb. This is a three stage process. The stages in this process are finance, marketing, management, investment, analysis.
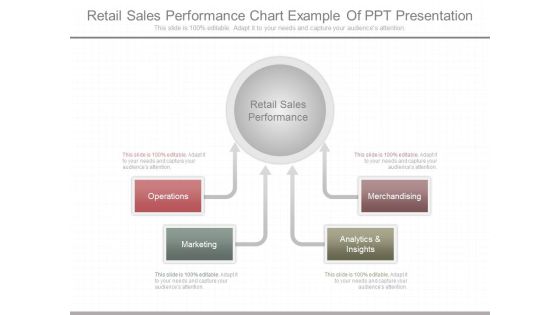
Retail Sales Performance Chart Example Of Ppt Presentation
This is a retail sales performance chart example of ppt presentation. This is a four stage process. The stages in this process are operations, marketing, analytics and insights, merchandising, retail sales performance.

Corporate Structure And Organization Chart Development Ppt Powerpoint Guide
This is a corporate structure and organization chart development ppt powerpoint guide. This is a six stage process. The stages in this process are relationship, structure, purpose, mechanisms, rewards, leadership.

Tools To Measure Event Marketing Chart Powerpoint Slides Deck Template
This is a tools to measure event marketing chart powerpoint slides deck template. This is a six stage process. The stages in this process are cross functional, business intelligence, sales and promotion, going viral, driving roi, growing fans.

Business Intelligence Ecosystem Chart Example Of Ppt Presentation
This is a business intelligence ecosystem chart example of ppt presentation. This is a eight stage process. The stages in this process are strategy, data mining, customers, market, business outcome, leadership skills, suppliers, competition.

Marketing Org Chart Example Powerpoint Slide Design Ideas
This is a marketing org chart example powerpoint slide design ideas. This is a four stage process. The stages in this process are strategic marketing, product marketing, interactive marketing, marketing organization.
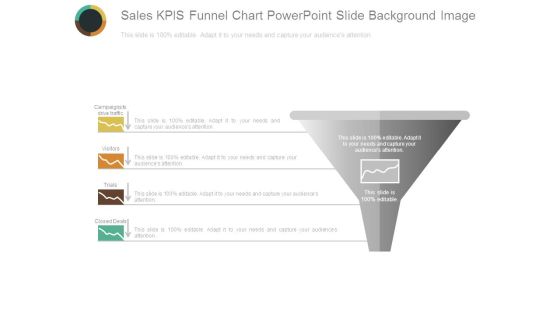
Sales Kpis Funnel Chart Powerpoint Slide Background Image
This is a sales kpis funnel chart powerpoint slide background image. This is a one stage process. The stages in this process are campaigns to drive traffic, visitors, trials, closed deals, sales.

Break Point Chart For Quality Analysis Powerpoint Slide Show
This is a break point chart for quality analysis powerpoint slide show. This is a one stage process. The stages in this process are total variable costs, fixed costs, quality sold.

Our Product Vs Competition Analysis Chart Powerpoint Slide Background Designs
This is a our product vs competition analysis chart powerpoint slide background designs. This is a four stage process. The stages in this process are business, marketing, success, strategy, compare.

And R Chart For Six Sigma Powerpoint Slide Background Designs
This is a and r chart for six sigma powerpoint slide background designs. This is a two stage process. The stages in this process are subtitle, option, lcl, ucl.

Possible Solutions Puzzle Circular Chart Powerpoint Slide Background Image
This is a possible solutions puzzle circular chart powerpoint slide background image. This is a four stage process. The stages in this process are puzzles, business, problem, solution, game pieces, marketing.
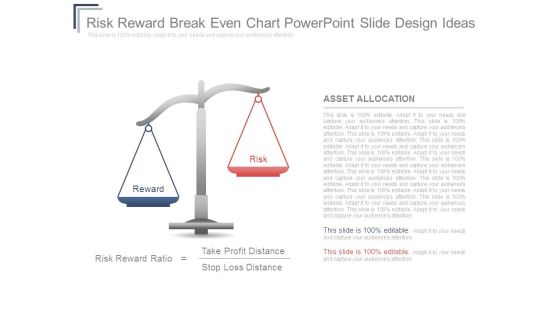
Risk Reward Breakeven Chart Powerpoint Slide Design Ideas
This is a risk reward breakeven chart powerpoint slide design ideas. This is a two stage process. The stages in this process are reward, risk, asset allocation, risk reward ratio, take profit distance, stop loss distance.
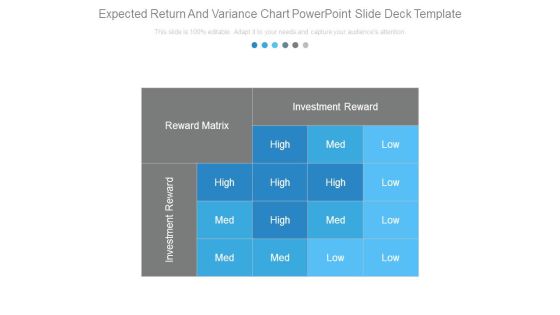
Expected Return And Variance Chart Powerpoint Slide Deck Template
This is a expected return and variance chart powerpoint slide deck template. This is a one stage process. The stages in this process are investment reward, reward matrix, high, med, low.
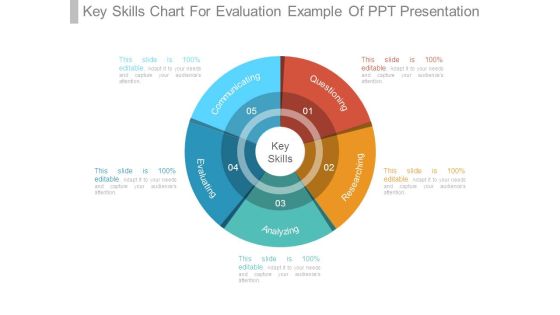
Key Skills Chart For Evaluation Example Of Ppt Presentation
This is a key skills chart for evaluation example of ppt presentation. This is a five stage process. The stages in this process are communicating, questioning, researching, analyzing, evaluating, key skills.
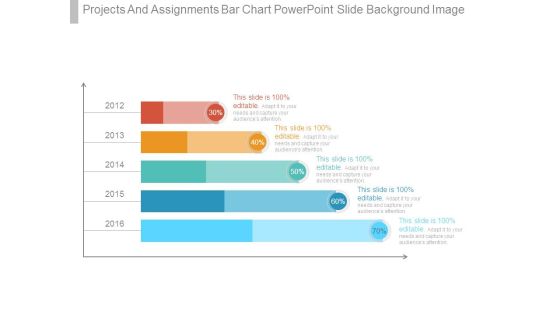
Projects And Assignments Bar Chart Powerpoint Slide Background Image
This is a projects and assignments bar chart powerpoint slide background image. This is a five stage process. The stages in this process are finance, presentation, business, strategy, marketing.

Customer Loyalty Circle Chart Powerpoint Slide Templates Download
This is a customer loyalty circle chart powerpoint slide templates download. This is a six stage process. The stages in this process are grow, engage, attract, reward, retain, loyalty.
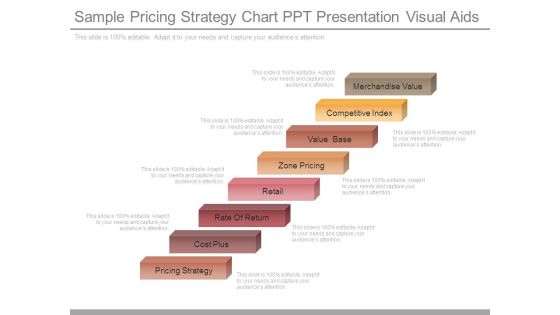
Sample Pricing Strategy Chart Ppt Presentation Visual Aids
This is a sample pricing strategy chart ppt presentation visual aids. This is a eight stage process. The stages in this process are merchandise value, competitive index, value base, zone pricing, retail, rate of return, cost plus, pricing strategy.

Corporate Strategy Hierarchy Chart Powerpoint Slide Presentation Tips
This is a corporate strategy hierarchy chart powerpoint slide presentation tips. This is a four stage process. The stages in this process are corporate strategy, business strategy, functional area strategies, operating strategies.
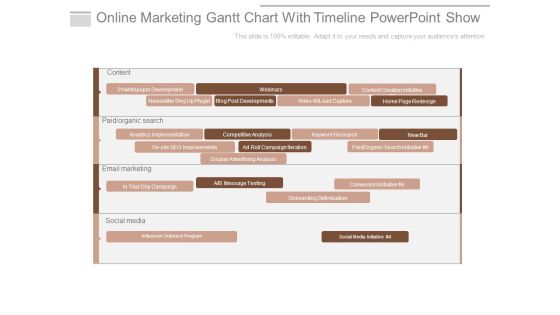
Online Marketing Gantt Chart With Timeline Powerpoint Show
This is a online marketing gantt chart with timeline powerpoint show. This is a four stage process. The stages in this process are content, whitepaper development, webinars, email marketing, social media, content creation initiative, conversion initiative.

Four Steps Chart For Formation Of Strategy Powerpoint Templates
This is a four steps chart for formation of strategy powerpoint templates. This is a four stage process. The stages in this process are corporate strategy, business strategy, functional area strategies, operating strategies.
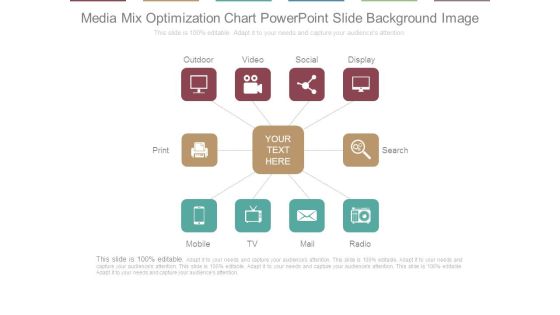
Media Mix Optimization Chart Powerpoint Slide Background Image
This is a media mix optimization chart powerpoint slide background image. This is a ten stage process. The stages in this process are outdoor, video, social, display, search, radio, mail, tv, mobile, print.

Pie Chart For Current Sources Of Profit Ppt Background Template
This is a pie chart for current sources of profit ppt background template. This is a five stage process. The stages in this process are finance, success, business, marketing, percentage, donut.
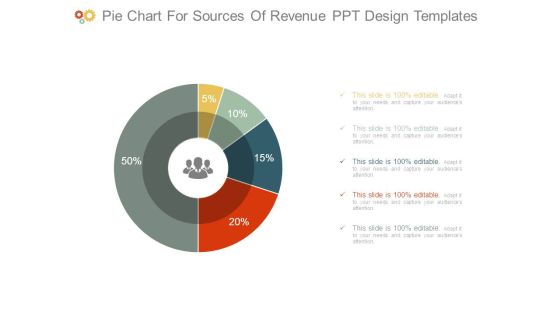
Pie Chart For Sources Of Revenue Ppt Design Templates
This is a pie chart for sources of revenue ppt design templates. This is a five stage process. The stages in this process are finance, success, business, marketing, percentage, donut.

Changes In Competitive Environment Bar Chart Sample Of Ppt Presentation
This is a changes in competitive environment bar chart sample of ppt presentation. This is a four stage process. The stages in this process are engagement, brand, monthly, weekly.

Profit After Tax Pat Growth Chart Powerpoint Slide Designs Download
This is a profit after tax pat growth chart powerpoint slide designs download. This is a five stage process. The stages in this process are growth, success, business, strategy, marketing.

Comparison Chart For Male And Female Employment Powerpoint Shapes
This is a comparison chart for male and female employment powerpoint shapes. This is a two stage process. The stages in this process are female 72 percent, male 54 percent.

Xbar And R Chart Ppt PowerPoint Presentation Example 2015
This is a xbar and r chart ppt powerpoint presentation example 2015. This is a two stage process. The stages in this process are business, strategy, marketing, success, growth strategy.

Competitive Analysis Matrix Chart Template 1 Ppt PowerPoint Presentation Deck
This is a competitive analysis matrix chart template 1 ppt powerpoint presentation deck. This is a six stage process. The stages in this process are product quality, product fidelity, after sales service, customer service, shipping speed.

Competitive Analysis Scatter Chart Template 2 Ppt PowerPoint Presentation Files
This is a competitive analysis scatter chart template 2 ppt powerpoint presentation files. This is a nine stage process. The stages in this process are users interface, data import, example, pricing, support, update.
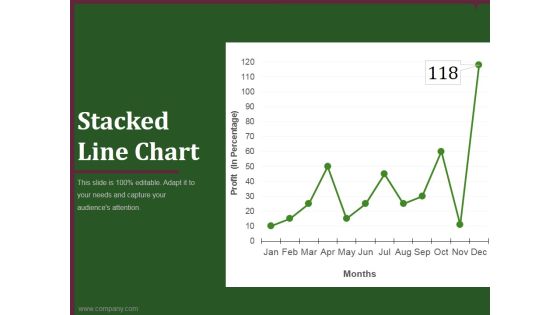
Stacked Line Chart Ppt PowerPoint Presentation Background Image
This is a stacked line chart ppt powerpoint presentation background image. This is a twelve stage process. The stages in this process are business, marketing, analysis, finance, growth strategy.

Volume High Low Close Chart Ppt PowerPoint Presentation Shapes
This is a volume high low close chart ppt powerpoint presentation shapes. This is a five stage process. The stages in this process are business, strategy, analysis, marketing, finance, growth.

Donut Pie Chart Ppt PowerPoint Presentation Infographic Template Layout Ideas
This is a donut pie chart ppt powerpoint presentation infographic template layout ideas. This is a five stage process. The stages in this process are product, business, finance, marketing.

High Low Close Chart Ppt PowerPoint Presentation Layouts Visual Aids
This is a high low close chart ppt powerpoint presentation layouts visual aids. This is a ten stage process. The stages in this process are volume, high, low, close.

High Low Close Chart Ppt PowerPoint Presentation Professional Background Images
This is a high low close chart ppt powerpoint presentation professional background images. This is a five stage process. The stages in this process are close, high, volume, low, open.

Volume High Low Close Chart Ppt PowerPoint Presentation Show Outfit
This is a volume high low close chart ppt powerpoint presentation show outfit. This is a five stage process. The stages in this process are business, strategy, marketing, success, finance, growth.

Area Chart Ppt PowerPoint Presentation Show Layout Ideas
This is a area chart ppt powerpoint presentation show layout ideas. This is a two stage process. The stages in this process are product, in percentage, financial year, growth.

Combo Chart Ppt PowerPoint Presentation Infographic Template Brochure
This is a combo chart ppt powerpoint presentation infographic template brochure. This is a eight stage process. The stages in this process are product, market size, strategy, business, marketing.

Scatter Bubble Chart Ppt PowerPoint Presentation Infographics Backgrounds
This is a scatter bubble chart ppt powerpoint presentation infographics backgrounds. This is a five stage process. The stages in this process are highest sale, in price, growth, success, business.

Line Bubble Chart Ppt PowerPoint Presentation Professional Infographic Template
This is a line bubble chart ppt powerpoint presentation professional infographic template. This is a five stage process. The stages in this process are product, in price, highest sale, business, finance.

High Low Close Chart Ppt PowerPoint Presentation Styles Display
This is a high low close chart ppt powerpoint presentation styles display. This is a ten stage process. The stages in this process are high, volume, low, close, finance.
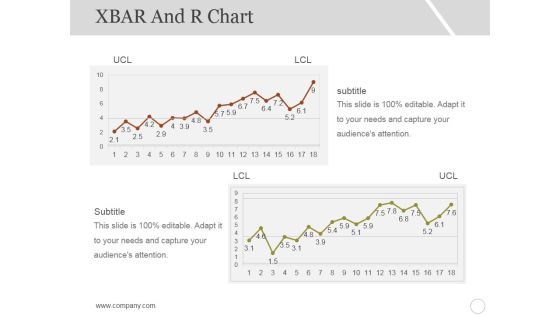
Xbar And R Chart Ppt PowerPoint Presentation Inspiration Styles
This is a xbar and r chart ppt powerpoint presentation inspiration styles. This is a two stage process. The stages in this process are subtitle, lcl, ucl, growth, graph.

Column Chart Ppt PowerPoint Presentation Styles Graphic Tips
This is a column chart ppt powerpoint presentation styles graphic tips. This is a six stage process. The stages in this process are slide bar, business, marketing, strategy, finance.

Donut Pie Chart Ppt PowerPoint Presentation Infographics Background Designs
This is a donut pie chart ppt powerpoint presentation infographics background designs. This is a three stage process. The stages in this process are finance, business, marketing, strategy, percentage.
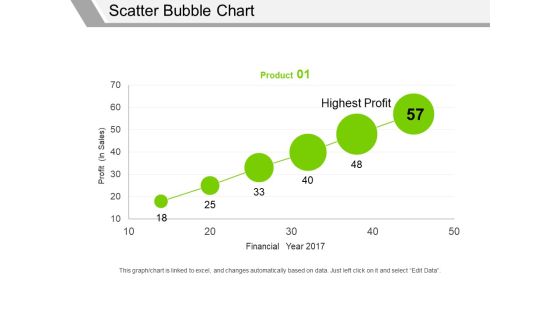
Scatter Bubble Chart Ppt PowerPoint Presentation Professional Graphics Pictures
This is a scatter bubble chart ppt powerpoint presentation professional graphics pictures. This is a one stage process. The stages in this process are profit in sales, financial year, highest profit, product.

High Low Close Chart Ppt PowerPoint Presentation Infographic Template Vector
This is a high low close chart ppt powerpoint presentation infographic template vector. This is a ten stage process. The stages in this process are high, volume, low, product, close.

Scatter Bubble Chart Ppt PowerPoint Presentation Summary Files
This is a scatter bubble chart ppt powerpoint presentation summary files. This is a six stage process. The stages in this process are product, financial year, profit, highest profit.

Volume High Low Close Chart Ppt PowerPoint Presentation Gallery Shapes
This is a volume high low close chart ppt powerpoint presentation gallery shapes. This is a five stage process. The stages in this process are high, volume, low, close, finance.

Area Chart Ppt PowerPoint Presentation Infographic Template Samples
This is a area chart ppt powerpoint presentation infographic template samples. This is a two stage process. The stages in this process are in percentage product, business, marketing, growth.
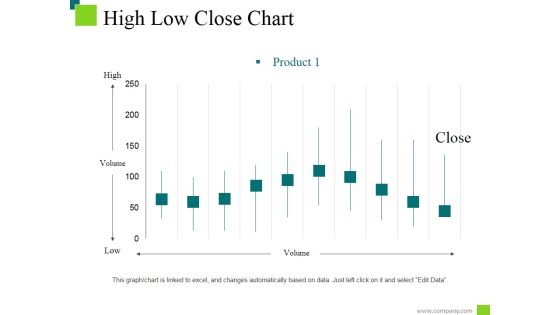
High Low Close Chart Ppt PowerPoint Presentation Styles Information
This is a high low close chart ppt powerpoint presentation styles information. This is a ten stage process. The stages in this process are low, high, product, volume, close.
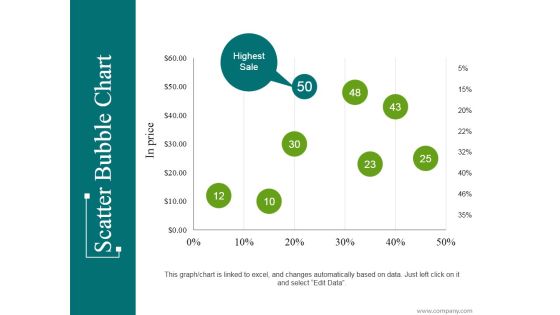
Scatter Bubble Chart Ppt PowerPoint Presentation Infographic Template Introduction
This is a scatter bubble chart ppt powerpoint presentation infographic template introduction. This is a eight stage process. The stages in this process are highest sale, business, marketing, percentage, finance.

High Low Close Chart Ppt PowerPoint Presentation Show Ideas
This is a high low close chart ppt powerpoint presentation show ideas. This is a ten stage process. The stages in this process are high, volume, low, close, finance.
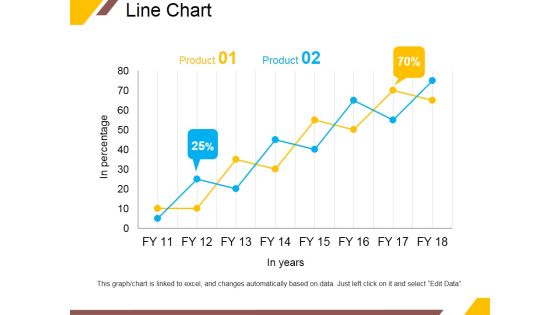
Line Chart Ppt PowerPoint Presentation Portfolio Infographic Template
This is a line chart ppt powerpoint presentation portfolio infographic template. This is a two stage process. The stages in this process are product, in years, business, percentage, growth.

Area Chart Ppt PowerPoint Presentation File Graphic Tips
This is a area chart ppt powerpoint presentation file graphic tips. This is a two stage process. The stages in this process are product, in percentage, financial year, business, growth.
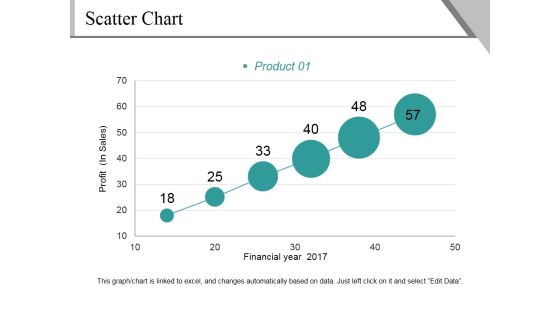
Scatter Chart Ppt PowerPoint Presentation File Background Image
This is a scatter chart ppt powerpoint presentation file background image. This is a six stage process. The stages in this process are profit, financial year, product, growth, success.
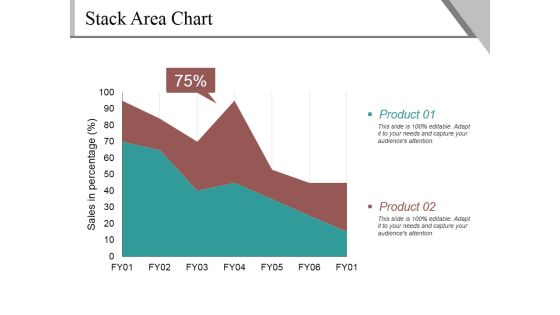
Stack Area Chart Ppt PowerPoint Presentation Gallery Guidelines
This is a stack area chart ppt powerpoint presentation gallery guidelines. This is a two stage process. The stages in this process are sales in percentage, product, percentage, business.

Stack Area Chart Ppt PowerPoint Presentation Example File
This is a stack area chart ppt powerpoint presentation example file. This is a two stage process. The stages in this process are product, sales in percentage, percentage, finance.
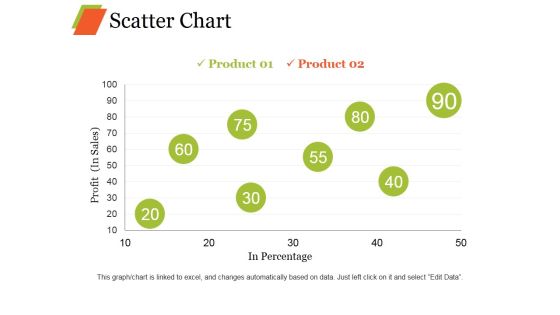
Scatter Chart Ppt PowerPoint Presentation Professional Graphic Images
This is a scatter chart ppt powerpoint presentation professional graphic images. This is a eight stage process. The stages in this process are product, profit, in percentage growth, business.
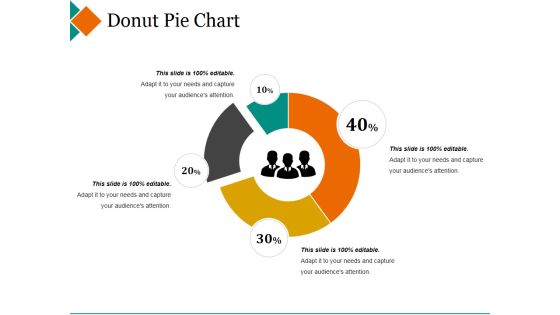
Donut Pie Chart Ppt PowerPoint Presentation Pictures Design Inspiration
This is a donut pie chart ppt powerpoint presentation pictures design inspiration. This is a four stage process. The stages in this process are maximum, donut, minimum, percentage, finance.

Column Chart Ppt PowerPoint Presentation Gallery Graphics Example
This is a column chart ppt powerpoint presentation gallery graphics example. This is a two stage process. The stages in this process are expenditure in, years, business, marketing, growth.
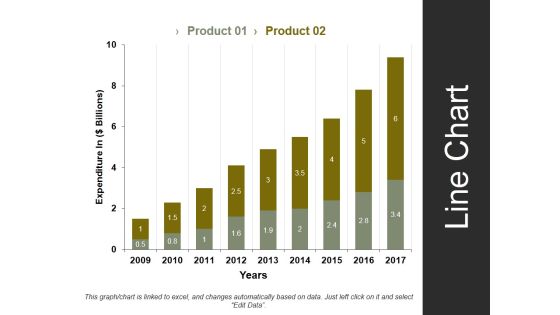
Line Chart Template 1 Ppt PowerPoint Presentation Styles Summary
This is a line chart template 1 ppt powerpoint presentation styles summary. This is a two stage process. The stages in this process are expenditure in, years, business, marketing, strategy.

Stock Chart Template 2 Ppt PowerPoint Presentation Infographic Template Styles
This is a stock chart template 2 ppt powerpoint presentation infographic template styles. This is a one stage process. The stages in this process are high, volume, low, product, volume.
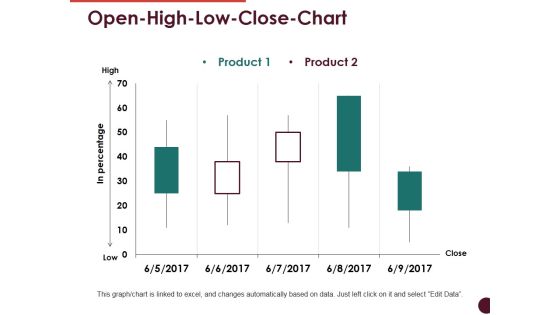
Open High Low Close Chart Ppt PowerPoint Presentation Professional Visuals
This is a open high low close chart ppt powerpoint presentation professional visuals. This is a two stage process. The stages in this process are high, low, in percentage, product, close.

Volume High Low Close Chart Ppt PowerPoint Presentation Infographics Good
This is a volume high low close chart ppt powerpoint presentation infographics good. This is a two stage process. The stages in this process are high, volume, low, product, close.
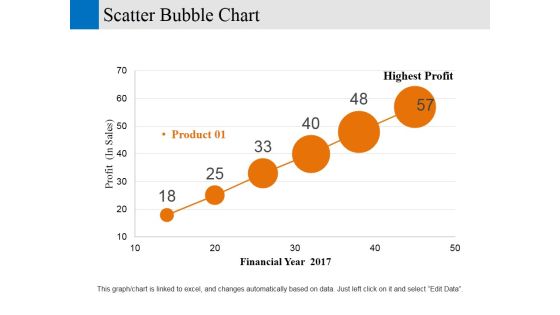
Scatter Bubble Chart Ppt PowerPoint Presentation Gallery Designs Download
This is a scatter bubble chart ppt powerpoint presentation gallery designs download. This is a six stage process. The stages in this process are financial year, profit, business, marketing, strategy.

Scatter Chart Ppt PowerPoint Presentation Ideas Designs Download
This is a scatter chart ppt powerpoint presentation ideas designs download. This is a one stage process. The stages in this process are product, dollar, in percentage, growth, success.

Brand Positioning Chart Ppt PowerPoint Presentation Show Example File
This is a brand positioning chart ppt powerpoint presentation show example file. This is a five stage process. The stages in this process are own product, business, marketing, strategy, analysis.
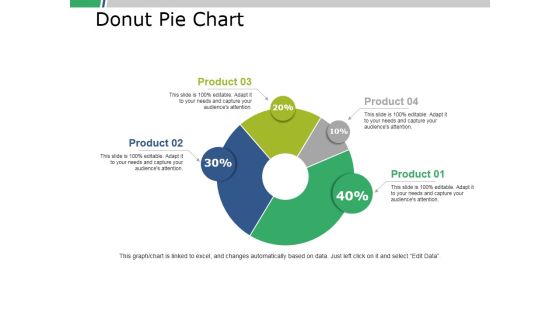
Donut Pie Chart Ppt PowerPoint Presentation Portfolio Slide Download
This is a donut pie chart ppt powerpoint presentation portfolio slide download. This is a four stage process. The stages in this process are business, marketing, finance, percent, donut.

Scatter Bubble Chart Ppt PowerPoint Presentation Styles Objects
This is a scatter bubble chart ppt powerpoint presentation styles objects. This is a two stage process. The stages in this process are product, in price, highest sale, percentage, finance.

Bar Chart Ppt PowerPoint Presentation Infographic Template Master Slide
This is a bar chart ppt powerpoint presentation infographic template master slide. This is a two stage process. The stages in this process are growth, finance, business, analysis, marketing.

Column Chart Ppt PowerPoint Presentation Infographic Template Example File
This is a column chart ppt powerpoint presentation infographic template example file. This is a two stage process. The stages in this process are growth, finance, business, marketing, analysis.
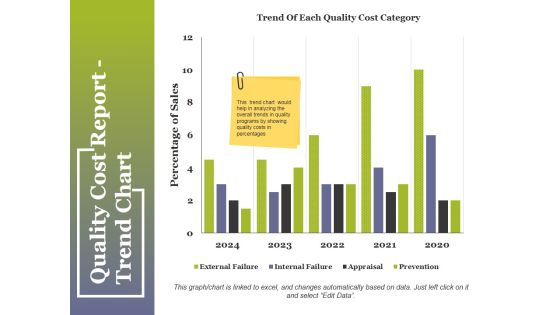
Quality Cost Report Trend Chart Ppt PowerPoint Presentation Summary Pictures
This is a quality cost report trend chart ppt powerpoint presentation summary pictures. This is a two stage process. The stages in this process are compare, business, table, marketing, strategy.
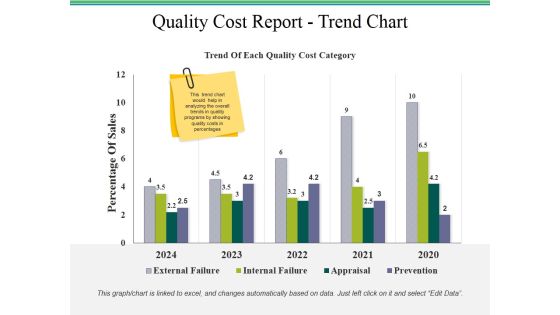
Quality Cost Report Trend Chart Ppt PowerPoint Presentation Styles Templates
This is a quality cost report trend chart ppt powerpoint presentation styles templates. This is a two stage process. The stages in this process are quality cost report, business, finance, marketing, strategy.

quality cost report trend chart ppt powerpoint presentation pictures vector
This is a quality cost report trend chart ppt powerpoint presentation pictures vector. This is a four stage process. The stages in this process are business, finance, marketing, strategy, analysis.
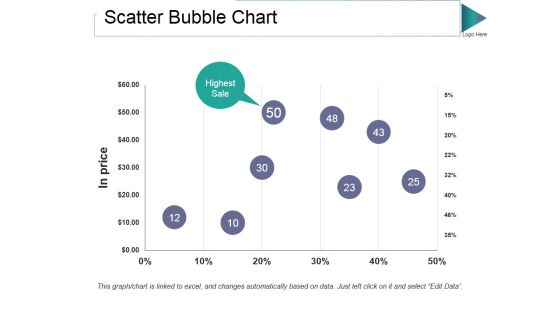
Scatter Bubble Chart Ppt PowerPoint Presentation Gallery Guidelines
This is a scatter bubble chart ppt powerpoint presentation gallery guidelines. This is a one stage process. The stages in this process are in price, highest sale, percentage, finance, business.
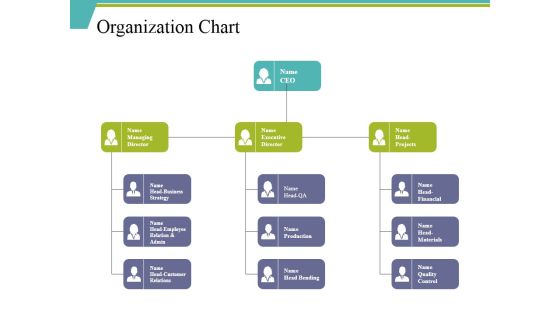
Organization Chart Ppt PowerPoint Presentation File Background Designs
This is a organization chart ppt powerpoint presentation file background designs. This is a three stage process. The stages in this process are ceo, executive director, head financial, production, head bending.
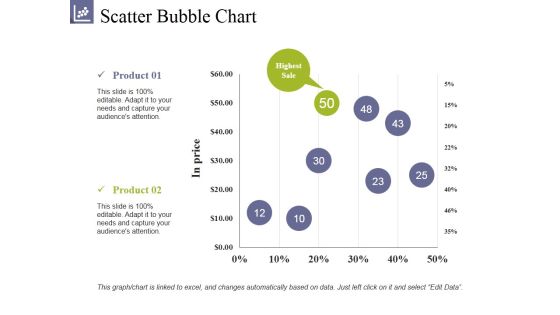
Scatter Bubble Chart Ppt PowerPoint Presentation Summary Clipart
This is a scatter bubble chart ppt powerpoint presentation summary clipart. This is a two stage process. The stages in this process are product, highest sale, in prices, growth, success.

Donut Pie Chart Ppt PowerPoint Presentation Professional Graphic Images
This is a donut pie chart ppt powerpoint presentation professional graphic images. This is a three stage process. The stages in this process are percentage, finance, donut, business, marketing.

Bubble Chart Ppt PowerPoint Presentation Layouts Clipart Images
This is a bubble chart ppt powerpoint presentation layouts clipart images. This is a two stage process. The stages in this process are business, marketing, profit, innovation, technology, idea bulb.

Bar Chart Ppt PowerPoint Presentation Slides Example File
This is a bar chart ppt powerpoint presentation slides example file. This is a two stage process. The stages in this process are product, financial years, sales in percentage.
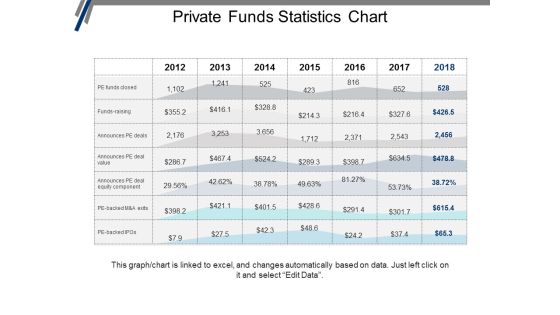
Private Funds Statistics Chart Ppt PowerPoint Presentation Portfolio Graphics Design
This is a private funds statistics chart ppt powerpoint presentation portfolio graphics design. This is a seven stage process. The stages in this process are investment, funding, private equity, venture capital.

Open High Low Close Chart Ppt PowerPoint Presentation Professional Inspiration
This is a open high low close chart ppt powerpoint presentation professional inspiration. This is a five stage process. The stages in this process are high, low, close, business, finance.

Corporate Structure Business ORG Chart Ppt PowerPoint Presentation Slides Template
This is a corporate structure business org chart ppt powerpoint presentation slides template. This is a five stage process. The stages in this process are project governance, governance structure, project structure.

Cost Benefit Analysis Chart Ppt PowerPoint Presentation Slides Example File
This is a cost benefit analysis chart ppt powerpoint presentation slides example file. This is a two stage process. The stages in this process are increase salary, cost benefit, reduced costs, analysis, operating cost.

Donut Pie Chart Ppt PowerPoint Presentation Show Graphics Download
This is a donut pie chart ppt powerpoint presentation show graphics download. This is a three stage process. The stages in this process are percentage, finance, donut, business, marketing.
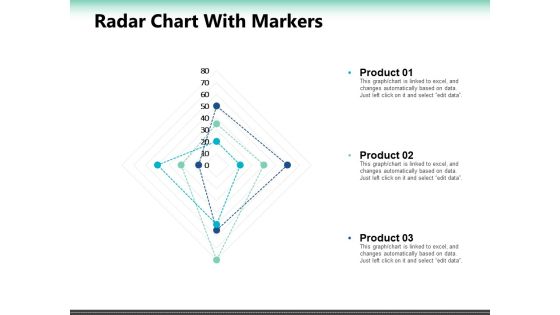
Radar Chart With Markers Ppt PowerPoint Presentation Summary Slide Portrait
This is a radar chart with markers ppt powerpoint presentation summary slide portrait. This is a seven stage process. The stages in this process are percentage, product, business, marketing.

Cost Benefit Analysis Chart Ppt PowerPoint Presentation Ideas Shapes
This is a cost benefit analysis chart ppt powerpoint presentation ideas shapes. This is a two stage process. The stages in this process are reduced costs, operating cost, benefits, costs, increase salary.

Hierarchical Organization Chart Ppt PowerPoint Presentation Ideas Skills
This is a hierarchical organization chart ppt powerpoint presentation ideas skills. This is a three stage process. The stages in this process are business ownership, family business, owned business.
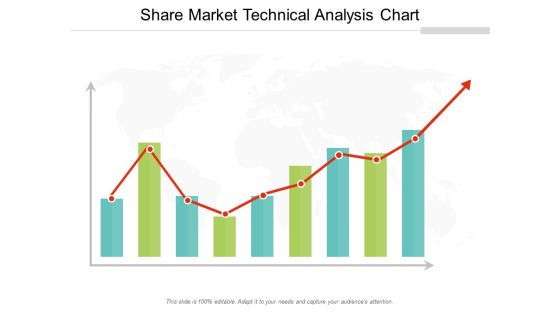
Share Market Technical Analysis Chart Ppt Powerpoint Presentation Professional Rules
This is a share market technical analysis chart ppt powerpoint presentation professional rules. This is a three stage process. The stages in this process are stock market, financial market, bull market.

Mobile With Analytics Chart Ppt PowerPoint Presentation Layouts Graphics
This is a mobile with analytics chart ppt powerpoint presentation layouts graphics. This is a four stage process. The stages in this process are mobile analytics, mobile tracking, mobile web analytics.

Scatter Bubble Chart Finance Ppt Powerpoint Presentation Layouts Summary
This is a scatter bubble chart finance ppt powerpoint presentation layouts summary. This is a two stage process. The stages in this process are financial, minimum, maximum, marketing, strategy.

Corporate Governance Flow Chart Ppt PowerPoint Presentation Show Diagrams
Presenting this set of slides with name corporate governance flow chart ppt powerpoint presentation show diagrams. This is a five stage process. The stages in this process are headquarters, manufacturing, marketing, finance, other functions. This is a completely editable PowerPoint presentation and is available for immediate download. Download now and impress your audience.

Combo Chart Bar Ppt PowerPoint Presentation Slides Portfolio
This is a company growth strategy ppt powerpoint presentation professional slides. This is a three stage process. The stages in this process are finance, marketing, analysis, investment, million.

Compliance Management Structural Chart Ppt Model Graphics Template PDF
Presenting this set of slides with name compliance management structural chart ppt model graphics template pdf. This is a four stage process. The stages in this process are chief compliance officer, compliance committee, worldwide sites, administrative office. This is a completely editable PowerPoint presentation and is available for immediate download. Download now and impress your audience.

Six Sigma Circular Chart With Down Arrows Powerpoint Slide Images
This is a six sigma circular chart with down arrows powerpoint slide images. This is a five stage process. The stages in this process are recognize, realize, measure, define, analyze, improve, control, voice of customer and voice of process, practical problem, statistical problem, statistical solution, practical solution, control plan, result.
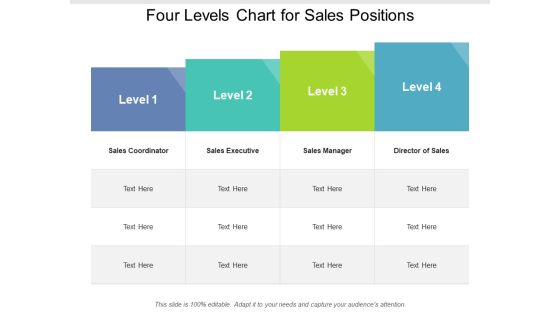
Four Levels Chart For Sales Positions Ppt PowerPoint Presentation Show
Presenting this set of slides with name four levels chart for sales positions ppt powerpoint presentation show. This is a four stage process. The stages in this process are Multi Level Growth Table, Process, Planning. This is a completely editable PowerPoint presentation and is available for immediate download. Download now and impress your audience.

Brand Building Chart Ppt PowerPoint Presentation Outline Show
Presenting this set of slides with name brand building chart ppt powerpoint presentation outline show. This is a five stage process. The stages in this process are quality, value proposition. This is a completely editable PowerPoint presentation and is available for immediate download. Download now and impress your audience.
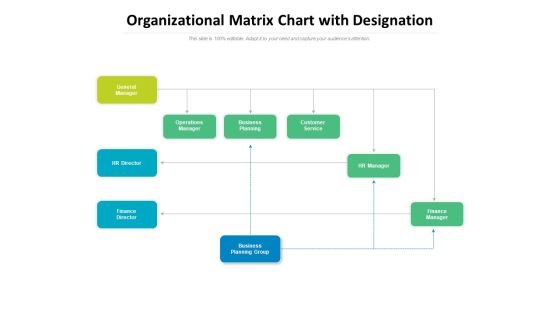
Organizational Matrix Chart With Designation Ppt PowerPoint Presentation File Infographics
Presenting this set of slides with name organizational matrix chart with designation ppt powerpoint presentation file infographics. This is a nine stage process. The stages in this process are general manager, finance director, business planning group, hr manager, customer service, business planning. This is a completely editable PowerPoint presentation and is available for immediate download. Download now and impress your audience.

Organization Chart Communication Ppt PowerPoint Presentation Gallery Guidelines
Presenting this set of slides with name organization chart communication ppt powerpoint presentation gallery guidelines. This is a five stage process. The stages in this process are business, management, planning, strategy, marketing. This is a completely editable PowerPoint presentation and is available for immediate download. Download now and impress your audience.

Departmental Organizational Structure Chart Ppt PowerPoint Presentation File Portfolio
Presenting this set of slides with name departmental organizational structure chart ppt powerpoint presentation file portfolio. This is a four stage process. The stages in this process are executive board, sales, hr, it, department. This is a completely editable PowerPoint presentation and is available for immediate download. Download now and impress your audience.

Compliance Department Organizational Chart Ppt Gallery Influencers PDF
Presenting this set of slides with name compliance department organizational chart ppt gallery influencers pdf. This is a one stage process. The stages in this process are group hotline, group company hotline, chief compliance officer, internal, external, employee, instruct, employees. This is a completely editable PowerPoint presentation and is available for immediate download. Download now and impress your audience.

Company Org Chart With Designations Ppt PowerPoint Presentation Professional Infographics
Presenting this set of slides with name company org chart with designations ppt powerpoint presentation professional infographics. This is a five stage process. The stages in this process are designation, managers. This is a completely editable PowerPoint presentation and is available for immediate download. Download now and impress your audience.

Company Structure Chart With Designation Ppt PowerPoint Presentation Styles Shapes
Presenting this set of slides with name company structure chart with designation ppt powerpoint presentation styles shapes. This is a five stage process. The stages in this process are designation, managers. This is a completely editable PowerPoint presentation and is available for immediate download. Download now and impress your audience.
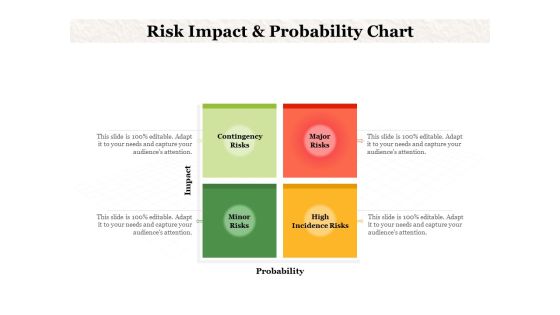
Risk Impact And Probability Chart Ppt PowerPoint Presentation Inspiration Background
Presenting this set of slides with name risk impact and probability chart ppt powerpoint presentation inspiration background. This is a four stage process. The stages in this process are contingency risks, major risks, minor risks, high incidence risks. This is a completely editable PowerPoint presentation and is available for immediate download. Download now and impress your audience.
Business Diagram 8 Staged Circle Chart With Icons Presentation Template
This is an amazing diagram to explain process by dissolving the stages of a process, or by depicting how process works. This is an excellent diagram which enhances the essence of your viable ideas. Use it to organize the logic of your views.
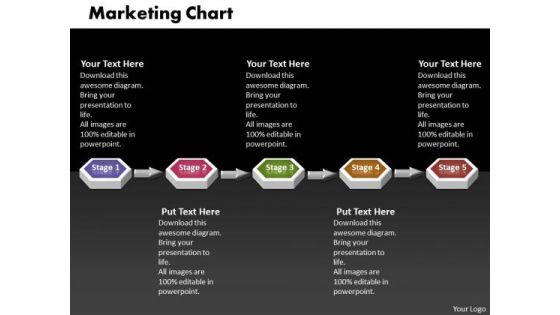
Ppt 3d Linear Mobile Marketing PowerPoint Presentation Flow Chart Templates
PPT 3d linear mobile marketing powerpoint presentation flow chart Templates-Use this 3D Animated PowerPoint Diagram to demonstrate the Marketing Flow Process step wise step. This Diagram imitates the following concept: connected, consecutive, continued, day and night, endless, everlasting, extended etc.-PPT 3d linear mobile marketing powerpoint presentation flow chart Templates-Abstract, Action, Attention, Business, Chart, Clipart, Commerce, Concept, Conceptual, Corporate, Customer, Design, Desire, Diagram, Flow, Goals, Guide, Icon, Idea, Illustration, Interest, Manage, Management, Map, Marketing, Mind, Mission, Model, Organization, Performance, Planning, Plans, Process

Accounting Department Organizational Chart Ppt PowerPoint Presentation Pictures Graphics
Presenting this set of slides with name accounting department organizational chart ppt powerpoint presentation pictures graphics. This is a five stage process. The stages in this process are board of directors, chief executive officer, vice presidents, chief financial officer, controller, treasurer, internal auditor, managerial accountant, financial accountant, tax accountant. This is a completely editable PowerPoint presentation and is available for immediate download. Download now and impress your audience.

Flow Chart For It Operation Diagram Presentation Background Images
This is a flow chart for it operation diagram presentation background images. This is a five stage process. The stages in this process are customer expectations, management perceptions of customer expectations, customer perceptions, service delivery, service standard, managing the evidence, understanding, the customer, services design, conformance.

Circular Steps Chart With Financial Icons Powerpoint Slides
This business slide contains circular steps infographic diagram. This diagram is suitable to present financial planning steps. Enlighten others on the process with this innovative PowerPoint template.

Parent Company Workflow Chart Ppt PowerPoint Presentation Summary Clipart
Presenting this set of slides with name parent company workflow chart ppt powerpoint presentation summary clipart. This is a one stage process. The stages in this process are holding company, business plan, investment company. This is a completely editable PowerPoint presentation and is available for immediate download. Download now and impress your audience.

Data Integration Workflow Chart Ppt PowerPoint Presentation Gallery Ideas PDF
Presenting this set of slides with name data integration workflow chart ppt powerpoint presentation gallery ideas pdf. This is a five stage process. The stages in this process are design, resource, planning. This is a completely editable PowerPoint presentation and is available for immediate download. Download now and impress your audience.
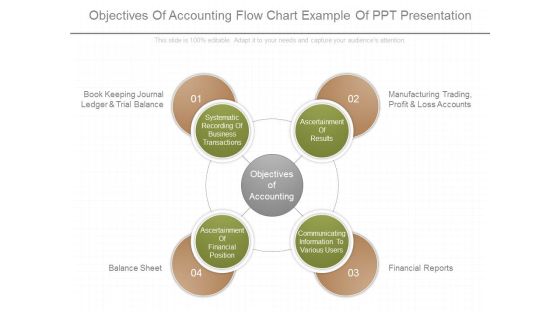
Objectives Of Accounting Flow Chart Example Of Ppt Presentation
This is a objectives of accounting flow chart example of ppt presentation. This is a four stage process. The stages in this process are book keeping journal ledger and trial balance, manufacturing trading profit and loss accounts, balance sheet, financial reports, systematic recording of business transactions, ascertainment of results, ascertainment of financial position, communicating information to various users, objectives of accounting.

Company Hierarchy Flow Chart Icon Ppt PowerPoint Presentation Gallery Portfolio
Presenting this set of slides with name company hierarchy flow chart icon ppt powerpoint presentation gallery portfolio. This is a three stage process. The stages in this process are strengths, strategic planning, scalability in business. This is a completely editable PowerPoint presentation and is available for immediate download. Download now and impress your audience.

Flow Chart Market Entry Planning Example Ppt Presentation
This is a flow chart market entry planning example ppt presentation. This is a four stage process. The stages in this process are market entry strategy, export, licensing, contract manufacturing, joint venture, direct foreign investment, indirect, direct, agent, distributor, strategic alliance, ownership.
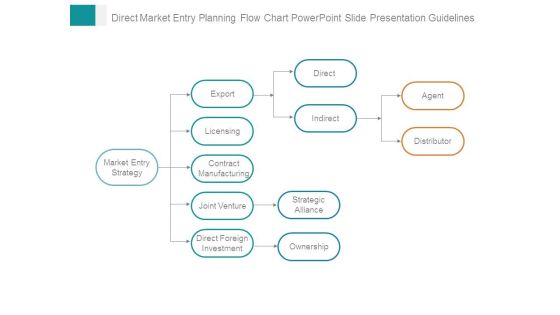
Direct Market Entry Planning Flow Chart Powerpoint Slide Presentation Guidelines
This is a direct market entry planning flow chart powerpoint slide presentation guidelines. This is a four stage process. The stages in this process are market entry strategy, export, licensing, contract manufacturing, joint venture, direct foreign investment, direct, indirect, strategic alliance, ownership, agent, distributor.

Organizational Integration Flow Chart Ppt PowerPoint Presentation Show Infographic Template
Presenting this set of slides with name organizational integration flow chart ppt powerpoint presentation show infographic template. This is a two stage process. The stages in this process are assimilating, business integration, organizational integration. This is a completely editable PowerPoint presentation and is available for immediate download. Download now and impress your audience.

Financial Growth Examples Flow Chart Diagram Powerpoint Slide Graphics
This is a financial growth examples flow chart diagram powerpoint slide graphics. This is a six stage process. The stages in this process are increase in productivity, economic growth and development, increase in flow of goods and services in economy, consumption rises, size of market increase, inducement to invest for firms.

Client Support Workflow Chart Ppt PowerPoint Presentation Gallery Tips PDF
Presenting this set of slides with name client support workflow chart ppt powerpoint presentation gallery tips pdf. This is a five stage process. The stages in this process are development, tester, technical support, sales, customer request help, error report customer, technical analysis, fix the issue. This is a completely editable PowerPoint presentation and is available for immediate download. Download now and impress your audience.
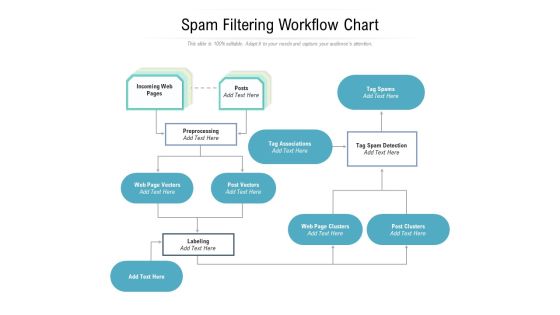
Spam Filtering Workflow Chart Ppt PowerPoint Presentation File Examples PDF
Presenting this set of slides with name spam filtering workflow chart ppt powerpoint presentation file examples pdf. This is a one stage process. The stages in this process are associations, detection, preprocessing. This is a completely editable PowerPoint presentation and is available for immediate download. Download now and impress your audience.

Sample Of Sales Flow Chart Ppt Powerpoint Slide Download
This is a sample of sales flow chart ppt powerpoint slide download. This is a eight stage process. The stages in this process are select product, decide on suggested product, review and confirm shopping car, confirm address information, print license, specify inventory fulfillment method, submit payment, answer survey questions.

Operating Variable Flow Chart Powerpoint Slide Design Templates
This is a operating variable flow chart powerpoint slide design templates. This is a three stage process. The stages in this process are operating variable, technology what consumer technologies should we focus on, user or non user status should we serve heavy users medium users light or non users, customer capabilities should we serve customer needing many or few services.

Procurement Spend Assessment Chart Ppt PowerPoint Presentation Model Introduction
Presenting this set of slides with name procurement spend assessment chart ppt powerpoint presentation model introduction. This is a one stage process. The stages in this process are strategically managed spend, tail spend, supplier. This is a completely editable PowerPoint presentation and is available for immediate download. Download now and impress your audience.

Circle Chart With Percentage Value Analysis Powerpoint Slides
This PowerPoint template has been designed with circular process diagram. This business diagram helps to exhibit financial process control and analysis. Use this diagram to visually support your content.

Brand Rollout Plan Chart Ppt PowerPoint Presentation Icon Graphics Tutorials
Presenting this set of slides with name brand rollout plan chart ppt powerpoint presentation icon graphics tutorials. This is a five stage process. The stages in this process are quality, value proposition, product. This is a completely editable PowerPoint presentation and is available for immediate download. Download now and impress your audience.

Four Circles Chart Financial Growth Steps Powerpoint Slides
Our professionally designed business diagram is as an effective tool for communicating cyclic processes. It contains circular graphics with icons. Above slide is suitable to display process management steps.
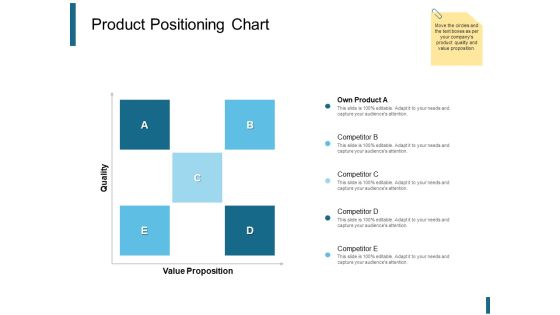
Product Positioning Chart Ppt PowerPoint Presentation Outline Objects
Presenting this set of slides with name product positioning chart ppt powerpoint presentation outline objects. This is a one stage process. The stages in this process are position brand, value proposition, quality, competitor, product. This is a completely editable PowerPoint presentation and is available for immediate download. Download now and impress your audience.

Project Team Organization Chart Template Ppt PowerPoint Presentation Outline Guide
Presenting this set of slides with name project team organization chart template ppt powerpoint presentation outline guide. This is a two stage process. The stages in this process are team, marketing, activities and team. This is a completely editable PowerPoint presentation and is available for immediate download. Download now and impress your audience.

Benefits Cost Analysis Chart Ppt Powerpoint Presentation Summary Visuals
This is a balance scale with cost and benefits ppt powerpoint presentation show. This is a two stage process. The stages in this process are business, finance, marketing, strategy, compare, management.

Data Flow Chart Vector Icon Ppt PowerPoint Presentation File Samples
Presenting this set of slides with name data flow chart vector icon ppt powerpoint presentation file samples. This is a one stage process. The stages in this process are data icon, status icon, status symbol icon. This is a completely editable PowerPoint presentation and is available for immediate download. Download now and impress your audience.

Basic Gap Analysis Chart Ppt Powerpoint Presentation Ideas File Formats
This is a basic gap analysis chart ppt powerpoint presentation ideas file formats. This is a six stage process. The stages in this process are what exactly is the gap, what are the consequences of the gap, what is timing, who is responsible.
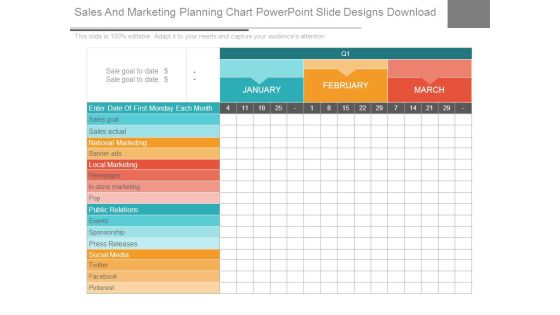
Sales And Marketing Planning Chart Powerpoint Slide Designs Download
This is a sales and marketing planning chart powerpoint slide designs download. This is a three stage process. The stages in this process are sales goal, sales actual, national marketing, banner ads, local marketing, newspaper, in store marketing, pop, public relations, events, sponsorship, press releases, social media, twitter, facebook.

Strategic Management Objectives Chart Ppt PowerPoint Presentation Gallery Templates PDF
Presenting this set of slides with name strategic management objectives chart ppt powerpoint presentation gallery templates pdf. This is a one stage process. The stages in this process are sales, marketing, industry. This is a completely editable PowerPoint presentation and is available for immediate download. Download now and impress your audience.

Product Management Success Chart Sample Of Ppt Presentation
This is a product management success chart sample of ppt presentation. This is a four stage process. The stages in this process are sales driven, market driven, competitor driven, customer driven, technology driven, path to profitability, customer satisfaction, unit sales growth.

Brand Positioning Chart Ppt PowerPoint Presentation Infographics Layout
Presenting this set of slides with name brand positioning chart ppt powerpoint presentation infographics layout. This is a five stage process. The stages in this process are brand positioning, business, management, planning, strategy. This is a completely editable PowerPoint presentation and is available for immediate download. Download now and impress your audience.

Brand Positioning Chart Ppt PowerPoint Presentation Layouts Show
Presenting this set of slides with name brand positioning chart ppt powerpoint presentation layouts show. This is a five stage process. The stages in this process are business, management, planning, strategy, marketing. This is a completely editable PowerPoint presentation and is available for immediate download. Download now and impress your audience.

Brand Positioning Chart Ppt PowerPoint Presentation Summary Design Ideas
Presenting this set of slides with name brand positioning chart ppt powerpoint presentation summary design ideas. This is a five stage process. The stages in this process are business, management, planning, strategy, marketing. This is a completely editable PowerPoint presentation and is available for immediate download. Download now and impress your audience.

Brand Positioning Chart Ppt PowerPoint Presentation File Templates
Presenting this set of slides with name brand positioning chart ppt powerpoint presentation file templates. This is a five stage process. The stages in this process are business, management, planning, strategy, marketing. This is a completely editable PowerPoint presentation and is available for immediate download. Download now and impress your audience.
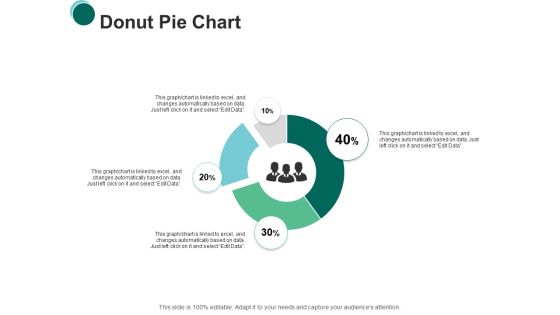
Donut Pie Chart Finance Ppt PowerPoint Presentation Infographics Slides
Presenting this set of slides with name donut pie chart finance ppt powerpoint presentation infographics slides. This is a four stage process. The stages in this process are finance, marketing, management, investment, analysis. This is a completely editable PowerPoint presentation and is available for immediate download. Download now and impress your audience.

Business Functional Structure Chart Ppt PowerPoint Presentation File Rules PDF
Presenting this set of slides with name business functional structure chart ppt powerpoint presentation file rules pdf. This is a four stage process. The stages in this process are management, executive, staff. This is a completely editable PowerPoint presentation and is available for immediate download. Download now and impress your audience.

Brand Positioning Chart Ppt Powerpoint Presentation Inspiration Templates
Presenting this set of slides with name brand positioning chart ppt powerpoint presentation inspiration templates. This is a two stage process. The stages in this process are value proposition, quality. This is a completely editable PowerPoint presentation and is available for immediate download. Download now and impress your audience.
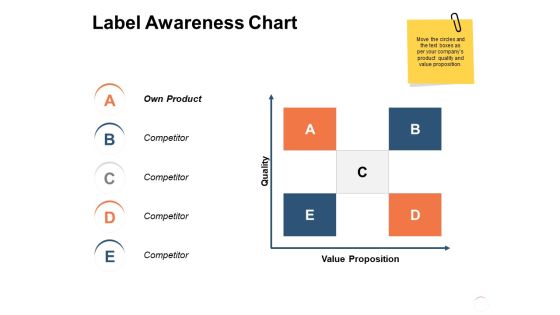
Label Awareness Chart Ppt PowerPoint Presentation Infographics Pictures
Presenting this set of slides with name label awareness chart ppt powerpoint presentation infographics pictures. This is a five stage process. The stages in this process are quality, value proposition, competitor. This is a completely editable PowerPoint presentation and is available for immediate download. Download now and impress your audience.

Brand Strategy Chart Ppt Powerpoint Presentation Infographic Template Maker
Presenting this set of slides with name brand strategy chart ppt powerpoint presentation infographic template maker. This is a five stage process. The stages in this process are competitor, quality, value proposition. This is a completely editable PowerPoint presentation and is available for immediate download. Download now and impress your audience.
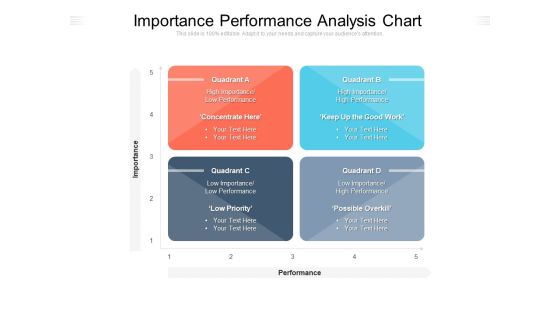
Importance Performance Analysis Chart Ppt PowerPoint Presentation Gallery Examples PDF
Presenting this set of slides with name importance performance analysis chart ppt powerpoint presentation gallery examples pdf. This is a four stage process. The stages in this process are performance, priority, quadrant. This is a completely editable PowerPoint presentation and is available for immediate download. Download now and impress your audience.

Reputation Marketing Strategy Chart Sample Of Ppt Presentation
This is a reputation marketing strategy chart sample of ppt presentation. This is a four stage process. The stages in this process are sales strategies, monitor and engage, educate and inspire, get reviews, market reputation, manage reputation, create culture, build the reputation.
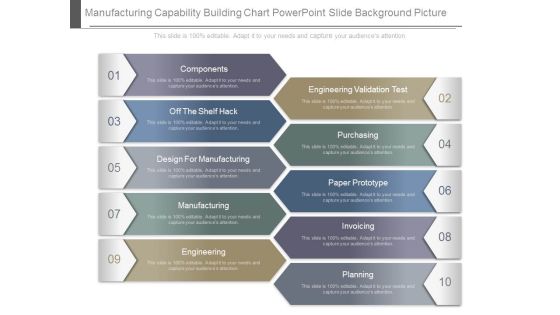
Manufacturing Capability Building Chart Powerpoint Slide Background Picture
This is a manufacturing capability building chart powerpoint slide background picture. This is a ten stage process. The stages in this process are components, off the shelf hack, design for manufacturing, manufacturing, engineering, engineering validation test, purchasing, paper prototype, invoicing, planning.

Organizational Chart Behavioral Segmentation Powerpoint Slide Presentation Examples
This is a organizational chart behavioral segmentation powerpoint slide presentation examples. This is a six stage process. The stages in this process are target market, aware, unaware, tried, not tried, repeated, not yet repeated, rejecter, favorable opinion, neutral, negative opinion, loyal to brand, switcher, loyal to other brand, heavy user, regular user, light user.

Customer Lifetime Value Analysis Chart Example Of Ppt Presentation
This is a customer lifetime value analysis chart example of ppt presentation. This is a three stage process. The stages in this process are inactive nonprofit able customer, active profitable customers, very active very profitable customers, lifetime value, average order value, number of repeat sales, average retention time.

Sales Breakdown Pie Chart Dashboard Powerpoint Slide Influencers
This is a sales breakdown pie chart dashboard powerpoint slide influencers. This is a four stage process. The stages in this process are railway stations and other, downtown hotel and resorts, cruise liners and seaports, airports, north america, south america, central america and caribbean, eurasia and asia, africa, europe.

Basic Gap Analysis Chart Ppt PowerPoint Presentation Microsoft
This is a basic gap analysis chart ppt powerpoint presentation microsoft. This is a five stage process. The stages in this process are what exactly is the gap, what are the consequences of the gap, what is timing who is responsible, what are the option, what are the cost.
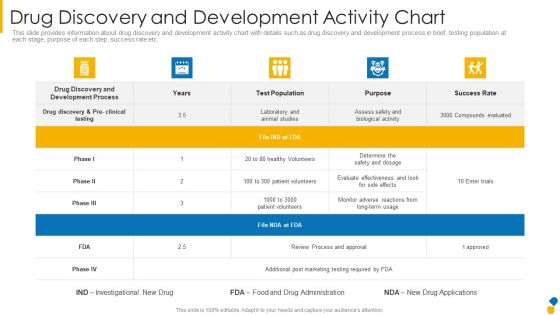
Drug Discovery And Development Activity Chart Introduction PDF
Deliver an awe inspiring pitch with this creative drug discovery and development activity chart introduction pdf bundle. Topics like drug discovery and development process, laboratory and animal studies, review process and approval can be discussed with this completely editable template. It is available for immediate download depending on the needs and requirements of the user.

Venn Business Chart With Percentage Value Powerpoint Template
This PPT slide contains Venn business chart with percentage values. This PPT diagram is suitable to present data comparison and analysis. Enlighten others on the process with this innovative PowerPoint template.
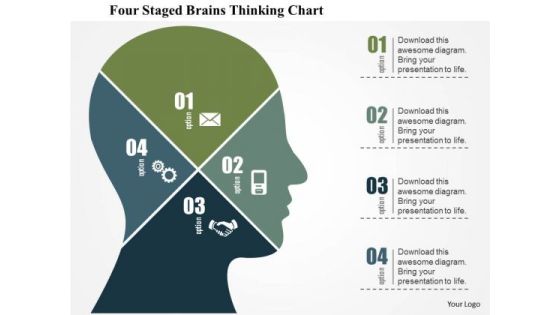
Business Diagram Four Staged Brains Thinking Chart Presentation Template
Graphic of four staged chart in human brain has been used to design this business diagram. This slide depicts concept of thinking process and analysis. Make your presentation more interactive with this business slide.
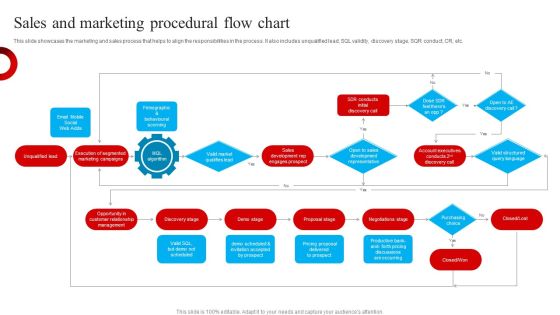
Sales And Marketing Procedural Flow Chart Themes PDF
This slide showcases the marketing and sales process that helps to align the responsibilities in the process. It also includes unqualified lead, SQL validity, discovery stage, SQR conduct, CR, etc. Presenting Sales And Marketing Procedural Flow Chart Themes PDF to dispense important information. This template comprises one stages. It also presents valuable insights into the topics including Discovery Stage, Demo Stage, Proposal Stage . This is a completely customizable PowerPoint theme that can be put to use immediately. So, download it and address the topic impactfully.
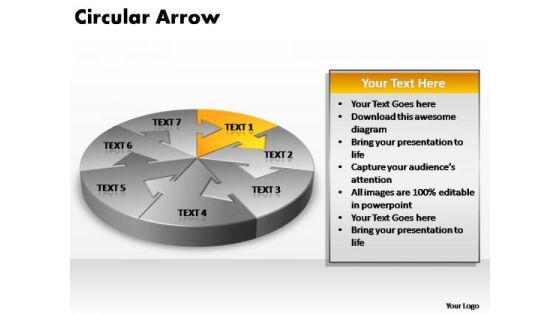
PowerPoint Template Chart Circular Arrow Ppt Slide Designs
PowerPoint Template Chart Circular Arrow PPT Slide Designs-The arrows indicate the progression of the process. Constant monitoring of the processes provides you with opportunities to concentrate on the core competencies in your business and improve the standards for more effective results.-PowerPoint Template Chart Circular Arrow PPT Slide Designs

Chart Illustrating Manufacturing Plant Energy Consumption Statistics Slides PDF
This graph or chart is linked to excel, and changes automatically based on data. Just left click on it and select edit data. Pitch your topic with ease and precision using this Chart Illustrating Manufacturing Plant Energy Consumption Statistics Slides PDF. This layout presents information on Equipment Inefficiency, Process Heating, Energy Export. It is also available for immediate download and adjustment. So, changes can be made in the color, design, graphics or any other component to create a unique layout.

Financial Management Workflow Chart Ppt PowerPoint Presentation Infographics Mockup PDF
Presenting this set of slides with name financial management workflow chart ppt powerpoint presentation infographics mockup pdf. This is a nine stage process. The stages in this process are build advance financial controls, control analysis review, indent report remediate and review incidents, remediate and review results, import pre build models, import pre build models, collect configuration data, manage control. This is a completely editable PowerPoint presentation and is available for immediate download. Download now and impress your audience.
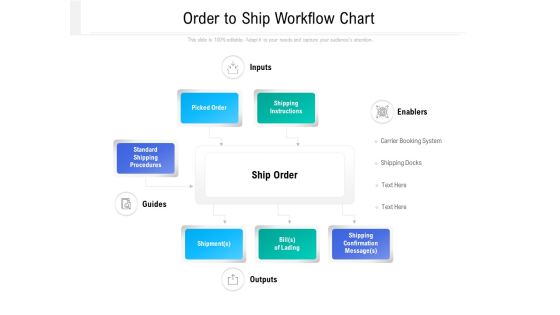
Order To Ship Workflow Chart Ppt PowerPoint Presentation Backgrounds PDF
Presenting this set of slides with name order to ship workflow chart ppt powerpoint presentation backgrounds pdf. This is a four stage process. The stages in this process are inputs, picked order, shipping instructions, standard shipping procedures, guides, outputs, ship order, enablers, shipping confirmation message, bill of lading, shipment. This is a completely editable PowerPoint presentation and is available for immediate download. Download now and impress your audience.

Business Framework Explosive Growth Expansion Timeline Roadmap Chart PowerPoint Presentation
Circular text boxes in vertical order has been used to design this power point template slide. This PPT slide contain the concept of expanding domain influence. Use this PPt for your business process related topics.

Moscow Prioritization Technique Chart Ppt PowerPoint Presentation File Gallery PDF
Presenting this set of slides with name moscow prioritization technique chart ppt powerpoint presentation file gallery pdf. This is a four stage process. The stages in this process are must have, should have, could have, wont have, efficient resources to increase output, proper training given to employees. This is a completely editable PowerPoint presentation and is available for immediate download. Download now and impress your audience.
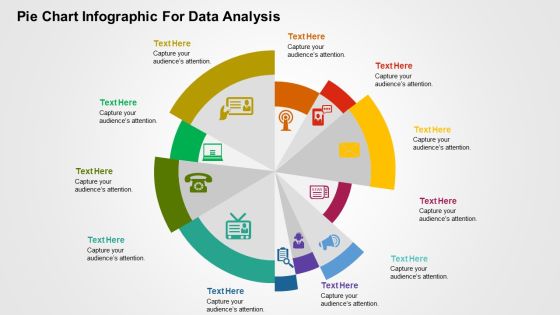
Pie Chart Infographic For Data Analysis PowerPoint Templates
This is one of the most downloaded PowerPoint template. This slide can be used for various purposes and to explain a number of processes. This can be included in your presentation to explain each step of a process and even include its relevance and importance in a single diagram. Using the uneven circular structure of the pie chart, the presenter can also explain random steps or highlight particular steps of process or parts of an organization or business that need special attention of any kind to the audience. Additionally, you can use this slide to show a transformation process or highlight key features of a product.

Iot Applications For Manufacturing Industry Column Chart Ideas PDF
This slide highlights the IoT implementation drivers for manufacturing and production sector which showcases it will improve operational efficiency, asset utilization and business process development. Do you have an important presentation coming up Are you looking for something that will make your presentation stand out from the rest Look no further than Iot Applications For Manufacturing Industry Column Chart Ideas PDF. With our professional designs, you can trust that your presentation will pop and make delivering it a smooth process. And with Slidegeeks, you can trust that your presentation will be unique and memorable. So why wait Grab Iot Applications For Manufacturing Industry Column Chart Ideas PDF today and make your presentation stand out from the rest.

Continuous Illustration Of 6 Stages Create Flow Chart PowerPoint Slides
We present our continuous illustration of 6 stages create flow chart PowerPoint Slides.Download and present our Advertising PowerPoint Templates because your foot is on the pedal and your company is purring along smoothly. Use our Arrows PowerPoint Templates because you should Emphasise the process of your business or corporate growth. Present our Business PowerPoint Templates because you can see clearly through to the bigger bowl ahead. Time your jump to perfection and hit the nail on the head. Download our Shapes PowerPoint Templates because you have the ideas, you have got a brainwave. Use our Flow charts PowerPoint Templates because presenting your views using our innovative slides, will be assured of leaving a lasting impression.Use these PowerPoint slides for presentations relating to Arrow Background Blue Business Button Chart Diagram Goal Graphic Gray Illustration Important Management Organization Priority Process Setting Task Transparency Urgent White. The prominent colors used in the PowerPoint template are Blue, Gray, Black. Use our continuous illustration of 6 stages create flow chart PowerPoint Slides are Magnificent. Presenters tell us our Business PowerPoint templates and PPT Slides are Fantastic. Presenters tell us our continuous illustration of 6 stages create flow chart PowerPoint Slides are Exuberant. You can be sure our Graphic PowerPoint templates and PPT Slides are Handsome. PowerPoint presentation experts tell us our continuous illustration of 6 stages create flow chart PowerPoint Slides are Amazing. Professionals tell us our Goal PowerPoint templates and PPT Slides are aesthetically designed to attract attention. We guarantee that they will grab all the eyeballs you need.

Four Steps Plant Business Growth Chart Powerpoint Template
Our above PPT slide contains diagram of green plant. This PowerPoint template helps to exhibit business growth planning. Enlighten others on the process with this innovative PowerPoint template.

Project Budget Planning Audit Flow Chart Mockup PDF
This slide covers flow chart which will be helpful for doing regular financial audits. It includes a process steps such as project creation, assign task, conduct meeting and monitoring project status. Persuade your audience using this project budget planning audit flow chart mockup pdf. This PPT design covers one stages, thus making it a great tool to use. It also caters to a variety of topics including project, monitor project status, data warehouse, sign off process, assign task. Download this PPT design now to present a convincing pitch that not only emphasizes the topic but also showcases your presentation skills.
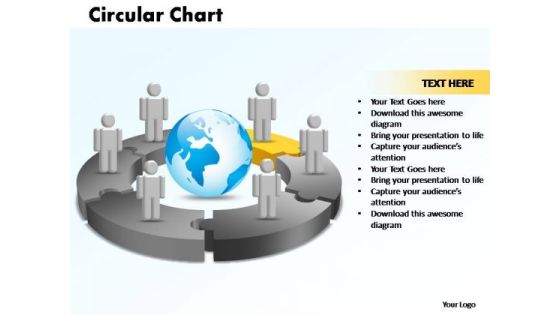
PowerPoint Themes Circular Chart With Globe Ppt Template
PowerPoint Themes Circular Chart With Globe PPT Template-The Circle of Life - a concept emmbedded in our minds and hence easy to comprehend. Life and Business is made up of processes comprising stages that flow from one to another. An excellent graphic to attract the attention of and understanding by your audience to improve earnings.-PowerPoint Themes Circular Chart With Globe PPT Template

PowerPoint Themes Circular Chart With Globe Ppt Templates
PowerPoint Themes Circular Chart With Globe PPT Templates-The Circle of Life - a concept emmbedded in our minds and hence easy to comprehend. Life and Business is made up of processes comprising stages that flow from one to another. An excellent graphic to attract the attention of and understanding by your audience to improve earnings.-PowerPoint Themes Circular Chart With Globe PPT Templates
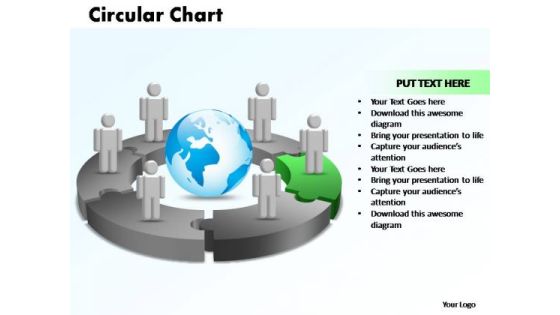
PowerPoint Themes Circular Chart With Globe Ppt Theme
PowerPoint Themes Circular Chart With Globe PPT Theme-The Circle of Life - a concept emmbedded in our minds and hence easy to comprehend. Life and Business is made up of processes comprising stages that flow from one to another. An excellent graphic to attract the attention of and understanding by your audience to improve earnings.-PowerPoint Themes Circular Chart With Globe PPT Theme
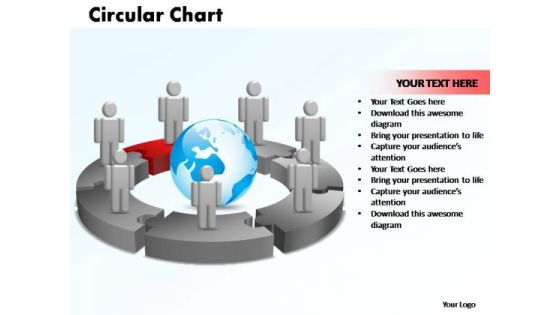
PowerPoint Themes Circular Chart With Globe Ppt Backgrounds
PowerPoint Themes Circular Chart With Globe PPT Backgrounds-The Circle of Life - a concept emmbedded in our minds and hence easy to comprehend. Life and Business is made up of processes comprising stages that flow from one to another. An excellent graphic to attract the attention of and understanding by your audience to improve earnings.-PowerPoint Themes Circular Chart With Globe PPT Backgrounds
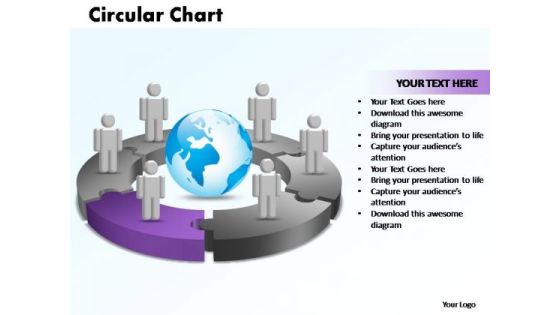
PowerPoint Themes Circular Chart With Globe Ppt Design
PowerPoint Themes Circular Chart With Globe PPT Design-The Circle of Life - a concept emmbedded in our minds and hence easy to comprehend. Life and Business is made up of processes comprising stages that flow from one to another. An excellent graphic to attract the attention of and understanding by your audience to improve earnings.-PowerPoint Themes Circular Chart With Globe PPT Design

 Home
Home