Process Chart

Data Driven Analytics Chart Powerpoint Presentation Templates
This is a data driven analytics chart powerpoint presentation templates. This is a five stage process. The stages in this process are category.

Data Analytics Bar Chart Ppt Sample Presentations
This is a data analytics bar chart ppt sample presentations. This is a five stage process. The stages in this process are category.

Combo Chart Ppt PowerPoint Presentation Portfolio Themes
This is a combo chart ppt powerpoint presentation portfolio themes. This is a three stage process. The stages in this process are market size, product, management, finance, chart, marketing.

Bubble Chart Ppt PowerPoint Presentation Icon Slides
This is a bubble chart ppt powerpoint presentation icon slides. This is a three stage process. The stages in this process are product, finance, business, marketing, bubble chart .
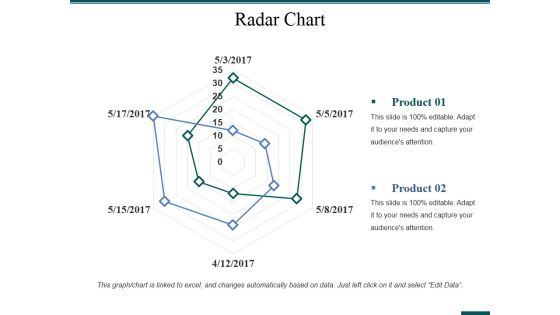
Radar Chart Ppt PowerPoint Presentation Layouts Gallery
This is a radar chart ppt powerpoint presentation layouts gallery. This is a two stage process. The stages in this process are business, analysis, strategy, marketing, radar chart, finance.

Area Chart Ppt PowerPoint Presentation Slides Example
This is a area chart ppt powerpoint presentation slides example. This is a two stage process. The stages in this process are sales in percentage, product, area chart, business, finance.
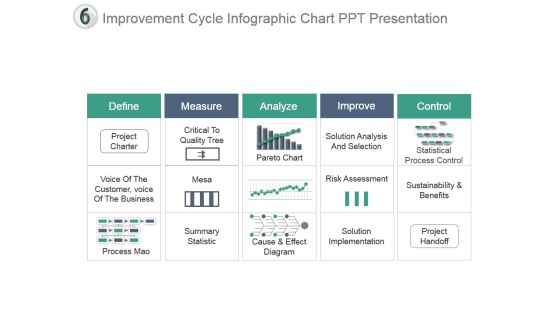
Improvement Cycle Infographic Chart Ppt Presentation
This is a improvement cycle infographic chart ppt presentation. This is a five stage process. The stages in this process are define, measure, analyze, improve, control, project charter, critical to quality tree, process mao, summary statistic, mesa, pareto chart, cause and effect diagram, solution analysis and selection, risk assessment, solution implementation, sustainability and benefits, project handoff, statistical process control, voice of the customer, voice of the business.

Bar Chart Ppt PowerPoint Presentation Icon Layout
This is a bar chart ppt powerpoint presentation icon layout. This is a one stage process. The stages in this process are sales in percentage, financial years, bar chart, finance, marketing.
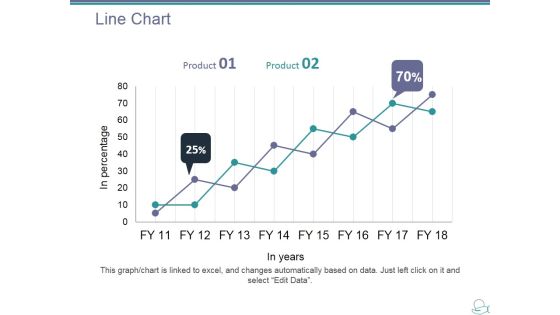
Line Chart Ppt PowerPoint Presentation Layouts Show
This is a line chart ppt powerpoint presentation layouts show. This is a two stage process. The stages in this process are product, in years, in percentage, line chart, growth.

Quality Management Flow Chart Diagram Powerpoint Images
This is a quality management flow chart diagram powerpoint images. This is a four stage process. The stages in this process are project document, project quality management, plan quality management, control quality, perform quality assurance, develop project mgmt. plan, perform integrated, change control, project documents, enterprise, organization, quality mgmt plan, process impr plan, quality metrics, quality control measurements, project mgmt plan update, project document, change requests, project documents updates, organizational process asset update.

Clustered Chart Ppt PowerPoint Presentation Outline Templates
This is a clustered chart ppt powerpoint presentation outline templates. This is a three stage process. The stages in this process are product, in percentage, in years, clustered chart.

Area Chart Ppt PowerPoint Presentation Icon Show
This is a area chart ppt powerpoint presentation icon show. This is a two stage process. The stages in this process are product, financial year, in percentage, area chart.

Combo Chart Ppt PowerPoint Presentation Model Vector
This is a combo chart ppt powerpoint presentation model vector. This is a two stage process. The stages in this process are financial year, in percentage, business, marketing, combo chart.

Line Chart Ppt PowerPoint Presentation Professional Grid
This is a line chart ppt powerpoint presentation professional grid. This is a two stage process. The stages in this process are sales in percentage, financial years, product, line chart.

Bar Chart Ppt PowerPoint Presentation Model Picture
This is a bar chart ppt powerpoint presentation model picture. This is a two stage process. The stages in this process are product, sales in percentage, financial years, bar chart.

Line Chart Ppt PowerPoint Presentation Infographics Infographics
This is a line chart ppt powerpoint presentation infographics infographics. This is a two stage process. The stages in this process are product, sales in percentage, financial year, line chart, finance.

Line Chart Ppt PowerPoint Presentation Gallery Rules
This is a line chart ppt powerpoint presentation gallery rules. This is a two stage process. The stages in this process are financial years, product, sales in percentage, line chart, growth.

Line Chart Ppt PowerPoint Presentation Gallery Templates
This is a line chart ppt powerpoint presentation gallery templates. This is a two stage process. The stages in this process are product, financial years, sales in percentage, line chart.
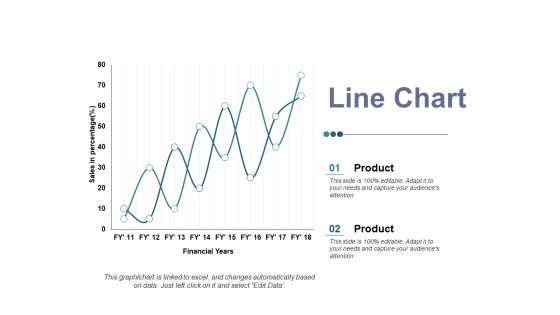
Line Chart Ppt PowerPoint Presentation Ideas Elements
This is a line chart ppt powerpoint presentation ideas elements. This is a two stage process. The stages in this process are product, sales in percentage, financial year, business, line chart.

Organizational Management System Chart Powerpoint Guide
This is a organizational management system chart powerpoint guide. This is a four stage process. The stages in this process are governance, visibility, collaboration, flexibility, control, people, process, technology.

Organizational Change And Development Chart Ppt Slides
This is a organizational change and development chart ppt slides. This is a five stage process. The stages in this process are business process assessment, plan and planning, change impact analysis, stakeholder readiness, monitor change, organization change cycle.
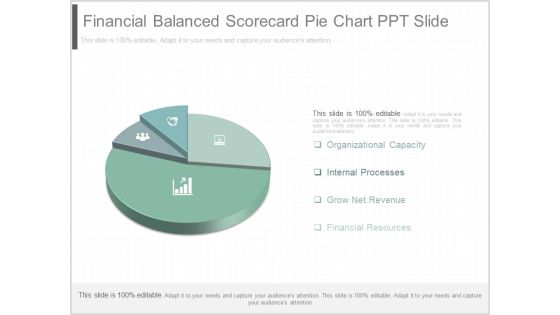
Financial Balanced Scorecard Pie Chart Ppt Slide
This is a financial balanced scorecard pie chart ppt slide. This is a four stage process. The stages in this process are organizational capacity, internal processes, grow net revenue, financial resources.

Financial Marketing Organization Chart Presentation Ideas
This is a financial marketing organization chart presentation ideas. This is a five stage process. The stages in this process are financial system, financial institutions, financial markets, financial instruments, financial services.\n\n
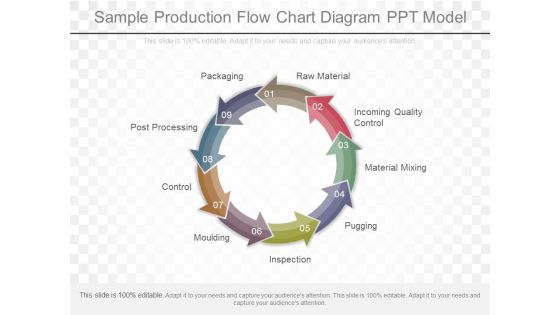
Sample Production Flow Chart Diagram Ppt Model
This is a sample production flow chart diagram ppt model. This is a nine stage process. The stages in this process are raw material, incoming quality control, material mixing, pugging, inspection, moulding, control, post processing, packaging.

Business People Hierarchy Chart Powerpoint Slides
This is a business people hierarchy chart powerpoint slides. This is a four stage process. The stages in this process are anita smith ceo, jeff smith manager, miller bails engineer, mary smith marketing, julie smith programmer, john smith editor.
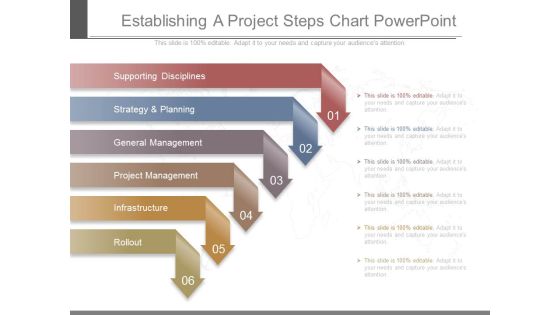
Establishing A Project Steps Chart Powerpoint
This is a establishing a project steps chart powerpoint. This is a six stage process. The stages in this process are supporting disciplines, strategy and planning, general management, project management, infrastructure, rollout.

Market Research Data Collection Chart Presentation
This is a market research data collection chart presentation. This is a five stage process. The stages in this process are concept testing, customer satisfaction, pricing research, market segmentation, awareness usage.

Marketing Potency Management Chart Ppt Slide Show
This is a marketing potency management chart ppt slide show. This is a five stage process. The stages in this process are viable to business, product, people, process, feasible to implement.

Operations Organizational Chart Diagram Powerpoint Templates
This is a operations organizational chart diagram powerpoint templates. This is a eight stage process. The stages in this process are operations manager, customer care specialist, permit design specialist, crew lead, purchasing agent, warehouse personnel, quality control specialist, installers.\n\n

Management Organizational Chart Diagram Powerpoint Ideas
This is a management organizational chart diagram powerpoint ideas. This is a five stage process. The stages in this process are executive director, senior sales manager, senior marketing manager, marketing staff, sales person.
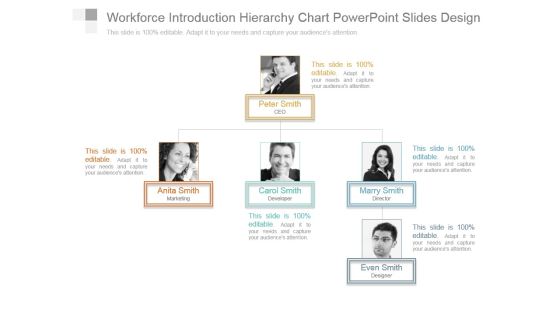
Workforce Introduction Hierarchy Chart Powerpoint Slides Design
This is a workforce introduction hierarchy chart powerpoint slides design. This is a three stage process. The stages in this process are peter smith ceo, anita smith marketing, carol smith developer, marry smith director, even smith designer.
Brand Equity Sample Flow Chart Presentation Outline
This is a brand equity sample flow chart presentation outline. This is a three stage process. The stages in this process are brand equity, brand vitality, brand stature, differentiation, relevance, esteem, familiarly.
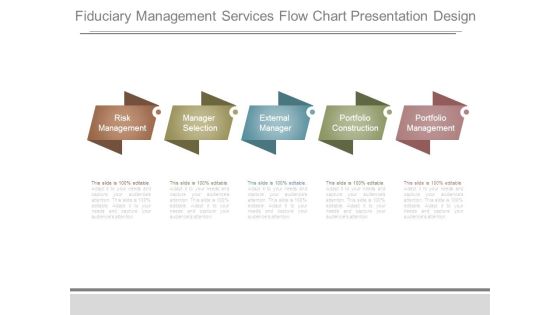
Fiduciary Management Services Flow Chart Presentation Design
This is a fiduciary management services flow chart presentation design. This is a five stage process. The stages in this process are risk management, manager selection, external manager, portfolio construction, portfolio management.

Sample Sales Cycle Flow Chart Ppt Infographics
This is a sample sales cycle flow chart ppt infographics. This is a seven stage process. The stages in this process are fix it, feedback, ask customers, assess progress, set the improved product, make changes, improve it.

Mutual Fund Flow Chart Ppt Presentation
This is a mutual fund flow chart ppt presentation. This is a four stage process. The stages in this process are passed back to, generates, pool their money with, invest in, returns, securities, fund manager, investors.

Business Development Chart Powerpoint Slide Ideas
This is a business development chart powerpoint slide ideas. This is a five stage process. The stages in this process are launch, growth, maturity, saturation, a successful extension strategy could increase sales, decline.
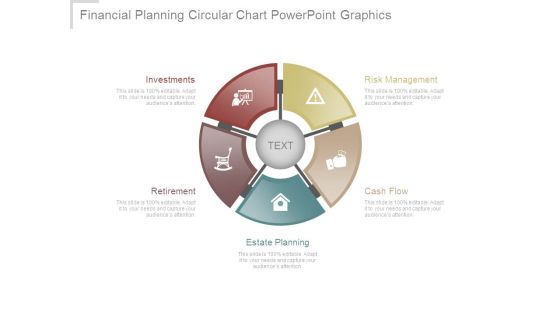
Financial Planning Circular Chart Powerpoint Graphics
This is a financial planning circular chart powerpoint graphics. This is a five stage process. The stages in this process are risk management, cash flow, estate planning, retirement, investments.

Brand Equity Flow Chart Powerpoint Slides
This is a brand equity flow chart powerpoint slides. This is a five stage process. The stages in this process are brand equity, brand awareness, perceived quality, brand association, brand loyalty.

Financial Logistics Pyramid Chart Presentation Ideas
This is a financial logistics pyramid chart presentation ideas. This is a five stage process. The stages in this process are advice, risk management, liquidity management, cash flow management, payments and receivables.

Organizational Leadership Training Chart Ppt Model
This is a organizational leadership training chart ppt model. This is a three stage process. The stages in this process are professional development, introspection reflection, applied in workplace, theory, analysis.

Business Model Canvas Chart Ppt Images
This is a business model canvas chart ppt images. This is a five stage process. The stages in this process are key partners, key activities, value propositions, customer relationships, customer segments, key resources, channels, cost structure, revenue streams.
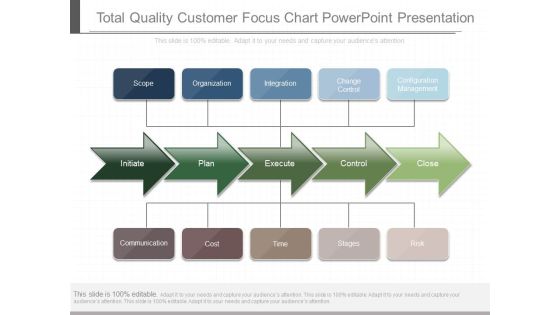
Total Quality Customer Focus Chart Powerpoint Presentation
This is a total quality customer focus chart powerpoint presentation. This is a five stage process. The stages in this process are scope, organization, integration, change control, configuration management, initiate, plan, execute, control, close, communication, cost, time, stages, risk.
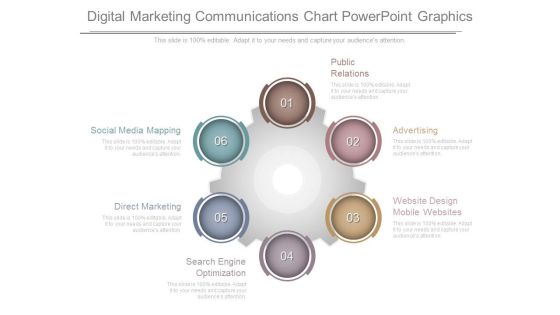
Digital Marketing Communications Chart Powerpoint Graphics
This is a digital marketing communications chart powerpoint graphics. This is a six stage process. The stages in this process are public relations, advertising, website design mobile websites, search engine optimization, direct marketing, social media mapping.

PowerPoint Design Chart V Diagram Ppt Slide
PowerPoint Design Chart V Diagram PPT Slide--Acceptance, Architecture,Chart,Cycle,Deployment, Design, Detail, Detailed, Development, Diagram, Engineering, Function, functional, Implement, Implementation, Management, model, Process, Project,Quality, Requirements, Software, Specification, steps, System, Test,

Application System Administration Chart Powerpoint Slides
This is a application system administration chart powerpoint slides. This is a seven stage process. The stages in this process are human user, memory management, scheduler, application software, operating system, file system management, device drivers.

Service Improvement Plan Pie Chart Ppt Infographics
This is a service improvement plan pie chart ppt infographics. This is a four stage process. The stages in this process are service improvement plan, business, strategy, marketing, management.

Marchandise Management System Chart Ppt Sample
This is a marchandise management system chart ppt sample. This is a seven stage process. The stages in this process are payment management, inspection, marketing, sourcing, channel management, financial management, orders.

Environmental Management Accounting System Chart Ppt Slides
This is a environmental management accounting system chart ppt slides. This is a six stage process. The stages in this process are overheads, environmental cost, direct labour, environmental cost, direct material, environmental cost.
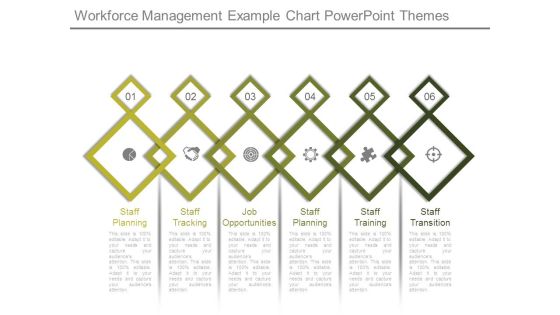
Workforce Management Example Chart Powerpoint Themes
This is a workforce management example chart powerpoint themes. This is a six stage process. The stages in this process are staff planning, staff tracking, job opportunities, staff planning, staff training, staff transition.
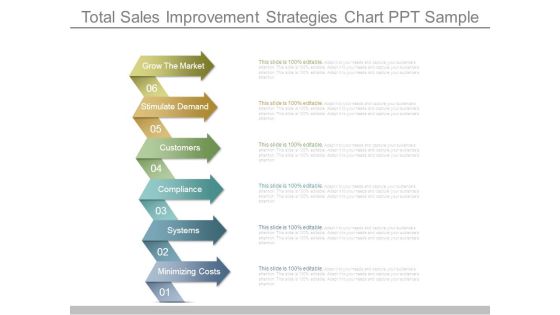
Total Sales Improvement Strategies Chart Ppt Sample
This is a total sales improvement strategies chart ppt sample. This is a six stage process. The stages in this process are grow the market, stimulate demand, customers, compliance, systems, minimizing costs.

Email Marketing Guide Chart Presentation Diagrams
This is a email marketing guide chart presentation diagrams. This is a eight stage process. The stages in this process are automated actions, return on investment, maximum response, consolation, data collection, delivery optimization, list building, contact development, email marketing.

Effectively Integrating Systems Chart Ppt Sample
This is a effectively integrating systems chart ppt sample. This is a four stage process. The stages in this process are action, insight, coordination, result, behavior, knowledge, aligned incentives.\n\n\n\n\n\n\n\n\n\n\n\n\n\n\n\n\n\n
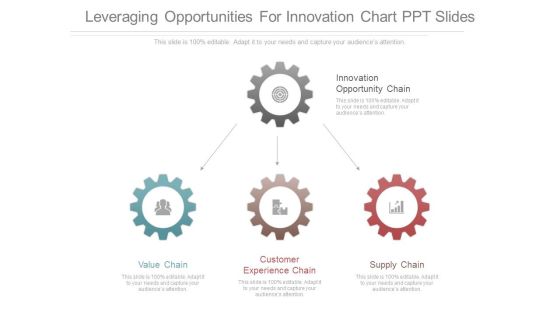
Leveraging Opportunities For Innovation Chart Ppt Slides
This is a leveraging opportunities for innovation chart ppt slides. This is a four stage process. The stages in this process are innovation opportunity chain, value chain, customer experience chain, supply chain.
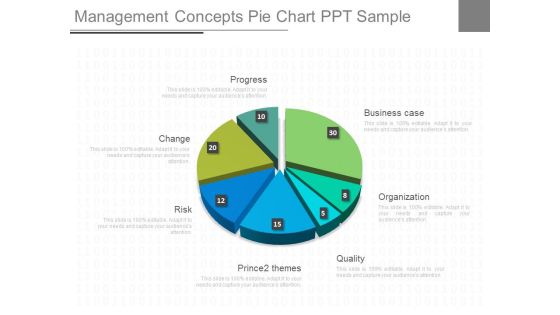
Management Concepts Pie Chart Ppt Sample
This is a management concepts pie chart ppt sample. This is a seven stage process. The stages in this process are business case, organization, quality, prince2 themes, risk, change, progress.

Employee Management Cycle Chart Powerpoint Templates
This is a employee management cycle chart powerpoint templates. This is a seven stage process. The stages in this process are succession planning, performance management, training and development, recruitment, on boarding, attendance, appraisal.

Organizational Change Management Chart Ppt Slides
This is a organizational change management chart ppt slides. This is a five stage process. The stages in this process are align executives, assess change, translate communicate, execute plans, evaluate.
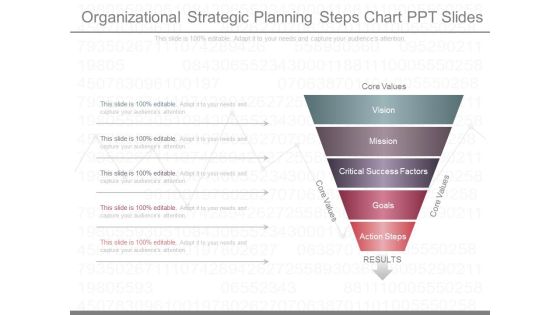
Organizational Strategic Planning Steps Chart Ppt Slides
This is a organizational strategic planning steps chart ppt slides. This is a five stage process. The stages in this process are vision, mission, critical success factors, goals, action steps, core values, results.
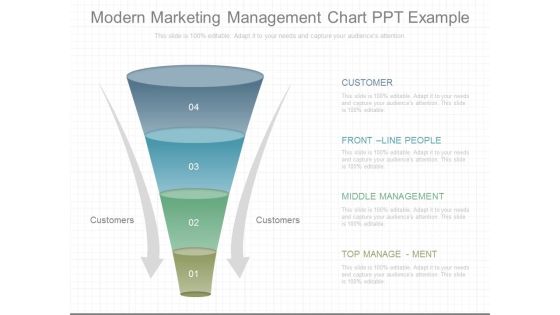
Modern Marketing Management Chart Ppt Example
This is a modern marketing management chart ppt example. This is a four stage process. The stages in this process are customer, customers, front line people, middle management, top management.

Brand Management Tools Chart Powerpoint Slides
This is a brand management tools chart powerpoint slides. This is a nine stage process. The stages in this process are inventory, identify, assess, develop, design, implement, maintain, reassess, strategize.
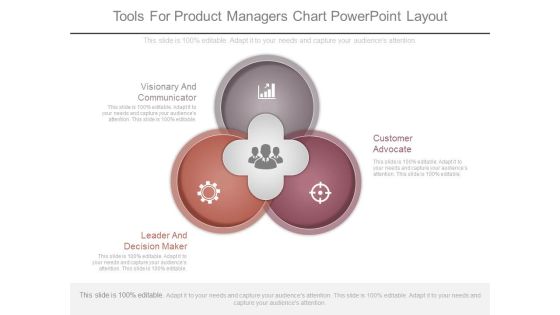
Tools For Product Managers Chart Powerpoint Layout
This is a tools for product managers chart powerpoint layout. This is a three stage process. The stages in this process are visionary and communicator, leader and decision maker, customer advocate.

Professional Brand Management Chart Powerpoint Slides
This is a professional brand management chart powerpoint slides. This is a four stage process. The stages in this process are branding strategies, line extension, brand extension, new brands, multi branding.

Customer Satisfaction Information Chart Ppt Templates
This is a customer satisfaction information chart ppt templates. This is a six stage process. The stages in this process are customer loyalty, quality assurance, timely delivery, reasonable price, customer expectations, customer satisfaction.
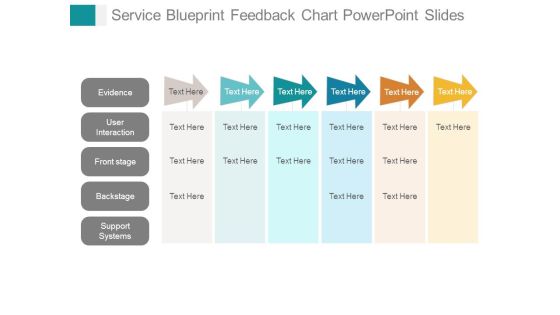
Service Blueprint Feedback Chart Powerpoint Slides
This is a service blueprint feedback chart powerpoint slides. This is a six stage process. The stages in this process are evidence, user interaction, front stage, backstage, support systems.

Content Marketing Methods Cycle Chart Powerpoint Guide
This is a content marketing methods cycle chart powerpoint guide. This is a six stage process. The stages in this process are listen and buyer personas, decide on theme and topic, create content, promote content, measure and evaluate, re purpose.

Buying And Merchandising Cycle Chart Ppt Presentation
This is a buying and merchandising cycle chart ppt presentation. This is a four stage process. The stages in this process are planning, intake, sourcing and range building, trading.

Architecture Development Method Chart Powerpoint Presentation
This is a architecture development method chart powerpoint presentation. This is a ten stage process. The stages in this process are strategic roadmap, current state, requirements, initial planning, deployment, analysis and design, evaluation, future state, architecture vision, business case.

Entrepreneurship Development Example Chart Powerpoint Slide
This is a entrepreneurship development example chart powerpoint slide. This is a six stage process. The stages in this process are innovation, invention, entrepreneurship, opportunity evaluation, personal commitment, managed implementation.
Brand Equity Evolution Chart Powerpoint Show
This is a brand equity evolution chart powerpoint show. This is a five stage process. The stages in this process are brand equity, brand awareness, perceived quality, brand association, brand loyalty.

Comprehensive Competition Analysis Chart Ppt Example
This is a comprehensive competition analysis chart ppt example. This is a four stage process. The stages in this process are competitors objectives, competitors strategy, competitors capabilities, competitors assumptions.

Market Research Funnel Chart Ppt Slides
This is a market research funnel chart ppt slides. This is a three stage process. The stages in this process are enquiry conversion retention up selling, your business, research, campaign, strategy.

Basic Accounting And Bookkeeping Chart Ppt Slides
This is a basic accounting and bookkeeping chart ppt slides. This is a five stage process. The stages in this process are financial statements, source documents, accounting cycle, journals, ledger, trial balance.

Financial Public Relations Arrows Chart Powerpoint Templates
This is a financial public relations arrows chart powerpoint templates. This is a five stage process. The stages in this process are investor relations, consumer relations, government relations, public relations, internal communications, crisis communications.

Business Facilitation Skills Chart Presentation Deck
This is a business facilitation skills chart presentation deck. This is a eight stage process. The stages in this process are idea, investment, strategy, find valuable partner, employment, website, marketing, customer service.

Professional Retail Merchandising Chart Presentation Design
This is a professional retail merchandising chart presentation design. This is a seven stage process. The stages in this process are market trends, product assortment, individual product demand forecasting, product display and advertising, inventory, markdowns, purchase quantity, merchandising.
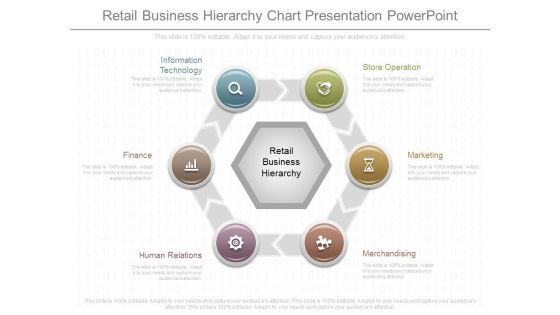
Retail Business Hierarchy Chart Presentation Powerpoint
This is a retail business hierarchy chart presentation powerpoint. This is a six stage process. The stages in this process are store operation, marketing, merchandising, human relations, finance, information technology.

Revenue And Expenditures Cycle Chart Ppt Design
This is a revenue and expenditures cycle chart ppt design. This is a four stage process. The stages in this process are cash check disbursement, cash check receipt journal, bank account, bank reconciliation.

Circular Flow Of Income Chart Ppt Presentation
This is a circular flow of income chart ppt presentation. This is a four stage process. The stages in this process are real estate, government, financial institutions, export import, firms.

Financial Marketing Solutions Chart Presentation Ideas
This is a financial marketing solutions chart presentation ideas. This is a eight stage process. The stages in this process are direct deposits, e commerce, prepaid cards, bill payments, money orders, small loans, mobile transaction, international money transfer.

Brand Building Circle Chart Ppt Example
This is a brand building circle chart ppt example. This is a seven stage process. The stages in this process are long term perspective, positioning, quality, well blended communication, credibility, internal marketing, repositioning, brand building.

Customer Engagement Touch Points Chart Ppt Sample
This is a customer engagement touch points chart ppt sample. This is a seven stage process. The stages in this process are research, consider and evaluate, awareness, formal rfp, use and service, buy, loyalty repurchase.

Sales Channel Strategy Chart Powerpoint Show
This is a sales channel strategy chart powerpoint show. This is a four stage process. The stages in this process are channel integration, better offer, channel selection, more front of mind.

Conversion Funnel Optimization Chart Powerpoint Idea
This is a conversion funnel optimization chart powerpoint idea. This is a seven stage process. The stages in this process are viewers, question, website visitors, sales, interest, purchase, qualified inquiries.

Continuous Market Research Chart Presentation Visuals
This is a continuous market research chart presentation visuals. This is a nine stage process. The stages in this process are opportunity, purchase behavior, past experience, needs wants, word of mouth, external comms, advertising, media consumption, communication.

Business To Business Sales Chart Presentation Images
This is a business to business sales chart presentation images. This is a six stage process. The stages in this process are your business, marketing, reactive existing customers, culture, reach new customers, sales.

Business Economic Cycle Chart Ppt Templates
This is a business economic cycle chart ppt templates. This is a four stage process. The stages in this process are economic prosperity, falling prices, economic depression, rising prices.

Customer Use Cases Infogarphic Chart Ppt Slide
This is a customer use cases infogarphic chart ppt slide. This is a five stage process. The stages in this process are medical and healthcare, transportation and mobility, industrial and commercial, logistics and networking, defence and aerospace.

Competitive Analysis Table Chart Powerpoint Guide
This is a competitive analysis table chart powerpoint guide. This is a twelve stage process. The stages in this process are jan,feb, mar, apr, may, jun, jul, aug, sep, oct, nov, dec.

Partner Sales Cloud Infographic Chart Powerpoint Graphics
This is a partner sales cloud infographic chart powerpoint graphics. This is a six stage process. The stages in this process are news and events, marketing literature, sales tools, channel incentives, product promotions, deal registration.

Sales Deal Steps Funnel Chart Ppt Templates
This is a sales deal steps funnel chart ppt templates. This is a eight stage process. The stages in this process are discovery, pre qualification, qualification, solution design, evaluation, decision, negotiation, closed.
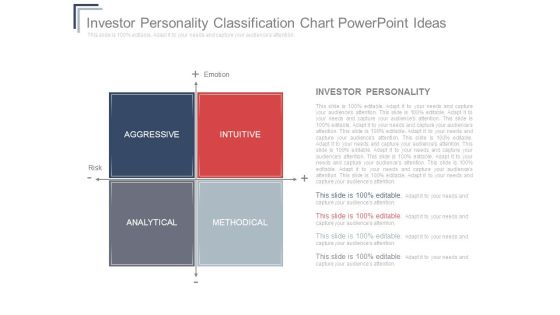
Investor Personality Classification Chart Powerpoint Ideas
This is a investor personality classification chart powerpoint ideas. This is a four stage process. The stages in this process are aggressive, intuitive, analytical, methodical, emotion, risk, investor personality.
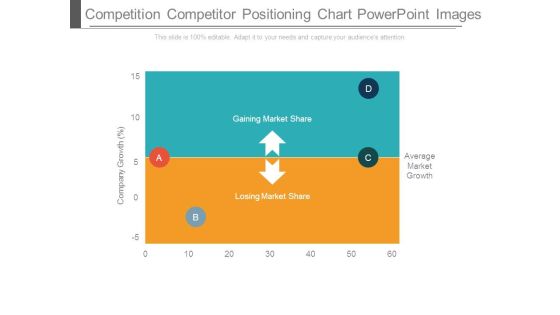
Competition Competitor Positioning Chart Powerpoint Images
This is a competition competitor positioning chart powerpoint images. This is a four stage process. The stages in this process are gaining market share, losing market share, average market growth, company growth.

Digital Marketing Roadmap Gantt Chart Ppt Slide
This is a digital marketing roadmap gantt chart ppt slide. This is a five stage process. The stages in this process are content, paid organic search, email marketing, social media.
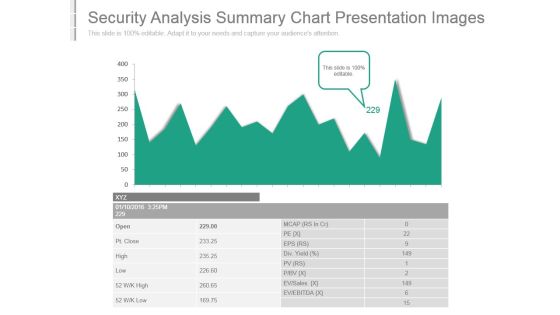
Security Analysis Summary Chart Presentation Images
This is a security analysis summary chart presentation images. This is a one stage process. The stages in this process are ev ebitda, ev sales, div yield, open, pt close, high, low, mcap, eps.
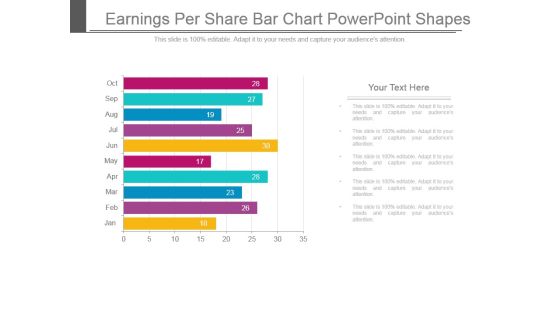
Earnings Per Share Bar Chart Powerpoint Shapes
This is a earnings per share bar chart powerpoint shapes. This is a ten stage process. The stages in this process are jan, feb, mar, apr, may, jun, jul, aug, sep, oct.

PowerPoint Theme Chart Contributing Factors Ppt Templates
PowerPoint Theme Chart Contributing Factors PPT Templates-PowerPoint Process Teamwork Contributing Factors PPT Themes-Explore the various directions and layers existing in your in your plans and processes. Unravel the desired and essential elements of your overall strategy. Explain the relevance of the different layers and stages and directions in getting down to your core competence, ability and desired result.-PowerPoint Theme Chart Contributing Factors PPT Templates
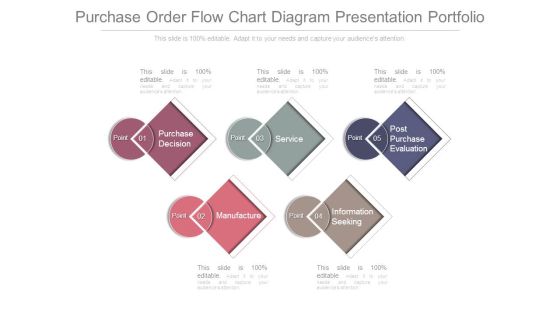
Purchase Order Flow Chart Diagram Presentation Portfolio
This is a purchase order flow chart diagram presentation portfolio. This is a five stage process. The stages in this process are purchase decision, service, post purchase evaluation, point, manufacture, information seeking.
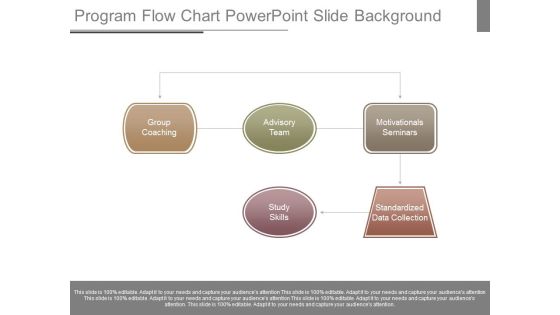
Program Flow Chart Powerpoint Slide Background
This is a program flow chart powerpoint slide background. This is a five stage process. The stages in this process are group coaching, advisory team, study skills, motivationals seminars, standardized data collection.

Representing Diverging Circular Flow Chart PowerPoint Templates
We present our representing diverging circular flow chart PowerPoint templates.Present our Ring charts PowerPoint Templates because this PPt slide helps you to measure key aspects of the current process and collect relevant data. Download our Circle charts PowerPoint Templates because the mind is always whirring with new ideas. Download our Process and Flows PowerPoint Templates because you have a clear vision of the cake you want. Download our Business PowerPoint Templates because you can Flutter your wings and enchant the world. Impress them with the innate attractiveness of your thoughts and words. Download our Marketing PowerPoint Templates because with the help of our Slides you can Illustrate your ideas one by one and demonstrate how each is an important cog in running the entire wheel.Use these PowerPoint slides for presentations relating to Circle, circulation, cobalt,colorful, cyan, cycle, element,emblem, grayshadow, green,icon, indicator, interface, internet, label,link, load, marker, motion, movement,navigationpanel, next, orientation, pagsite, pink, pointer, previous, process, reload, rotation, satined, sign, signpost,smooth, sticker, sticky, symbol. The prominent colors used in the PowerPoint template are Green, Black, White. Customers tell us our representing diverging circular flow chart PowerPoint templates will make the presenter successul in his career/life. We assure you our cobalt PowerPoint templates and PPT Slides are Nifty. PowerPoint presentation experts tell us our representing diverging circular flow chart PowerPoint templates are Fabulous. People tell us our grayshadow PowerPoint templates and PPT Slides will help you be quick off the draw. Just enter your specific text and see your points hit home. We assure you our representing diverging circular flow chart PowerPoint templates are Excellent. Use our cobalt PowerPoint templates and PPT Slides have awesome images to get your point across.

Business Workflow Chart Ppt Presentation Visuals
This is a business workflow chart ppt presentation visuals. This is a one stage process. The stages in this process are purchasing, receiving, manufacturing, quality assurance, inventory, packaging, sales, distribution, shipping, customer service.

Procurement Flow Chart Presentation Powerpoint Example
This is a procurement flow chart presentation powerpoint example. This is a four stage process. The stages in this process are procurement, epayments, order products and services, receive products.
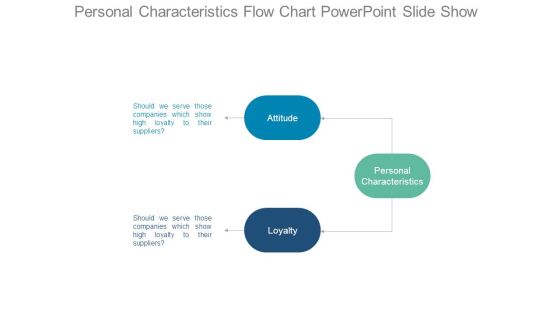
Personal Characteristics Flow Chart Powerpoint Slide Show
This is a personal characteristics flow chart powerpoint slide show. This is a three stage process. The stages in this process are should we serve those companies which show high loyalty to their suppliers, attitude, loyalty, personal characteristics.

Pricing Research Flow Chart Ppt Sample Download
This is a pricing research flow chart ppt sample download. This is a three stage process. The stages in this process are price customers are waiting to pay, price dictated by competition, optimal price, price for sustainability.

Business Model Canvas Chart Example Ppt Presentation
This is a business model canvas chart example ppt presentation. This is a five stage process. The stages in this process are key partners, key activities, value propositions, customer relationships, customer segments, key resources, channels, cost structure, revenue streams.

New Business Model Chart Presentation Powerpoint Example
This is a new business model chart presentation powerpoint example. This is a five stage process. The stages in this process are key partners, key activities, value propositions, customer, relationships, customer segments, key resources, channels, cost structure, revenue streams.
Daily Schedule Circular Chart Ppt Powerpoint Guide
This is a daily schedule circular chart ppt powerpoint guide. This is a seven stage process. The stages in this process are develop proposal, submit and negotiate, award setup, manage subawards, execute project, close out project, define opportunity.
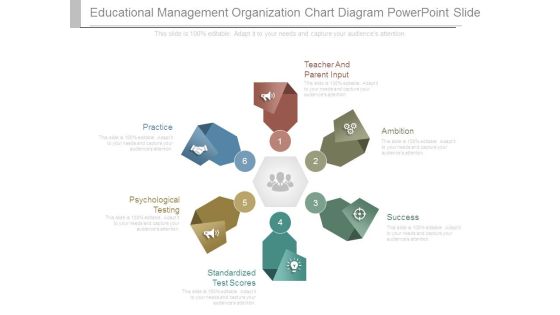
Educational Management Organization Chart Diagram Powerpoint Slide
This is a educational management organization chart diagram powerpoint slide. This is a six stage process. The stages in this process are teacher and parent input, ambition, success, standardized test scores, psychological testing, practice.
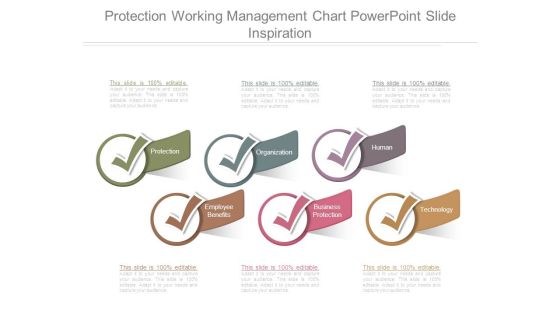
Protection Working Management Chart Powerpoint Slide Inspiration
This is a protection working management chart powerpoint slide inspiration. This is a six stage process. The stages in this process are protection, organization, human, employee benefits, business protection, technology.

Management Information System Chart Powerpoint Slide Download
This is a management information system chart powerpoint slide download. This is a six stage process. The stages in this process are technology, generate order, check credit, people, ship product, sales.
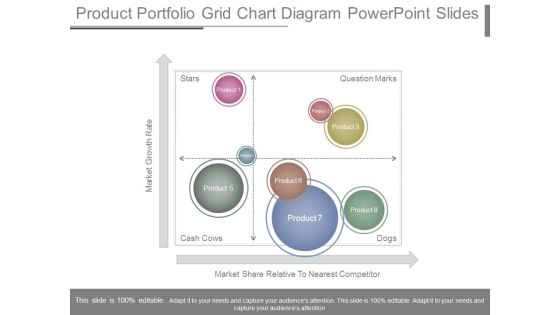
Product Portfolio Grid Chart Diagram Powerpoint Slides
This is a product portfolio grid chart diagram powerpoint slides. This is a four stage process. The stages in this process are market growth rate, market share relative to nearest competitor, stars, cash cows, dogs, question marks, product.

Workforce Performance Comparison Chart Powerpoint Slides Templates
This is a workforce performance comparison chart powerpoint slides templates. This is a two stage process. The stages in this process are customer focus, accountability, service excellence, problem solving, continuous improvement, collaborative conflict resolution.

Governance Growth System Chart Example Of Ppt
This is a governance growth system chart example of ppt. This is a four stage process. The stages in this process are accountable government, solid institution, political system, socio economic growth, governance.
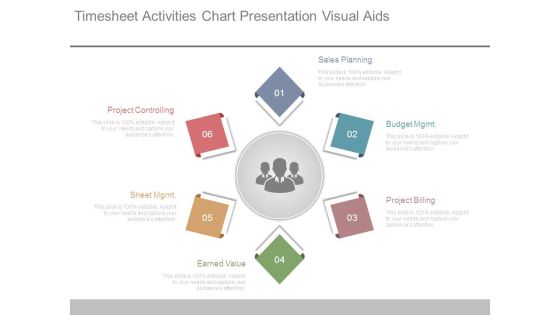
Timesheet Activities Chart Presentation Visual Aids
This is a timesheet activities chart presentation visual aids. This is a six stage process. The stages in this process are sales planning, budget mgmt, project billing, earned value, sheet mgmt, project controlling.

Business Communication Skills Chart Powerpoint Slide Themes
This is a business communication skills chart powerpoint slide themes. This is a eight stage process. The stages in this process are accent reduction, communication, strategic planning, articulation, stakeholder analysis, language, measurement tools, fluency.
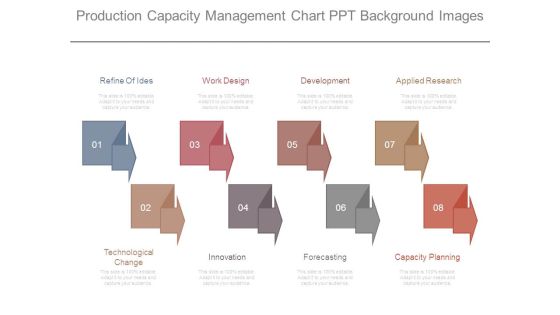
Production Capacity Management Chart Ppt Background Images
This is a production capacity management chart ppt background images. This is a eight stage process. The stages in this process are refine of ides, work design, development, applied research, technological change, innovation, forecasting, capacity planning.

Bcg Portfolio Analysis Chart Powerpoint Slides Background
This is a bcg portfolio analysis chart powerpoint slides background. This is a four stage process. The stages in this process are question marks, stars, cash cows, poor dogs.

Competition Competitor Positioning Chart Powerpoint Slide Themes
This is a competition competitor positioning chart powerpoint slide themes. This is a four stage process. The stages in this process are gaining market share, losing market share, average market growth, company growth.

Workforce Management Example Chart Powerpoint Templates Microsoft
This is a workforce management example chart powerpoint templates microsoft. This is a six stage process. The stages in this process are staff planning, staff tracking, job opportunities, staff training, staff transition.
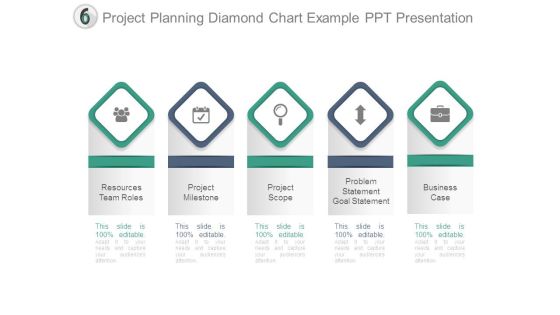
Project Planning Diamond Chart Example Ppt Presentation
This is a project planning diamond chart example ppt presentation. This is a five stage process. The stages in this process are resources team roles, project milestone, project scope, problem statement goal statement, business case.
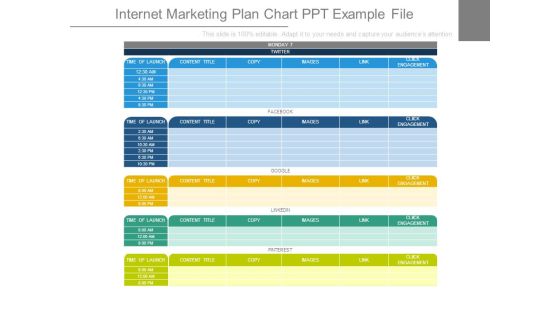
Internet Marketing Plan Chart Ppt Example File
This is a internet marketing plan chart ppt example file. This is a five stage process. The stages in this process are monday, twitter, time of launch, content title, copy, images, link, click engagement, face book, google, linkedin, pinterest.

Banking Operations Management Chart Good Ppt Example
This is a banking operations management chart good ppt example. This is a seven stage process. The stages in this process are results, accountability, focused action, commitment, roles and responsibilities, communication and collaboration, trust.

Category Management Training Chart Ppt Slides Styles
This is a category management training chart ppt slides styles. This is a four stage process. The stages in this process are category prioritization and assessment, result tracking and reporting, category strategy development, supplier relationship.
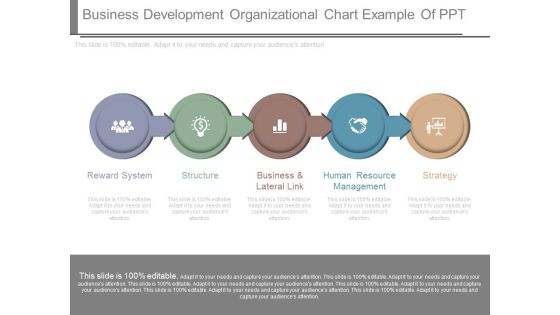
Business Development Organizational Chart Example Of Ppt
This is a business development organizational chart example of ppt. This is a five stage process. The stages in this process are reward system, structure, business and lateral link, human resource management, strategy.
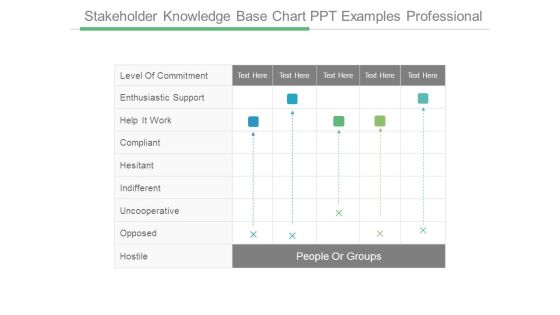
Stakeholder Knowledge Base Chart Ppt Examples Professional
This is a stakeholder knowledge base chart ppt examples professional. This is a five stage process. The stages in this process are people or groups, level of commitment, enthusiastic support, help it work, compliant, hesitant, indifferent, uncooperative, opposed, hostile.
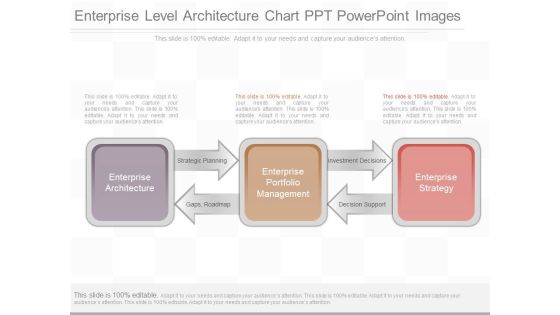
Enterprise Level Architecture Chart Ppt Powerpoint Images
This is a enterprise level architecture chart ppt powerpoint images. This is a three stage process. The stages in this process are enterprise architecture, strategic planning, gaps, roadmap, enterprise portfolio management, investment decisions, decision support, enterprise strategy.
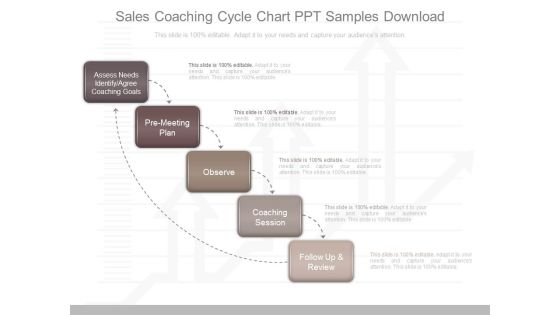
Sales Coaching Cycle Chart Ppt Samples Download
This is a sales coaching cycle chart ppt samples download. This is a five stage process. The stages in this process are assess needs identify agree coaching goals, pre meeting plan, observe, coaching session, follow up and review.
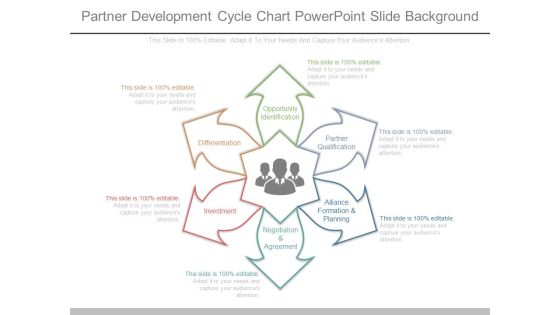
Partner Development Cycle Chart Powerpoint Slide Background
This is a partner development cycle chart powerpoint slide background. This is a six stage process. The stages in this process are opportunity identification, partner qualification, alliance formation and planning, negotiation and agreement, investment, differentiation.

Operational Support Chart Presentation Powerpoint Templates
This is a operational support chart presentation powerpoint templates. This is a five stage process. The stages in this process are regulatory strategy, project management, regulatory operations, network of expert, quality.
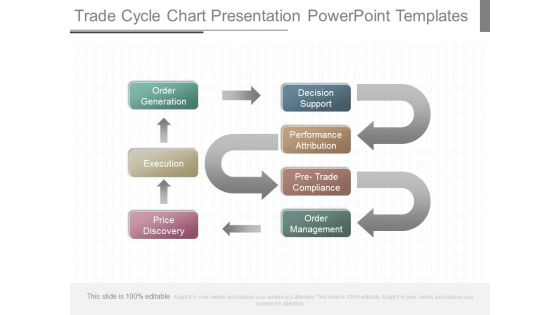
Trade Cycle Chart Presentation Powerpoint Templates
This is a trade cycle chart presentation powerpoint templates. This is a four stage process. The stages in this process are order generation, execution, price discovery, decision support, performance attribution, pre trade compliance, order management.

Operational Support Chart Presentation Powerpoint Slides
This is a operational support chart presentation powerpoint slides. This is a five stage process. The stages in this process are regulatory strategy, project management, regulatory operations, network of expert, quality, real regularly.
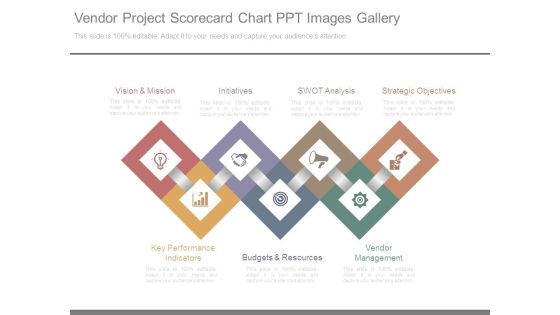
Vendor Project Scorecard Chart Ppt Images Gallery
This is a vendor project scorecard chart ppt images gallery. This is a seven stage process. The stages in this process are vision and mission, initiatives, swot analysis, strategic objectives, vendor management, budgets and resources, key performance indicators.

Employee Life Cycle Chart Powerpoint Templates Microsoft
This is a employee life cycle chart powerpoint templates microsoft. This is a six stage process. The stages in this process are training, appraisal, payroll run, attendance, separation, manage performance.

Retail Merchandising Activities Chart Presentation Background Images
This is a retail merchandising activities chart presentation background images. This is a six stage process. The stages in this process are customer, print advertising, electronic advertising, marketing collateral, store displays, promotional activities, store images.
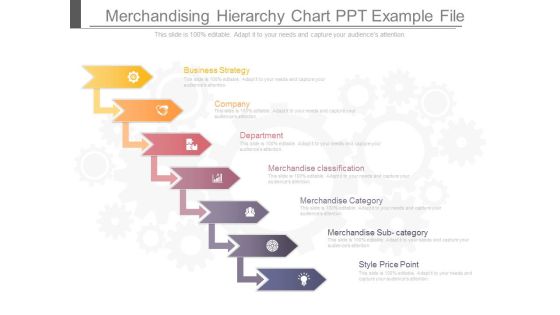
Merchandising Hierarchy Chart Ppt Example File
This is a merchandising hierarchy chart ppt example file. This is a seven stage process. The stages in this process are business strategy, company, department, merchandise classification, merchandise category, merchandise sub category, style price point.
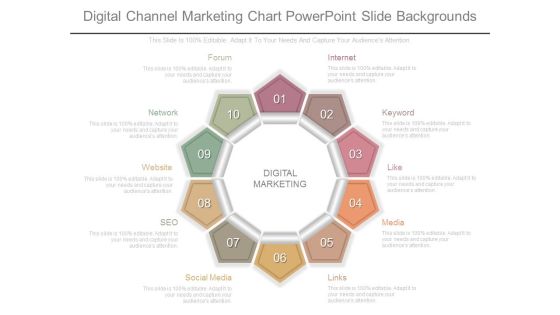
Digital Channel Marketing Chart Powerpoint Slide Backgrounds
This is a digital channel marketing chart powerpoint slide backgrounds. This is a ten stage process. The stages in this process are digital marketing, internet, keyword, like, media, links, social media, seo, website, network, forum.

International Portfolio Functions Chart Ppt Examples Professional
This is a international portfolio functions chart ppt examples professional. This is a five stage process. The stages in this process are value, tools for cash, human capital, alignment, balance.

Business Solutions Development Chart Powerpoint Slide Show
This is a business solutions development chart powerpoint slide show. This is a six stage process. The stages in this process are business value, resource leveraging, strategic positioning, developing people, creativity and innovation, focus on performance.

Key Communications Activities Chart Layout Powerpoint Slides
This is a key communications activities chart layout powerpoint slides. This is a five stage process. The stages in this process are start of project, cost effective, equal and inclusive, clearly branded, end of project.

Business Assessment Ppt Chart Powerpoint Slides Show
This is a business assessment ppt chart powerpoint slides show. This is a six stage process. The stages in this process are mission, goals, objectives, outcomes, result analysis, action.
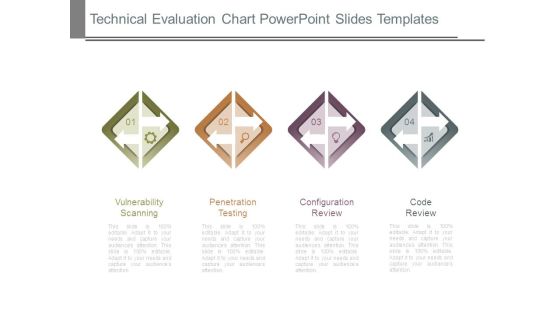
Technical Evaluation Chart Powerpoint Slides Templates
This is a technical evaluation chart powerpoint slides templates. This is a four stage process. The stages in this process are vulnerability scanning, penetration testing, configuration review, code review.

Project Issues Description Chart Powerpoint Slide Graphics
This is a project issues description chart powerpoint slide graphics. This is a seven stage process. The stages in this process are issue description, reported on, reported by, owner, severity, priority, status.

Project Issues Infogarphic Chart Ppt Examples Slides
This is a project issues infogarphic chart ppt examples slides. This is a seven stage process. The stages in this process are issue description, reported on, reported by, owner, severity, priority, status.
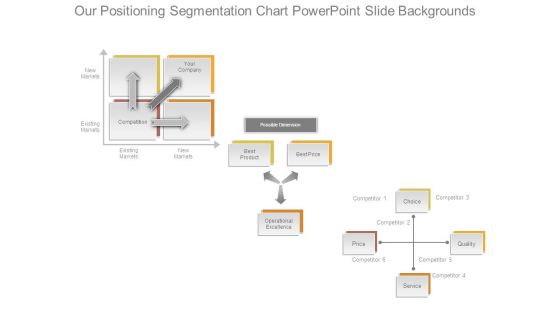
Our Positioning Segmentation Chart Powerpoint Slide Backgrounds
This is a our positioning segmentation chart powerpoint slide backgrounds. This is a three stage process. The stages in this process are new markets, existing markets, your company, competition, possible dimension, best product, operational excellence, service, price, choice.
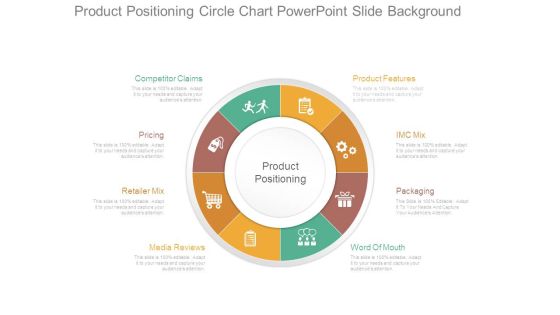
Product Positioning Circle Chart Powerpoint Slide Background
This is a product positioning circle chart powerpoint slide background. This is a eight stage process. The stages in this process are competitor claims, pricing, retailer mix, media reviews, product positioning, product features, imc mix, packaging, word of mouth.
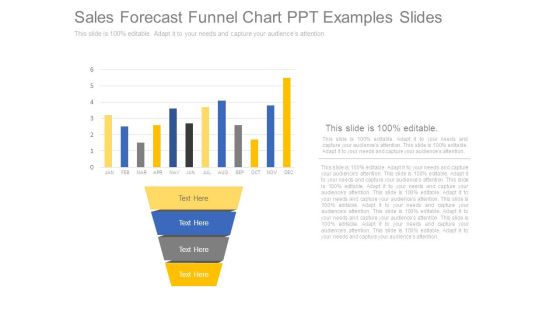
Sales Forecast Funnel Chart Ppt Examples Slides
This is a sales forecast funnel chart ppt examples slides. This is a four stage process. The stages in this process are jan, feb, mar, apr, may, jun, jul, aug, sep, oct, nov, dec.

Competitive Analysis Matrix Chart Ppt Samples Download
This is a competitive analysis matrix chart ppt samples download. This is a six stage process. The stages in this process are competitor, jan, feb, mar, apr, may, jun, jul, aug, sep, oct, nov, dec.

Six Sigma Strands Chart Ppt Examples Slides
This is a six sigma strands chart ppt examples slides. This is a six stage process. The stages in this process are bottom line, trained individuals, data driven approach, customer focused, project by project, engagement, benefits of six sigma.
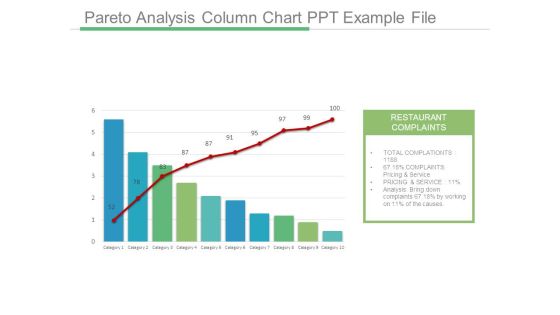
Pareto Analysis Column Chart Ppt Example File
This is a pareto analysis column chart ppt example file. This is a ten stage process. The stages in this process are restaurant complaints, total complaints, complaints pricing and service, pricing and service, analysis bring down complaints, category.
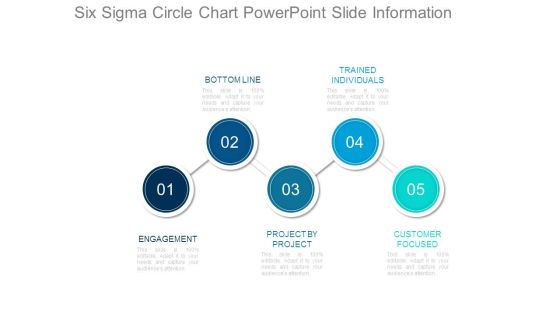
Six Sigma Circle Chart Powerpoint Slide Information
This is a six sigma circle chart powerpoint slide information. This is a five stage process. The stages in this process are bottom line, trained individuals, engagement, project by project, customer focused.
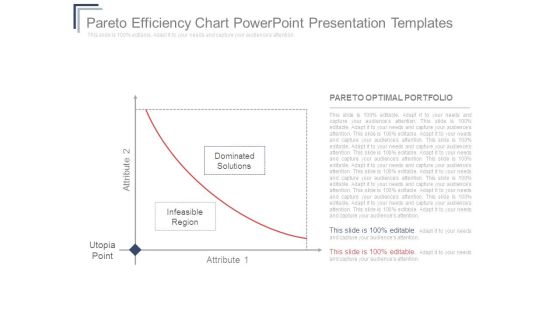
Pareto Efficiency Chart Powerpoint Presentation Templates
This is a pareto efficiency chart powerpoint presentation templates. This is a two stage process. The stages in this process are attribute 2, utopia, point, infeasible region, dominated, solutions, attribute 1, pareto optimal portfolio.

Risk Return Chart Ppt Slide Template
This is a risk return chart ppt slide template. This is a four stage process. The stages in this process are probability of technical success, bread and butter, pearls, oysters.

Customer Experience Survey Chart Powerpoint Templates Download
This is a customer experience survey chart powerpoint templates download. This is a four stage process. The stages in this process are satisfy unstated, customer needs, achieve customer delight, meet basic, customer requirements.

Organizational Design Chart Ppt Samples Download
This is a organizational design chart ppt samples download. This is a five stage process. The stages in this process are owners, stockholders and shareholders, board of directors president, chief, executive officer ceo, senior vice president.

Customer Revenue Statistical Chart Powerpoint Templates Microsoft
This is a customer revenue statistical chart powerpoint templates microsoft. This is a ten stage process. The stages in this process are email, display retargeting, comparison shopping, display, affiliates, inbound free links, brand organic search, brand paid search.
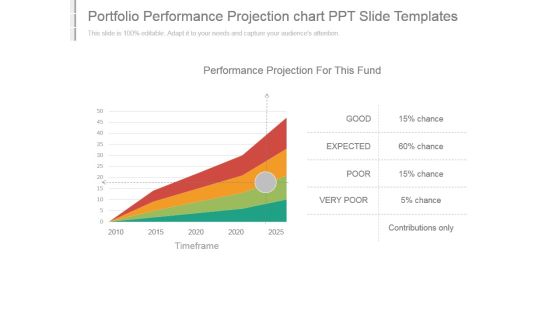
Portfolio Performance Projection Chart Ppt Slide Templates
This is a portfolio performance projection chart ppt slide templates. This is a four stage process. The stages in this process are performance projection for this fund, good, expected, poor, very poor, contributions only, timeframe.
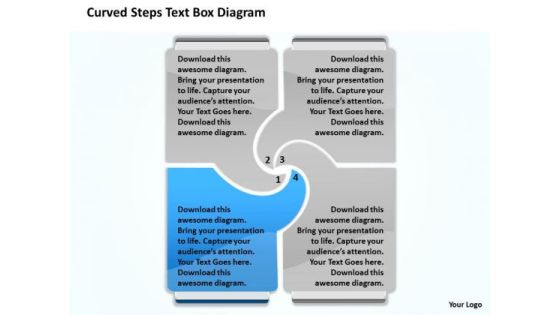
Flow Chart Business Diagram PowerPoint Templates 2003
We present our flow chart business diagram powerpoint templates 2003.Present our Process and flows PowerPoint Templates because Our PowerPoint Templates and Slides will generate and maintain the level of interest you desire. They will create the impression you want to imprint on your audience. Download our Flow Charts PowerPoint Templates because Our PowerPoint Templates and Slides offer you the widest possible range of options. Download our Business PowerPoint Templates because You are an avid believer in ethical practices. Highlight the benefits that accrue with our PowerPoint Templates and Slides. Use our Targets PowerPoint Templates because Our PowerPoint Templates and Slides will let you Illuminate the road ahead to Pinpoint the important landmarks along the way. Use our Shapes PowerPoint Templates because You are an avid believer in ethical practices. Highlight the benefits that accrue with our PowerPoint Templates and Slides.Use these PowerPoint slides for presentations relating to Advice, analysis, business, chart, circle, concept, continuous, control, cycle, diagram, education, evaluate, hand, idea, identify, improve, improvement, industry, loop, man, manage, management, manager, meeting, method, model, monitor, office, person, plan, pointing, presentation, process, risk, seminar, sign, stage, step, strategy. The prominent colors used in the PowerPoint template are Blue , White, Gray. Professionals tell us our flow chart business diagram powerpoint templates 2003 are second to none. Presenters tell us our circle PowerPoint templates and PPT Slides will make the presenter successul in his career/life. The feedback we get is that our flow chart business diagram powerpoint templates 2003 are aesthetically designed to attract attention. We guarantee that they will grab all the eyeballs you need. Use our chart PowerPoint templates and PPT Slides will make the presenter look like a pro even if they are not computer savvy. You can be sure our flow chart business diagram powerpoint templates 2003 are aesthetically designed to attract attention. We guarantee that they will grab all the eyeballs you need. Customers tell us our business PowerPoint templates and PPT Slides are incredible easy to use.
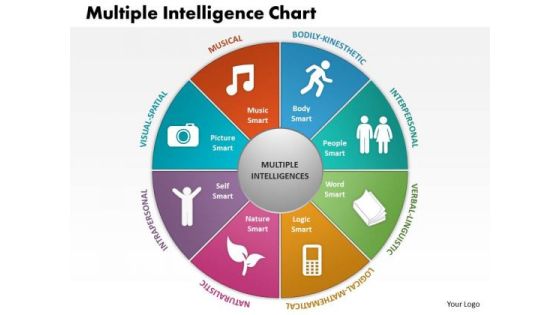
Business Framework Multiple Intelligence Chart PowerPoint Presentation
This business framework power point template has been designed with graphic of multiple intelligence chart. This kind of charts are used for testing and assessment process of any business. Add this template in your presentation and show creative ideas graphically.

Pie Chart Ppt PowerPoint Presentation Ideas Mockup
This is a pie chart ppt powerpoint presentation ideas mockup. This is a five stage process. The stages in this process are business, marketing, process, planning, strategy.
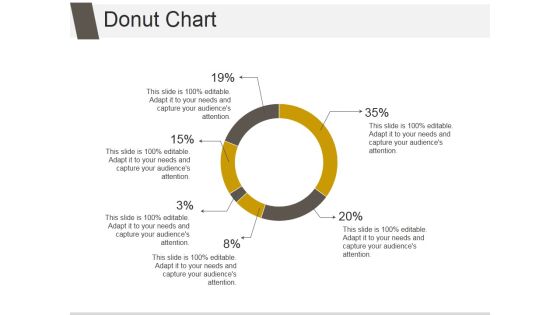
Donut Chart Ppt PowerPoint Presentation Background Images
This is a donut chart ppt powerpoint presentation background images. This is a six stage process. The stages in this process are business, marketing, process, planning, strategy.
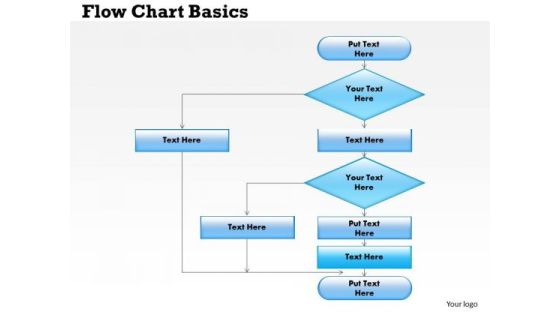
Business Framework Flow Chart Basics PowerPoint Presentation
This business framework power point image template has been crafted with graphic of flow chart. This PPT diagram contains the concept of process flow and management. Use this PPT diagram for your organizational and management related presentations.
Pyramid Chart With Business Icons Powerpoint Slides
This PowerPoint template slide contains five steps pyramid chart. This PowerPoint diagram is suitable to present sales processes steps. Download this business slide to make impressive presentations.
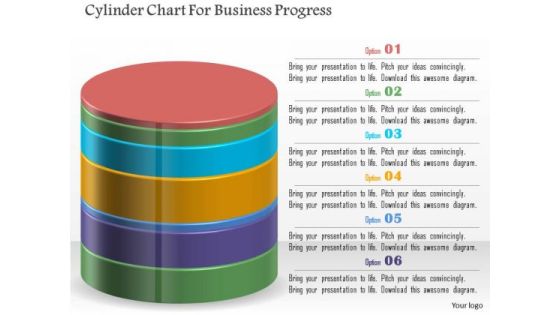
Cylinder Chart For Business Progress PowerPoint Template
The above template displays a cylinder chart. This diagram has been professionally designed to emphasize on concept of business progress. Grab centre stage with this slide.

Event Planning Details Organizational Chart Information PDF
The slide showcases an organization chart clarifying roles and responsibilities and report relationships between team members. It includes venue coordinator, program coordinator, marketing coordinator, hospitality coordinator and merchandising coordinator. Presenting Event Planning Details Organizational Chart Information PDF to dispense important information. This template comprises five stages. It also presents valuable insights into the topics including Program Coordinator, Marketing Coordinator, Hospitality Coordinator. This is a completely customizable PowerPoint theme that can be put to use immediately. So, download it and address the topic impactfully.
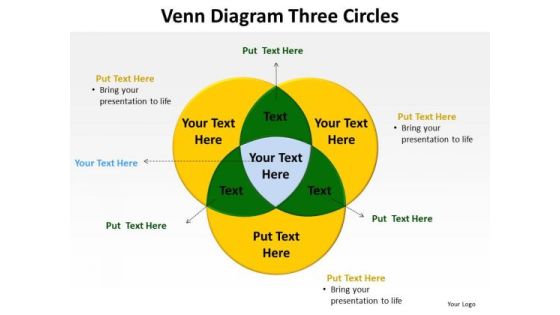
PowerPoint Backgrounds Chart Venn Diagram Ppt Design
PowerPoint Backgrounds Chart Venn Diagram PPT Design-The Venn graphic comprising interlinking circles geometrically demonstrate how various functions operating independently, to a large extent, are essentially interdependent. Amplify on this basic corporate concept and forefront the benefits of overlapping processes to arrive at common goals.-Background, Black, Blue, Business, Chart, Circle, Diagram, Drop, Financial, Green, Icon, Isolated, Overlapping, Process, Red, Round, Shadow, Shape, Three, Transparency, Vector, Venn, White

Business Market Research Services Chart Slides
This is a business market research services chart slides. This is a five stage process. The stages in this process are detailed demographic and expenditure reports, competitive analysis trends and benchmarks, industry and economic profile by region, sme performance reports by sector, information on businesses in canada and north america.

Solar Technology Implementation Grid Chart Elements PDF
Presenting Solar Technology Implementation Grid Chart Elements PDF to dispense important information. This template comprises six stages. It also presents valuable insights into the topics including Creation, Distribution, Industrial, Services. This is a completely customizable PowerPoint theme that can be put to use immediately. So, download it and address the topic impactfully.
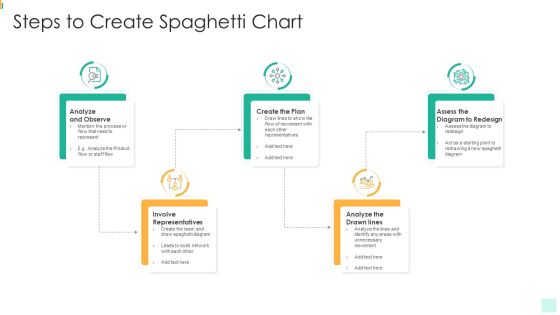
Steps To Create Spaghetti Chart Guidelines PDF
Presenting steps to create spaghetti chart guidelines pdf to dispense important information. This template comprises five stages. It also presents valuable insights into the topics including team, network, analyze. This is a completely customizable PowerPoint theme that can be put to use immediately. So, download it and address the topic impactfully.
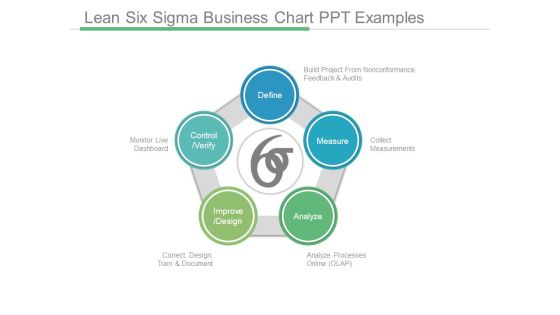
Lean Six Sigma Business Chart Ppt Examples
This is a lean six sigma business chart ppt examples. This is a five stage process. The stages in this process are define build project from nonconformance feedback and audits, measure collect measurements, analyze processes online olap, improve design correct design train and document, control verify monitor live dashboard.
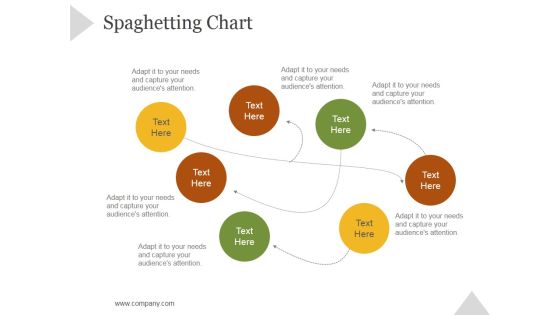
Spaghetting Chart Ppt PowerPoint Presentation Tips
This is a spaghetting chart ppt powerpoint presentation tips. This is a seven stage process. The stages in this process are business, strategy, marketing, success, process, arrow.

Contingency Planning Flow Chart Ppt Examples Slides
This is a contingency planning flow chart ppt examples slides. This is a three stage process. The stages in this process are contingency planning, description of potential problem, probability and impact, main impact of potential problem, workaround the problem, scope of contingency, consequence of workaround, preparation, activation.

Sales Performance Wheel Chart Ppt Examples Professional
This is a sales performance wheel chart ppt examples professional. This is a ten stage process. The stages in this process are performance management, system and governance, supplier relationship management, result tracking and reporting, information technology, category plan development, trading partners relationship, organizational capabilities, business alignment, strategy and business process.
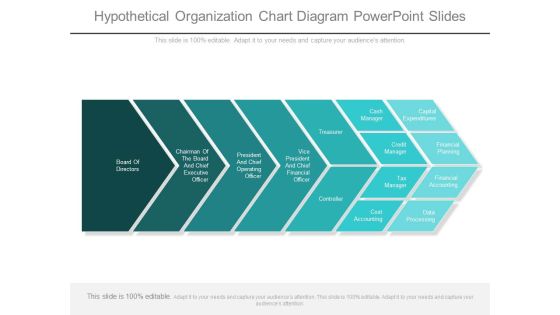
Hypothetical Organization Chart Diagram Powerpoint Slides
This is a hypothetical organization chart diagram powerpoint slides. This is a seven stage process. The stages in this process are board of directors, chairman of the board and chief executive officer, president and chief operating officer, vice president and chief financial officer, treasurer, controller, cash manager, capital expenditures, credit manager, financial planning, tax manager, financial accounting, cost accounting, data processing.
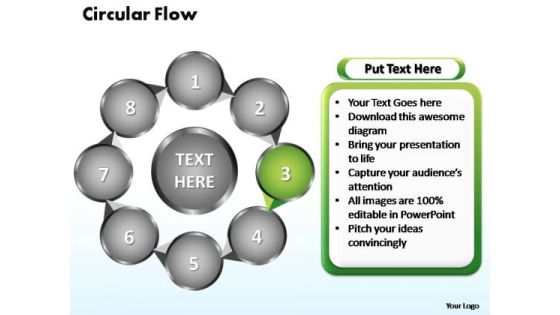
PowerPoint Slides Circular Flow Chart Ppt Theme
PowerPoint Slides Circular Flow Chart PPT Theme-Flowchart is a simple mapping tool that shows the sequence of actions within a process. Flowchart is widely used in business, education and economic presentations to help the audience visualize the content better, or to find flaws in a process.-PowerPoint Slides Circular Flow Chart PPT Theme
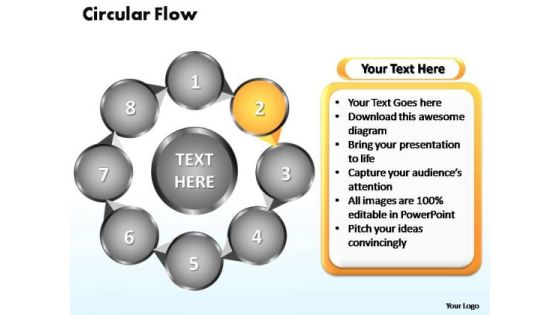
PowerPoint Slides Circular Flow Chart Ppt Themes
PowerPoint Slides Circular Flow Chart PPT Themes-Flowchart is a simple mapping tool that shows the sequence of actions within a process. Flowchart is widely used in business, education and economic presentations to help the audience visualize the content better, or to find flaws in a process.-PowerPoint Slides Circular Flow Chart PPT Themes

PowerPoint Slides Circular Flow Chart Ppt Template
PowerPoint Slides Circular Flow Chart PPT Template-Flowchart is a simple mapping tool that shows the sequence of actions within a process. Flowchart is widely used in business, education and economic presentations to help the audience visualize the content better, or to find flaws in a process.-PowerPoint Slides Circular Flow Chart PPT Template
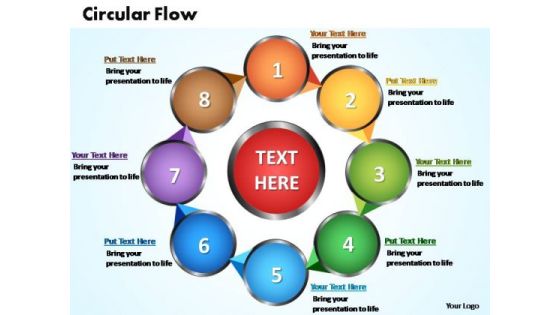
PowerPoint Slides Circular Flow Chart Ppt Templates
PowerPoint Slides Circular Flow Chart PPT Templates-Flowchart is a simple mapping tool that shows the sequence of actions within a process. Flowchart is widely used in business, education and economic presentations to help the audience visualize the content better, or to find flaws in a process.-PowerPoint Slides Circular Flow Chart PPT Templates
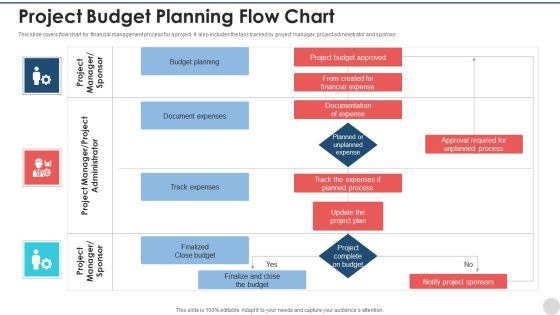
Project Budget Planning Flow Chart Inspiration PDF
This slide covers flow chart for financial management process for a project. It also includes the task tracked by project manager, project administrator and sponsor. Showcasing this set of slides titled project budget planning flow chart inspiration pdf. The topics addressed in these templates are budget planning, document expenses, track expenses, finalized close budget. All the content presented in this PPT design is completely editable. Download it and make adjustments in color, background, font etc. as per your unique business setting.
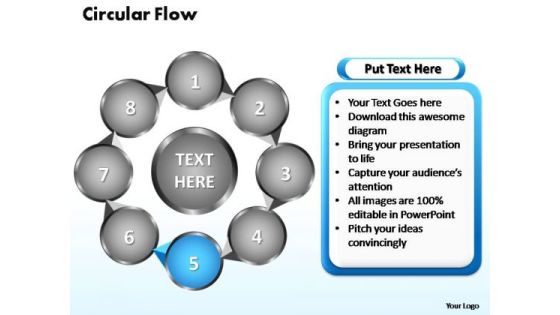
PowerPoint Slides Circular Flow Chart Ppt Design
PowerPoint Slides Circular Flow Chart PPT Design-Flowchart is a simple mapping tool that shows the sequence of actions within a process. Flowchart is widely used in business, education and economic presentations to help the audience visualize the content better, or to find flaws in a process.-PowerPoint Slides Circular Flow Chart PPT Design
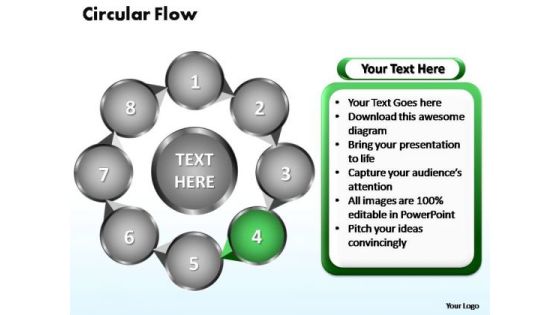
PowerPoint Slides Circular Flow Chart Ppt Designs
PowerPoint Slides Circular Flow Chart PPT Designs-Flowchart is a simple mapping tool that shows the sequence of actions within a process. Flowchart is widely used in business, education and economic presentations to help the audience visualize the content better, or to find flaws in a process.-PowerPoint Slides Circular Flow Chart PPT Designs
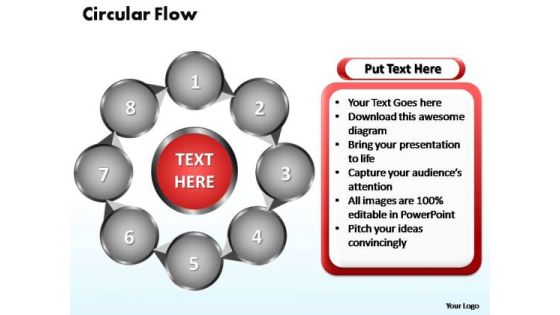
PowerPoint Slides Circular Flow Chart Ppt Layout
PowerPoint Slides Circular Flow Chart PPT Layout-Flowchart is a simple mapping tool that shows the sequence of actions within a process. Flowchart is widely used in business, education and economic presentations to help the audience visualize the content better, or to find flaws in a process.-PowerPoint Slides Circular Flow Chart PPT Layout

PowerPoint Slides Circular Flow Chart Ppt Layouts
PowerPoint Slides Circular Flow Chart PPT Layouts-Flowchart is a simple mapping tool that shows the sequence of actions within a process. Flowchart is widely used in business, education and economic presentations to help the audience visualize the content better, or to find flaws in a process.-PowerPoint Slides Circular Flow Chart PPT Layouts

 Home
Home